Leifer
Senior Member.
I just wanted to have some links on-hand, to point people toward if they want to "test", to avoid mistakes in the above thread.
I was just over at Global Skywatch, looking at Russ' attempt to start a sample database.....9 of 11 rainwater samples are completely normal. (well under limits)
.....no collection methods described.
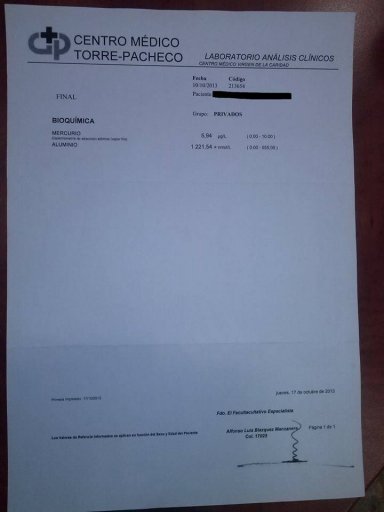
Edit: One over limit test for AL (300 ug/l) the user stated,
I was just over at Global Skywatch, looking at Russ' attempt to start a sample database.....9 of 11 rainwater samples are completely normal. (well under limits)
.....no collection methods described.
Edit: One over limit test for AL (300 ug/l) the user stated,
...and wrong, too.External Quote:Air was bubbled through the water during the collection period using a standard aquarium pump in order to capture airborne particulates in the water.
0.050 mg/L is the EPA "safe" limit for aluminum in drinking water. In the text below, aluminum levels are 6-times above the EPA maximum for drinking water.
")
")