You are using an out of date browser. It may not display this or other websites correctly.
You should upgrade or use an alternative browser.
You should upgrade or use an alternative browser.
Debunked: Shasta Snow and Water Aluminum Tests.
- Thread starter Chemtrail Kook
- Start date
U
Unregistered
Guest
More MJM for your enjoyment. One lie after another just to alarm people over nothing.
http://www.youtube.com/watch?v=aqIBQCgr5SU
http://www.youtube.com/watch?v=aqIBQCgr5SU
He claims there's 20 people with barium levels "1000 times the toxic level".
That's just nonsense. They would be dead if it were true. And it's not true, as they actually had levels in the normal range.
At best a misunderstanding or blindly parroting something. At worst a lie.
That's just nonsense. They would be dead if it were true. And it's not true, as they actually had levels in the normal range.
At best a misunderstanding or blindly parroting something. At worst a lie.
(Among the Truthers link moved to a new thread
https://www.metabunk.org/threads/168-Among-the-Truthers-(Book-and-Web-Site)
https://www.metabunk.org/threads/168-Among-the-Truthers-(Book-and-Web-Site)
Last edited:
Jay Reynolds
Senior Member.
The Most Supreme Irony of ALL TIME !
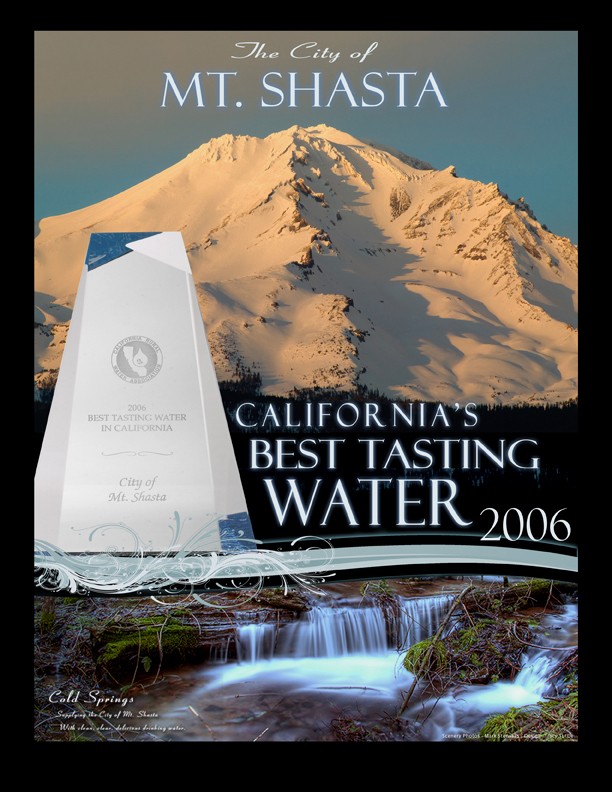
Mt. Shasta Water Wins Best Tasting Drinking Water in California
The primary water source for the City of Mt. Shasta is Cold Creek Springs, located at an elevation of 4,400 feet on Mt. Shasta. The springs produce around 2,000 gallons per minute of the purest, unfiltered and untreated water in the nation.
In fact, the City of Mt. Shasta's drinking water is the 2006 and 2008 winner of the California Rural Water Association's Best Tasting Drinking Water in California Award.
The City of Mt. Shasta also earned 3rd place in the 2007 Great American Water Taste Test, a national competition held annually in Washington D.C. Others may boast about having the best drinking water, but the City of Mt. Shasta has the awards to prove it!
UPDATE: The City of Mt. Shasta placed first in the 2010 Best Tasting Drinking Water in California competition at this year's CRWA conference in Lake Tahoe.
http://www.ci.mt-shasta.ca.us/publicworks/utilities.php

Last edited by a moderator:
Jay Reynolds
Senior Member.
Chemical Composition of Rock on Mt. Shasta
Note that Al2O3 in the table below is aluminum oxide, also known as alumina, or corundum and ruby in its crystalline form.
Units in percentage.
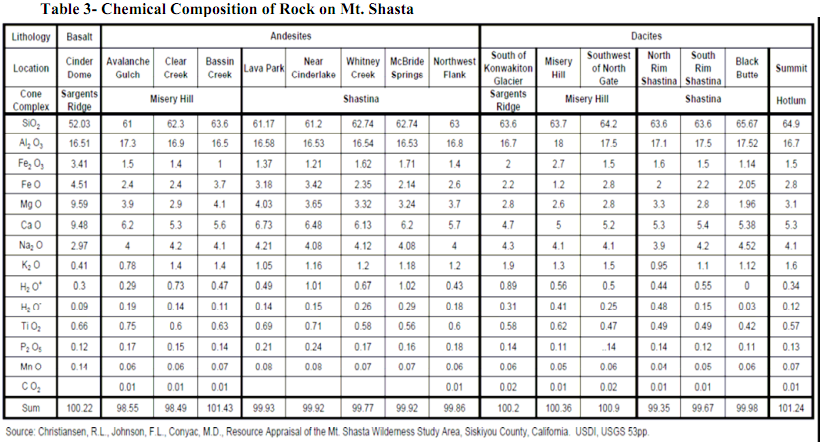
Note that Al2O3 in the table below is aluminum oxide, also known as alumina, or corundum and ruby in its crystalline form.
Units in percentage.

Last edited by a moderator:
Jay Reynolds
Senior Member.
I happened across this 2009 California Energy Commission public record transcript which describes the pond referred to in WITWATS as being 50 years old, and being fed by a spring, not a well. I wonder why the story was changed?
The transcript also shows the person AKA Mauro Oliveira giving his name as Mauro Martins.
I wonder what his true name is and why he uses more than one surname?
He claims that his group has spent "tens of thousands of dollars doing the research, and screaming and yelling, and not getting anywhere."
It also features Dane Wigington claiming to be a climate researcher who lectures at Chic State and Shasta Colleges.
I have never heard him make those claims before. Why did he say that then and not afterwards?
The group was told that aluminum makes up a large part of soil, and that the Commissioners would look into it.
http://www.energy.ca.gov/business_meetings/2009_transcripts/2009-05-27_TRANSCRIPT.PDF
Jay Reynolds
Senior Member.
A puzzling statement by the Mt. Shasta bunch has had me wondering. I had heard their claim mentioned several times by Michael Murphy that California should have no aluminum in their rain water because there was no aluminum there, and the mention that an unnamed 'hydro-geologist' had said so. I see this claim repeated at contrailscience.com comment by a poster named "Guy", and a quote to that effect:
http://contrailscience.com/where-did-all-the-planes-go/#comment-69931
Using the quote I find that it originates from a 12/2010 blog by Doug Craig in Redding, CA:
http://blogs.redding.com/dcraig/archives/2010/12/december-geoeng.html
In the comments section, a writer named "Mt. Rose", who I am guessing is Rose Taylor(AKA Rose Casebeer)
posed as a student and asked a USGS geologist why GROUND WATER doesn't contain much aluminum.
So, either "Mt. Rose" deliberately misread the response which speaks about aluminum DISSOLVED in ground water, or simply doesn't understand that aluminum compounds from minerals can be suspended in any water, be it from ground water, surface water, or rainfall.
I haven't seen much participation by any of the Shasta bunch on forums, not using their real names anyways. I suspect that they do write under assumed names.
The comments in the blog above do contain statements from Dane Wigington, Mauro Oleivera, and I suspect Rose Taylor. Their statements are informative to read to ascertain their personal take on what they are doing. Based on what they said last year, they were totally wrong and had no clue about what was the normal levels of aluminum in soil, air, or water.
After the comments made on that blog, they have no excuse. They KNOW that what was put out in WITWATS was WRONG, they KNEW this almost a year ago, yet haven't retracted any of it, or corrected what Michael Murphy continues to assert.
It was bad enough just being ignorant and thereby disseminating bunk to others in their community, to Murphy and G. Edward Griffin, and to the world at large via WITWATS.
KNOWINGLY continuing to let their errors continue uncorrected is a sign of real problems being able to accept responsibility and being able to live in the real world where your words have consequences.
The Shasta bunch will eventually be held accountable by the other folks that simply accepted what they were told, and they will not be happy about it.
http://contrailscience.com/where-did-all-the-planes-go/#comment-69931
Using the quote I find that it originates from a 12/2010 blog by Doug Craig in Redding, CA:
http://blogs.redding.com/dcraig/archives/2010/12/december-geoeng.html
In the comments section, a writer named "Mt. Rose", who I am guessing is Rose Taylor(AKA Rose Casebeer)
posed as a student and asked a USGS geologist why GROUND WATER doesn't contain much aluminum.
Mt. Rose said:The following addresses the "aluminum is abundant everywhere" claim by the "geo-engineering deniers" like Jack. A couple of years ago I sent an email to the Ask-A-Geologist@usgs.gov. The email I received was this:
Hi Ask A Geologist:
I am doing research for a school paper and wanted to know why California ground water does not have much aluminum in it, if any? Since aluminum is one of the most abundant metals in the earth's crust I would think there would be more in the ground waters here in California.
Thanks,
Rose
Rose,
Thanks for using the USGS Ask-A-Geologist program.
Oxygen (46.6%) and silicon (27.7%) are the most abundant elements of the Earth's crust. Aluminum is a far third at 8.1% and is not freely available in all rocks. It is very chemically reactive, therefore does not occur on it's own in nature. Instead it is bonded with other elements, most commonly as the aluminum ore bauxite.
So I would venture to say that you wouldn't see much aluminum dissolved in ground water unless there is a bauxite deposit nearby or seepage from industrial aluminum effluent.
Hope this helps.
_____________________
Sue Priest
U.S. Geological Survey
2255 N. Gemini Dr.
Flagstaff, AZ 86001
Phone - (928) 556-7148
Fax - (928) 556-7169
My comment: The US has very few aluminum bauxite deposits. California does not have any(those occur in places like Australia, Guam and tropical and subtropical places). Anybody can Google this and see the maps showing the bauxite deposits around the world and California definitely does not have any.
So, Jack you are relying on scientists who are really bad researchers or paid liars. If you were in school and I were your teacher I would tell you, you better go back and do your homework and more research.
So, either "Mt. Rose" deliberately misread the response which speaks about aluminum DISSOLVED in ground water, or simply doesn't understand that aluminum compounds from minerals can be suspended in any water, be it from ground water, surface water, or rainfall.
I haven't seen much participation by any of the Shasta bunch on forums, not using their real names anyways. I suspect that they do write under assumed names.
The comments in the blog above do contain statements from Dane Wigington, Mauro Oleivera, and I suspect Rose Taylor. Their statements are informative to read to ascertain their personal take on what they are doing. Based on what they said last year, they were totally wrong and had no clue about what was the normal levels of aluminum in soil, air, or water.
After the comments made on that blog, they have no excuse. They KNOW that what was put out in WITWATS was WRONG, they KNEW this almost a year ago, yet haven't retracted any of it, or corrected what Michael Murphy continues to assert.
It was bad enough just being ignorant and thereby disseminating bunk to others in their community, to Murphy and G. Edward Griffin, and to the world at large via WITWATS.
KNOWINGLY continuing to let their errors continue uncorrected is a sign of real problems being able to accept responsibility and being able to live in the real world where your words have consequences.
The Shasta bunch will eventually be held accountable by the other folks that simply accepted what they were told, and they will not be happy about it.
Jay Reynolds
Senior Member.
for future reference:
"Mines and Mineral Resources of Shasta County, Siskiyou County, Trinity County"(1915)
http://www.archive.org/stream/minesandmineral01buregoog/minesandmineral01buregoog_djvu.txt
SHASTA COUNTY BOARD OF SUPERVISORS
Tuesday, June 10, 2008
REGULAR MEETING
PUBLIC COMMENT PERIOD - OPEN TIME
Dane Wigington stated his research shows a high level of metal in the air, water, and
dust. He requested this issue be agendized so that independent testing can be ordered.
Supervisor Cibula directed staff to present any determination or response to this issue in a
public forum.
http://www.co.shasta.ca.us/BOS/2008_Minutes/mn06-10-2008.sflb.ashx
Jay Reynolds
Senior Member.
One of the Shasta Group's claims are that soil pH in the northern California area has been on the increase, and that some trees are dying.
Dr. Lee Klinger is at the same time controversial and main-stream. There is a phenomenon called Sudden Oak Death which though seen worldwide even in other species, is prominent in California. He contends that the symptoms are a consequence of soil acidification, calcium deficiency, and aluminum release due to pH decrease.
He sees these symptoms as resulting from a decrease in fire frequency and subsequent proliferation of moss growth on trunks and soil contributing to acidification aluminum release. He also contends that historically, native americans cultivated on a wider scale than presently believed, using fire producing ashes to ameliorate acidification, reduce moss growth, and thin understories. He contends that these native americans also extensively planted and maintained trees, especially oak, redwood and sequoia, using calcium rich shells, bone, and lime mortars to ameliorate acidification around individual trees for food production and sacred purposes.
For part of his research, the researchers onducted extensive soil and rainfall pH testing with results quite different from that of the Shasta Group:http://bioscape.com/SOD_acidity_paper_v1_2911D8.pdf
He is also tracking rainfall pH in California:
http://suddenoaklifeorg.wordpress.com/2011/06/14/acid-rain-in-big-sur-–-2010-2011-season-summary/
and
http://suddenoaklifeorg.wordpress.com/2011/06/06/acid-rain-in-big-sur-may-2011/
Here is his website:
http://suddenoaklifeorg.wordpress.com/about/
U
Unregistered
Guest
"The sample was taken July 9th, 2008."
2008 had the worst air quality I can remember. I have lived in Mt Shasta for 32 years. Starting about June 20, many thousands of acres were burning. Particulate mater is one of the main components of smoke.
2008 had the worst air quality I can remember. I have lived in Mt Shasta for 32 years. Starting about June 20, many thousands of acres were burning. Particulate mater is one of the main components of smoke.
Steve Funk
Senior Member
pubs.usgs.gov/pp/1270/pdf/PP1270_508.pdf
This is the best reference I have seen on the elements found in soils. It is based on samples taken at 20cm (8 in) depth, not just analysis of parent materials. Table for aluminum is on p 11 of the pdf, p 6 of the report. map is on p. 18 of the pdf.
Arithmetic mean aluminum concentration in the western US is 7.4%. There were about 13 samples taken in northeastern California. 12 of them were above average, closer to 10% aluminum concentration.
Google Element Concentration in Soils, USGS, 1270, if the link doesn't work
Jay Reynolds
Senior Member.
here is a link to download the .pdf file (3 MB):
http://pubs.usgs.gov/pp/1270/pdf/PP1270_508.pdf
http://pubs.usgs.gov/pp/1270/pdf/PP1270_508.pdf
Jay Reynolds
Senior Member.
This 1986 US Geological Service report contains tables showing dissolved trace elements from wells, springs, and streams in the Mt. Shasta area on pages 38-69.
Many springs are listed as having water with aluminum, barium, and strontium generally at levels from 10-100 ug/L.
Note: These are dissolved metals, not suspended sediments.
WATER-RESOURCES DATA FOR THE MOUNT SHASTA AREA,
NORTHERN CALIFORNIA
By K. R. Poeschel, T. G. Rowe, and J. C. Blodgett
U.S. GEOLOGICAL SURVEY
Open-File Report 86-65
http://www.google.com/url?sa=t&rct=...5_nMCw&usg=AFQjCNEi7fh6jCkWBq2LPYhJjrFiwuNQ3g
Steve Funk
Senior Member
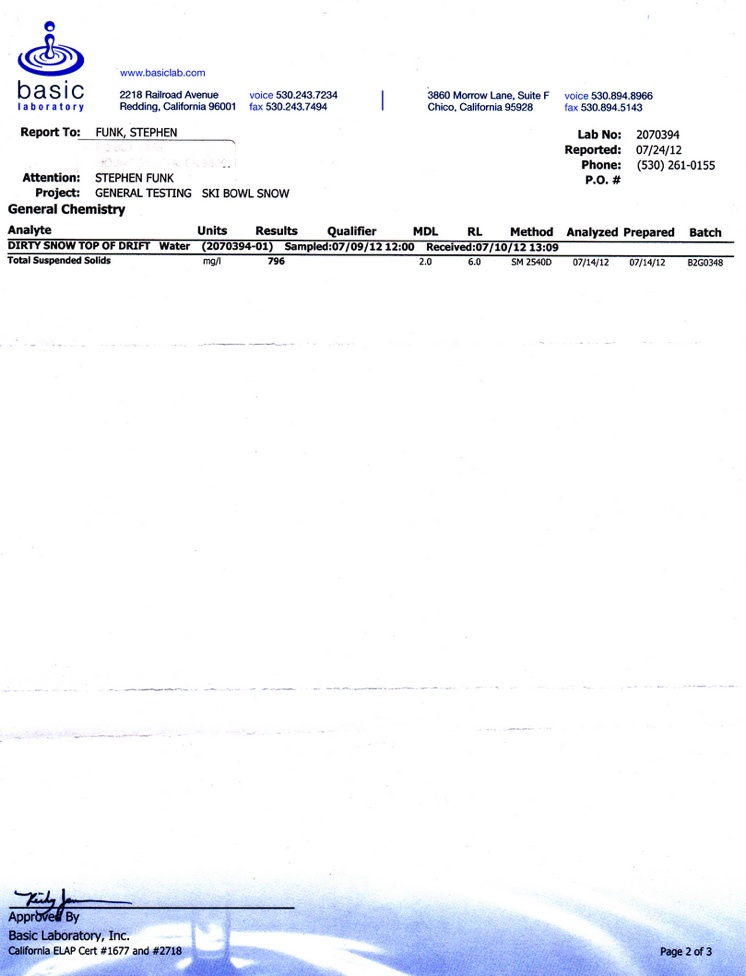
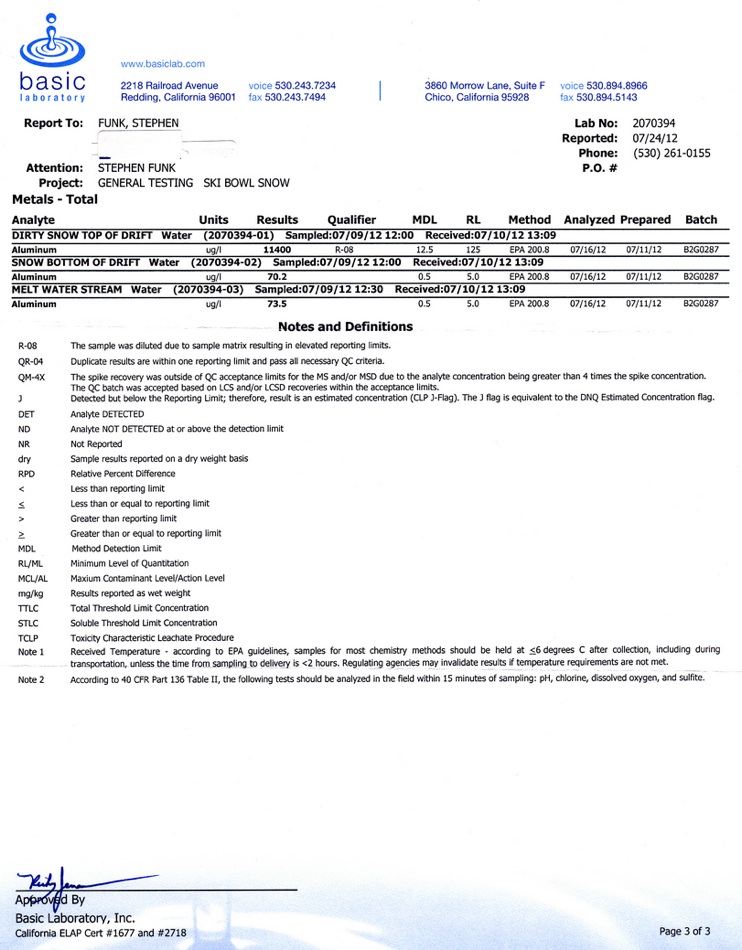
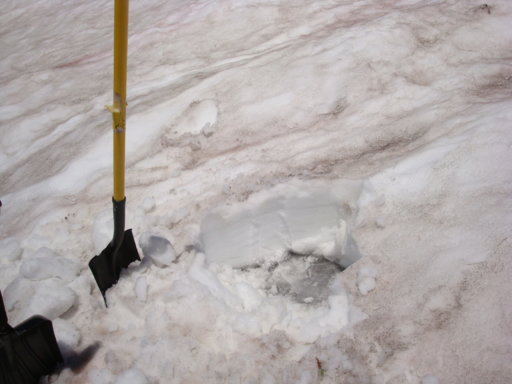
I took the samples on July 9, four years after the sample taken by Rose Taylor showing 61,000 micrograms/liter. The dirty snow at the top of the 16 inch deep drift had 11,400 micrograms/liter of Al. Cleaner snow towards the bottom of the drift had 70.2 micrograms/liter. Meltwater from a stream on the north side of the old ski bowl had 73.5 micrograms/liter. The dirty snow was also tested for total suspended sediment, which measured 796,000 micrograms/liter. The aluminum was 1.4% of the total suspended sediment, a relatively low figure, since soil averages 7% aluminum. This is a very strong indicator that the aluminum comes from dust in the air. I would suggest two possible reasons for the lower reading on these samples. One is that we didn't have nearly as much ash from forest fires this year. A second reason is that the snow drift I sampled this year might have been a little deeper. About 40-50% of the snow is lost to evaporation instead of melting. The metals don't evaporate, so the closer the drift is to disappearing, the more concentrated the metals become. I would be fairly certain that the earlier sample was taken from the dirtiest snow at the top of the drift. The location of these samples was in the old Ski Bowl, reasonably close to where Rose Taylor sampled in 2008. I couldn't find my altimeter that morning, but the parking lot is 7.700 and I was at least a half mile from the parking lot. I have some video, but it will be a while before I can upload it.
Last edited by a moderator:
Des O
New Member
Good job Steve. This is what proper sampling looks like. You actually described the media you were sampling, which helps interpret your results. The big thing is the total suspended solids reading. Very high. That should be a standard analysis conducted for all of these chemtrail rain/snow samples. The higher the suspended solids, the more metals you will find in your results.
Jay Reynolds
Senior Member.
Steve,
Yes, a very good test which shows a lot more than the WITWATS propaganda movie did.
Have any of the Shasta Group been made aware of these results?
Yes, a very good test which shows a lot more than the WITWATS propaganda movie did.
Have any of the Shasta Group been made aware of these results?
U
Unregistered
Guest
Francis response was basically that there is other evidence, it does not matter if the snow test is debunked.
Steve Funk
Senior Member
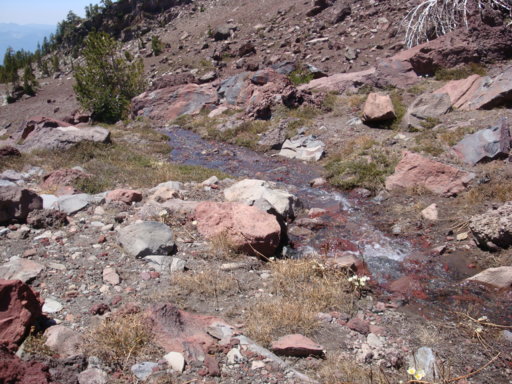
Here are two photos that go with these tests. Above is the snowdrift, showing the deposition of dust on top, and relatively clean layer below. Below is the meltwater stream. I think the striation you see about 4 inches down was just an area where it had started to melt prior to the last big storm. On photos from other areas I have seen layers of dust embedded in the snow, but not here.
Attachments
Jay Reynolds
Senior Member.
Below are the rain water sample lab test results found at the Coalitionagainstgeoengineering.org website:
Sample Dat Location Aluminum Level (µg/L)
12/27/2007 Italy 13
3/1/2007 "East Lake Shasta, CA (snow)" 7.2
4/14/2007 "East Lake Shasta, CA" 88
4/21/2007 "East Lake Shasta, CA" 27.2
5/4/2007 "East Lake Shasta, CA" 33.2
1/31/2008 "East Lake Shasta, CA (snow)" 368
2/23/2008 "East Lake Shasta, CA" 262
3/18/2008 "East Lake Shasta, CA" 2190
4/21/2008 "East Lake Shasta, CA" 650
5/22/2008 "East Lake Shasta, CA" 188
5/29/2008 "East Lake Shasta, CA" 881
10/4/2008 "East Lake Shasta, CA" 84
11/1/2008 "East Lake Shasta, CA" 815
11/11/2008 "East Lake Shasta, CA (lightning storm)"3450
3/21/2009 "Mt. Shasta, CA" 1540
3/22/2009 "Mt. Shasta, CA" 41
3/28/2009 "Mt. Shasta, CA" 853
10/14/2009 "Mt. Shasta, CA" 611
7/10/2010 "Maui, HI" 400
7/26/2010 "Maui, HI" 219
1/14/2011 "Long Island, NY (snow)" 15
1/14/2011 "Long Island, NY (snow)" 82
1/14/2011 "Long Island, NY (snow)" 13
1/14/2011 "Long Island, NY (snow)" 20
2/21/2011 "Big Bear, CA (snow)" 38.8
5/17/2011 "Orinda, CA" 118
5/17/2011 "Orinda, CA" 66.9
-----------------------------------------------------------
Average 484.2333333
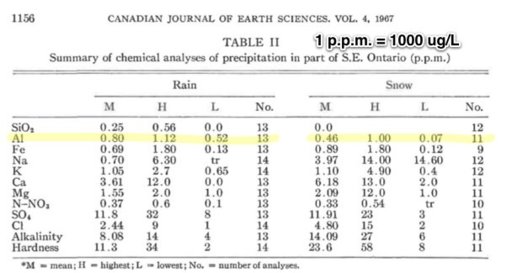
Compare to this 1967 study:
Compare to this 1973 study:
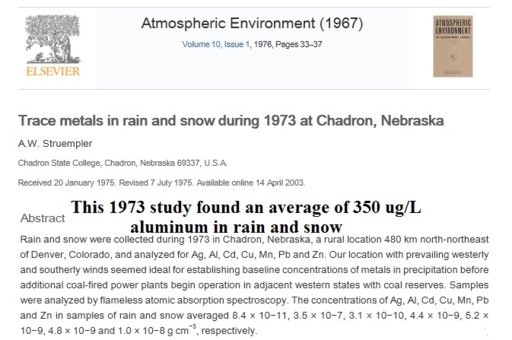
Sample Dat Location Aluminum Level (µg/L)
12/27/2007 Italy 13
3/1/2007 "East Lake Shasta, CA (snow)" 7.2
4/14/2007 "East Lake Shasta, CA" 88
4/21/2007 "East Lake Shasta, CA" 27.2
5/4/2007 "East Lake Shasta, CA" 33.2
1/31/2008 "East Lake Shasta, CA (snow)" 368
2/23/2008 "East Lake Shasta, CA" 262
3/18/2008 "East Lake Shasta, CA" 2190
4/21/2008 "East Lake Shasta, CA" 650
5/22/2008 "East Lake Shasta, CA" 188
5/29/2008 "East Lake Shasta, CA" 881
10/4/2008 "East Lake Shasta, CA" 84
11/1/2008 "East Lake Shasta, CA" 815
11/11/2008 "East Lake Shasta, CA (lightning storm)"3450
3/21/2009 "Mt. Shasta, CA" 1540
3/22/2009 "Mt. Shasta, CA" 41
3/28/2009 "Mt. Shasta, CA" 853
10/14/2009 "Mt. Shasta, CA" 611
7/10/2010 "Maui, HI" 400
7/26/2010 "Maui, HI" 219
1/14/2011 "Long Island, NY (snow)" 15
1/14/2011 "Long Island, NY (snow)" 82
1/14/2011 "Long Island, NY (snow)" 13
1/14/2011 "Long Island, NY (snow)" 20
2/21/2011 "Big Bear, CA (snow)" 38.8
5/17/2011 "Orinda, CA" 118
5/17/2011 "Orinda, CA" 66.9
-----------------------------------------------------------
Average 484.2333333
Compare to this 1967 study:

Compare to this 1973 study:

Steve Funk
Senior Member
http://www.youtube.com/watch?v=0hyjh3oIDW0&feature=colike
I have uploaded some video of the Mt. Shasta snow tests I did. It is edited a little better than the first version.
I have uploaded some video of the Mt. Shasta snow tests I did. It is edited a little better than the first version.
Jay Reynolds
Senior Member.
Steve, very good and a very fair job on your testing and your second video.
This is the way I view your findings.
1. You have been friends with Francis for years, you obviously live and care about the area.
2. You worked within the scientific method to replicate as closely as possible a previous data collection.
3. You documented the collection procedure carefully compared to the previous one, leaving no questions about your procedure.
4. You added further insight into the true nature of the aluminum by separately sampling and analyzing surface, subsurface, and snowmelt.
5. You found that only the top layer of obviously soil contaminated snow contained large amounts of aluminum, subsurfaceand meltwater had negligible amounts of aluminum.
6. You analyzed the suspended sediment from the top layer of snow which turned out to have not a "Welsbach geoegineering signature" as claimed, but the same percentage of aluminum as the ordinary local soil analyzed by Francis Mangels.
The claims have been that a "mountain of metal" has been raining down from airplanes upon Mt. Shasta.
If that were true, equal amounts of aluminum would have been found throughout the snow, yet snow which fell when the mountain itself was covered with a soft blanket of snow had almost no aluminum.
Based on these facts, the reality seems to be that the mountain itself and the surrounding soils are likely the source of what has been raining down, not airplanes.
Considering those facts which you have documented quite well, Francis Mangels has no basis to claim that any metal comes from airplanes when the mountain snow a few miles away collected virtually no aluminum through the winter, except for soil which blew in during the summer when most of the snow had melted and dust was free to blow.
Again, many thanks for solving this mystery.
Jay Reynolds
Senior Member.
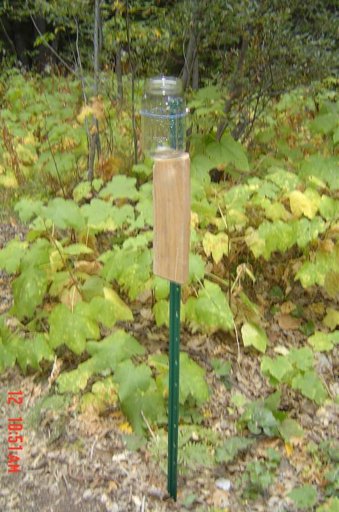
Last month, a rain water sample was taken in the town of Mt. Shasta by Steve Funk.
Here is a photo of the sample collector:
Here is the sample report from the same lab used by the chemtrail people:
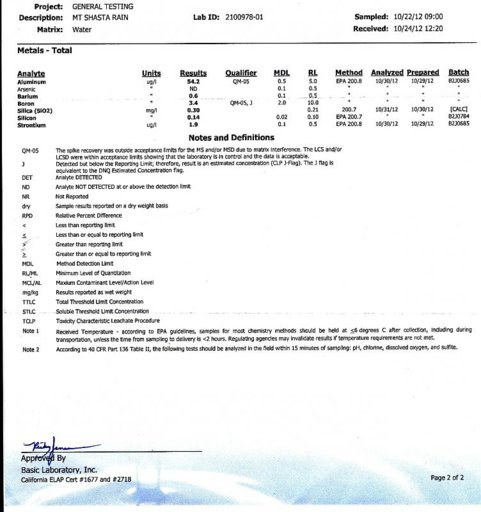
The lab test results are given in two different forms for different substances, below are the units standardized to units ug/L (micrograms per liter),
the same units used by the chemtrails people:
Units standardized:
SiO2-300.0 ug/L
Si----140.0 ug/L
Al-----54.2 ug/L
Sr------1.9 ugL
Ba------0.6 ug/L
Here is a photo of the sample collector:

Here is the sample report from the same lab used by the chemtrail people:

The lab test results are given in two different forms for different substances, below are the units standardized to units ug/L (micrograms per liter),
the same units used by the chemtrails people:
Units standardized:
SiO2-300.0 ug/L
Si----140.0 ug/L
Al-----54.2 ug/L
Sr------1.9 ugL
Ba------0.6 ug/L
Jay Reynolds
Senior Member.
So, aluminum, barium, and strontium were all found in similar proportions to their abundance in nature around the Mt. Shasta area, and in nature generally.
Referencing the known chemical composition of parent rock found in the Mt. Shasta, we see that the compound that makes up the largest percentage of native rock in the area is silica, SiO2 which is a mineral formed by the combination of silicon and oxygen. Silica is also known as common sand.
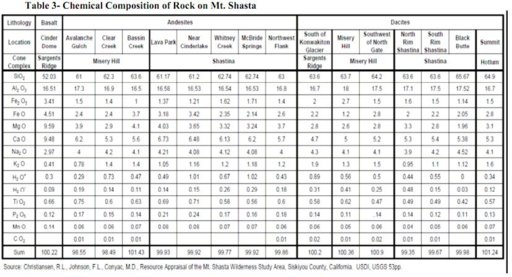
The analysis shows that the rainwater collected contains 300 ug/L of silica. This is a strong indicator that the rain contained material of crustal origin, in other words, soil dust that derived from the parent rocks of Mt. Shasta. This is not surprising. It would actually be uncommon to not find silicon and silicon dioxide in dust.
The reason for this is because just behind oxygen, silicon is the second-most abundant element in the crust, followed closely by aluminum.
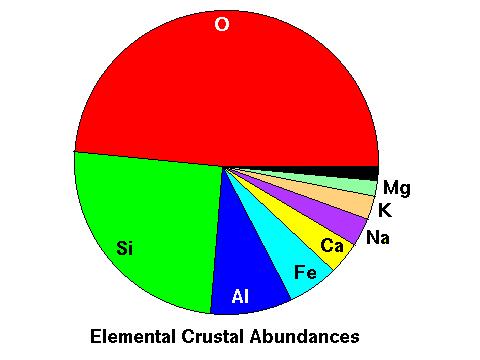
Taking a closer look at the various minerals found in earth's crust, we find that practically all minerals in the crust are compounds of silicon, and most of these silicate minerals also contain significant amounts of aluminum. In the pie chart below, all of the minerals are silicates except the turquoise slice shown as non-silicates.
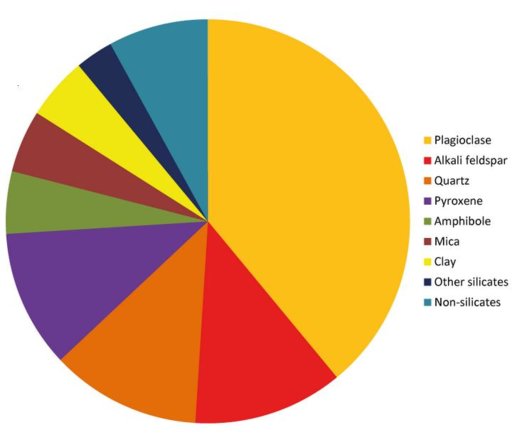
Plagioclase- a calcium or sodium aluminum silicate mineral
Alkali Feldspar- a potassium aluminum silicate mineral
Quartz- silicon-oxygen mineral
Pyroxene- aluminum silicon oxygen mineral
Amphibole- iron or magnesium silicon oxygen mineral
The Shasta Group led by Francis Mangels and Dane Wigington have stated over and over that finding aluminum in rainwater is not likely, and that if found it indicates a "Welsbach signature" of geoengineering. They negelected to study what would be normally expected in rainwater, however, which is soil dust from earth's crust.
They never tested for the most common solid element on earth, silicon. Had they done so, they certainly could have saved themselves and the public much trouble, because what this rain test is showing us is that indeed the source of the aluminum found in rain water samples is not consistent with a "Welsbach" signature, but rather with the signature of the earth itself!
Referencing the known chemical composition of parent rock found in the Mt. Shasta, we see that the compound that makes up the largest percentage of native rock in the area is silica, SiO2 which is a mineral formed by the combination of silicon and oxygen. Silica is also known as common sand.

The analysis shows that the rainwater collected contains 300 ug/L of silica. This is a strong indicator that the rain contained material of crustal origin, in other words, soil dust that derived from the parent rocks of Mt. Shasta. This is not surprising. It would actually be uncommon to not find silicon and silicon dioxide in dust.
The reason for this is because just behind oxygen, silicon is the second-most abundant element in the crust, followed closely by aluminum.

Taking a closer look at the various minerals found in earth's crust, we find that practically all minerals in the crust are compounds of silicon, and most of these silicate minerals also contain significant amounts of aluminum. In the pie chart below, all of the minerals are silicates except the turquoise slice shown as non-silicates.

Plagioclase- a calcium or sodium aluminum silicate mineral
Alkali Feldspar- a potassium aluminum silicate mineral
Quartz- silicon-oxygen mineral
Pyroxene- aluminum silicon oxygen mineral
Amphibole- iron or magnesium silicon oxygen mineral
The Shasta Group led by Francis Mangels and Dane Wigington have stated over and over that finding aluminum in rainwater is not likely, and that if found it indicates a "Welsbach signature" of geoengineering. They negelected to study what would be normally expected in rainwater, however, which is soil dust from earth's crust.
They never tested for the most common solid element on earth, silicon. Had they done so, they certainly could have saved themselves and the public much trouble, because what this rain test is showing us is that indeed the source of the aluminum found in rain water samples is not consistent with a "Welsbach" signature, but rather with the signature of the earth itself!
It looks like Shasta is forecast some record snow over the next few days:
http://www.weather.com/news/weather-winter/mount-shasta-snow-extreme-20121129
[FONT=arial, helvetica, clean, sans-serif]I'm going to go out on a limb and predict that the Shasta crowd will take this as clear evidence of weather manipulation.
Here in Los Angeles it has been raining for a few days, and fairly solidly the last 8 hours. There were a couple of nice contrail days before the weather arrived. Lots of Cirrus Uncinus, contrails and ripple clouds. I imagine there were similar portents up in Shasta. Again that's going to be used as evidence - the old "why do they always spray before it rains" argument. [/FONT]
http://www.weather.com/news/weather-winter/mount-shasta-snow-extreme-20121129
[/FONT]External Quote:If anyone lived on the summit of California's Mount Shasta, they'd need a mighty big shovel to dig out of the snowstorm that will bury the mountain in astronomical amounts of snow through the weekend -- amounts that could flirt with world records.The Thursday morning National Weather Service summit forecast for Shasta predicted an incredible 33 to 39 inches of snow -- just for Thursday alone.
(By comparison, Atlanta, Ga., has reported 38.9 inches of snow since March 1, 1989 -- a period of over 23 years.)
But it gets crazier.
Add in another 37 to 43 inches of snow Thursday night, and additional amounts ranging from 21 to 35 inches every 12 hours through Saturday night, plus a light dusting of 11 to 17 inches on Sunday...
...and you get a storm total of 176 inches. On the low end.
[FONT=arial, helvetica, clean, sans-serif]Add up the high end of the numbers and you get a forecast maximum of [/FONT]218 inches of snow in four days!
[FONT=arial, helvetica, clean, sans-serif]...
[/FONT]For the surrounding terrain, which is nearly 10,000 feet lower than the summit, this will be a massive rain storm with the potential for over a foot of rain.[FONT=arial, helvetica, clean, sans-serif]
[FONT=arial, helvetica, clean, sans-serif]I'm going to go out on a limb and predict that the Shasta crowd will take this as clear evidence of weather manipulation.
Here in Los Angeles it has been raining for a few days, and fairly solidly the last 8 hours. There were a couple of nice contrail days before the weather arrived. Lots of Cirrus Uncinus, contrails and ripple clouds. I imagine there were similar portents up in Shasta. Again that's going to be used as evidence - the old "why do they always spray before it rains" argument. [/FONT]
Steve Funk
Senior Member
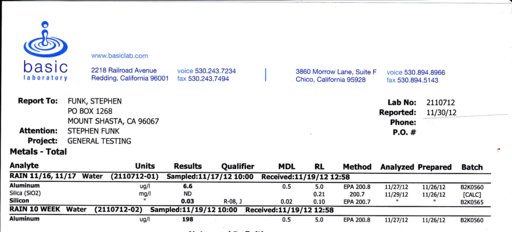
The first sample was from a bucket washed and dried the night before the storm on Nov. 16/17, about 8 hours of rain with 2-3 inches in the bucket. The second sample was from a jar which had been left out since August 28. First sample had 6.6 micrograms/liter aluminum, and 30 micrograms/liter silicon. The second sample, tested just for al, had 198 micrograms/liter. This indicates that dust in the air during dry periods can significantly affect the reading. Francis mentioned to me once that he didn't think dust accumulating in his rain guage during dry periods would significantly affect the lab results. One caveat is that the first sample had more than I could get in the bottle. It is possible it wasn't mixed perfectly. But the silicon/aluminum ratio was again indicative of a crustal origin. And the heavier particles that could have stuck to the bottom of the bucket would have been silicon dioxide (sand).
Jay Reynolds
Senior Member.
Steve your method here comparing two samples tested for a variable called dry deposition.This indicates that dust in the air during dry periods can significantly affect the reading. Francis mentioned to me once that he didn't think dust accumulating in his rain guage during dry periods would significantly affect the lab results.
The jar which was set out immediately before the rain was only exposed to wet deposition, while the sample taken after the container had remained exposed to the air during the 10 week dry period was exposed to both wet deposition and dry deposition
Testing for variables is a basic scientific technique used to discover why a particular experimental run differs from another. In science, one does not just "think" something makes no difference in an experiment. "Thinking" is simply a guess, also known as a hypothesis. The scientist who designs an experiment devises ways to test for any variables which he "thinks" might affect the outcome of the experiment.
Besides allowing a very important variable like dry deposition to skew the results of his experiments, Francis Mangels seems to have very little idea of how atmospheric deposition works, surprising if you consider he holds himself out as such a brainiac.
Scientists who study the atmosphere learn in their first year of study the difference between wet and dry deposition, that is basic stuff.
The apparatus below is commonly used worldwide to collect BOTH wet and dry deposition at the same time. You can see that the bucket on the right collects rain, but remains covered until actual rainfall is detected. The bucket on left is the dust collector and remains open collecting dust until rain is detected. The cover slides over from right to left when rain is detected to open up the rain collector and keep water out of the dry collector.
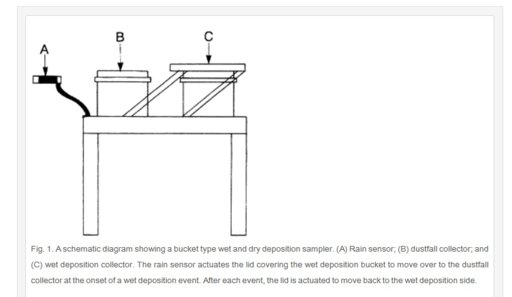
This is yet another example of the gross errors being made in "chemtrail science".
The people making the chemtrail claims need to learn the basics of science, but instead they ignore them, and mislead thousands into a false belief system.
Steve Funk
Senior Member
Wow, I almost purchased from that website in the past. Please present the tests you've probably made of those medicines, since you claim they are quack, so we can be sure it is a quack medicine they're selling, so we can report them to the BBB and FTC.
Please stick to the topic of aluminum levels in snow on Shasta being caused by dirty snow.
Steve Funk
Senior Member
Chemx, if you are referring to Basic Labs, they are just an outfit that does soil and water testing. Or did you accidentally get your post in the wrong thread?
Steve Funk
Senior Member
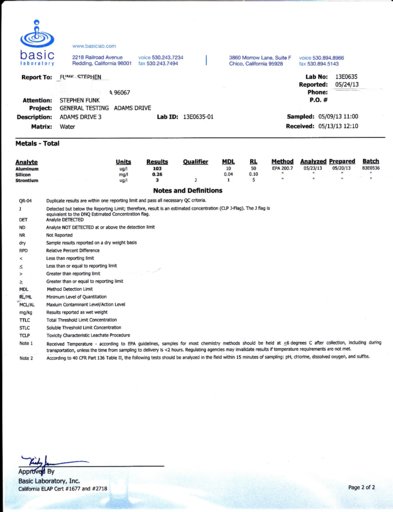
Here is another data point for the silicon/aluminum ration in rain. 260 ug/l silicon, 103 ug/l Al., for a ratio of 2.58 to 1. The average of the three samples (see #67 and #64) is 3.21/1, which is pretty close to what you would expect from published graphs of the composition of the earth's crust. This sample is from rain May 6 and May 8. I washed the collection bucket before the rain, but had to strain leaves and bugs out after three days.
Leifer
Senior Member.
Bugs and leaves will have dust and dirt (earth crust) on them, so they add to the Al content in the sample.
Even with the extra dirt, the Al is below MCL EPA guidelines/limits.
Aluminum MCL is " 0.05 to 0.2 mg/L "....and this test found 103 ug/L, which is the same as 0.103 mg/L......below limits and not unusual.
That's under the "Secondary Standards"....what are those ?
gimmie it, I'll drink it.
(this info has been said before, but just as a reminder....)
Even with the extra dirt, the Al is below MCL EPA guidelines/limits.
Aluminum MCL is " 0.05 to 0.2 mg/L "....and this test found 103 ug/L, which is the same as 0.103 mg/L......below limits and not unusual.
That's under the "Secondary Standards"....what are those ?
http://water.epa.gov/drink/contaminants/secondarystandards.cfmExternal Quote:Why Set Secondary Standards?
Since these contaminants are not health threatening at the SMCL, and public water systems only need test for them on a voluntary basis, then why it is necessary to set secondary standards?
EPA believes that if these contaminants are present in your water at levels above these standards, the contaminants may cause the water to appear cloudy or colored, or to taste or smell bad. This may cause a great number of people to stop using water from their public water system even though the water is actually safe to drink.
gimmie it, I'll drink it.
(this info has been said before, but just as a reminder....)
David Fraser
Senior Member.
There have ben a few test floating around the UK FB pages since we had some snow this spring what the chemtrailers refer to as "strange snow". Here is an example;
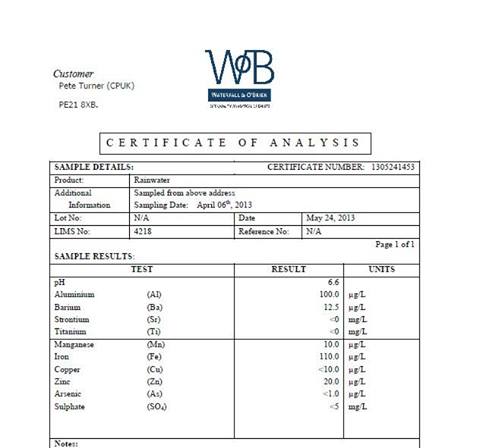
The aluminium content is about the same as Steves'. However all comments seem to be based on the "unusually" high aluminium content, with one commentator saying "how does something so heavy get into the air, yet no one bats an eyelid at the Iron content of 110 ug/l. I have mentioned that maybe they are starting to spray iron as well but all I get is derision for some reason
The strange snow saga has come about since someone heard Dane Wigington witter on about ice nucleation and since then they have been terrified of snow. This one relates to soft, powdery snow shaped like polystyrene balls. Its soft hail, hallway between graupel and hail. It is common but I guess people have never noticed it before this spring.
Jay Reynolds
Senior Member.
It would be good if the chemtrails folks started adding silicon to their testing array. Silicon, the second most abundant element in the crust (oxygen is #1), will be a good indicator of crustal material.
Steve Funk
Senior Member
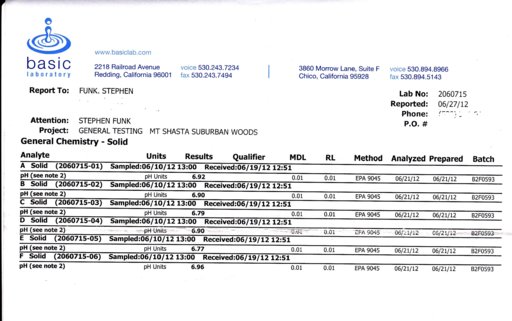
The soil ph for all samples was higher than I expected, but there was no correlation between aluminum concentration and soil ph. There was a lot of sample variation in the al content. Samples A and B, which should have been about the same, were 14% different. Sample F, which should have been the highest, with an added 10 gm of aluminum oxide, was the lowest. This would suggest that sample variation could have accounted for the difference between the soils in the yard (1.4 to 2% al) and under the house (1.3% al) that Francis Mangels got. All of my samples had a higher al concentration than Mangels has recorded. This is probably because my place is in the Ponto Neer soil complex, which is a little finer textured than the Deetz series. The soil samples were about 650 grams, one liter, with a bulk density app. 0.65. ]
Attachments
David Fraser
Senior Member.
Excellent work Steve. What was the Ph the Aluminium Oxide? I wonder if the result would be the same if a different Ph was used? I wonder if there is a way to remove aluminium from the soil cheaply? That would be a perfect control. You have definitely sparked an interest.
Just to address your point about sample variation as this is an issue missed by Mangels. It is well known not to rely purely on a single sample result when making an analysis, whether it statistical or observational. While I appreciate that yourself. and even chemtrailers, are working within your personal means for a paper one would expect at least 3 tests to be done so as to define a mean as well as the standard deviation. In principle the more the merrier so to speak as that allows statistical outliers to be removed and for accuracy. In the UK, for water quality it is 3 per sample but when I briefly worked on rainwater recycling we used 10, mainly as there were severe financial implications if we fucked up. I have considered trying to challenge some of the results in the UK but yet have to find some close enough to me so I can pop over and set up a sampling rig. I have been trying to persuade some academic and student friends to do a study for their various courses and one is interested for his Masters (the Al content of PM10 air pollution or something like that).
However I digress. As you are the only person in the vicinity of Mangels to actively challenge or validate his finding if you do any further work I would be more than happy to donate a few quid to the cost.
Jay Reynolds
Senior Member.
An alternate explanation is that the sprayplanes six miles up targeted your backyard for a greater dose of welsbach materials than Mangels backyard in the same town.All of my samples had a higher al concentration than Mangels has recorded. This is probably because my place is in the Ponto Neer soil complex, which is a little finer textured than the Deetz series.
David Fraser
Senior Member.
I was having a nosey around the air quality sites for the US, especially in relation to PM10 air pollution as Redding samples for that. I came across a page showing trends in PM10 here http://www.epa.gov/airtrends/pm.html#pmloc
There seems to be an irratic yet steady decline in PM10 pollution from the Redding station over the past 20 years or so,

As mentioned earlier in the thread the peak in 2008 is explained by forest fires and is well documented such as here http://www.arb.ca.gov/desig/excevents/2008 wildfire ned 72009.pdf
Now while I appreciate that the aluminium content of the PM10 may not be taken one would expect the trend to stay constant or rise if spraying was happening. I wonder how Francis Mangels can explain the result given the opposite is occuring.
There seems to be an irratic yet steady decline in PM10 pollution from the Redding station over the past 20 years or so,
As mentioned earlier in the thread the peak in 2008 is explained by forest fires and is well documented such as here http://www.arb.ca.gov/desig/excevents/2008 wildfire ned 72009.pdf
Now while I appreciate that the aluminium content of the PM10 may not be taken one would expect the trend to stay constant or rise if spraying was happening. I wonder how Francis Mangels can explain the result given the opposite is occuring.
Similar threads
- Replies
- 124
- Views
- 9K
- Replies
- 28
- Views
- 1K
- Replies
- 14
- Views
- 2K
- Replies
- 67
- Views
- 22K
Latest posts
-
Synchronicity - What's your experience of it?
- Latest: Todd Feinman
-
-
-

