Debunked: AE911Truth's Analysis of Slag Residue from WTC Debris

Mick West

Administrator
Staff member
X-EDS Slag Metabunk.jpg

The following slide has been part of Richard Gage's 9/11 Truth presentation for several years, at least since 2008 when it showed up in a version of 9/11: Blueprint for Truth video (which is basically Gage giving the extended version of his slideshow).
Metabunk 2018-01-27 08-05-02.jpg

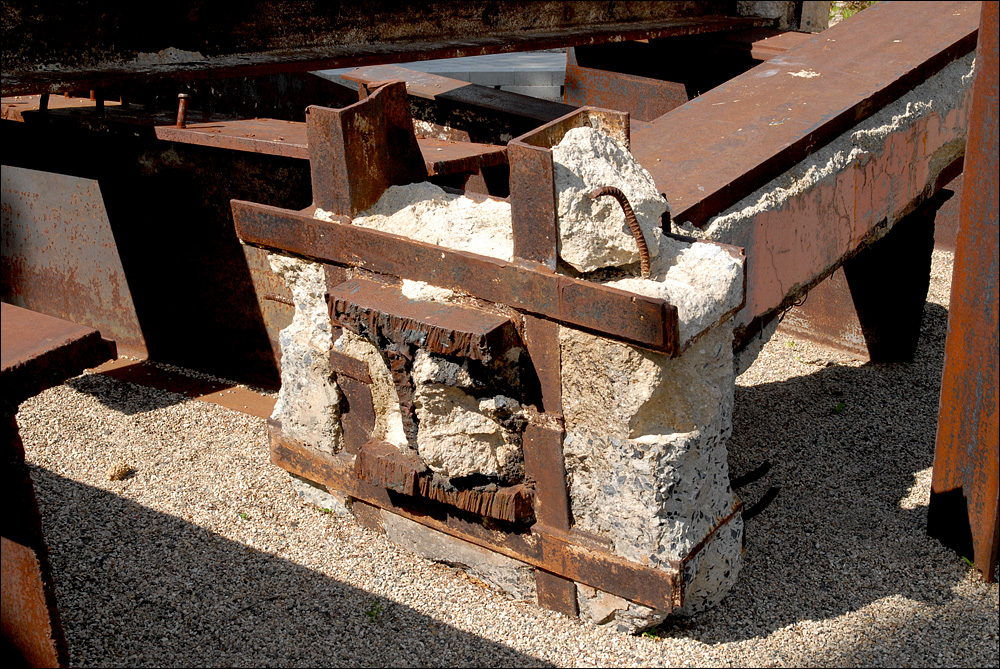
It's supposedly the spectrum of a sample of slag taken from a cut steel beam that's currently in the International Peace Garden on the US/Canadian border. Metabunk 2018-01-27 08-33-37.jpg

Metabunk 2018-01-27 08-34-33.jpg

He says this is the chemical signature of thermite. He also claims that the irregular and messy nature of the cut on the beam shows it was not Oxy-acetylene, contrasting it with a "clean" cut on a different beam.
Metabunk 2018-01-27 08-37-11.jpg
Metabunk 2018-01-27 08-37-44.jpg

Here's a closer look.
fark_PBxPYy8g8b8Uek9GeyibZ6Il22s.jpg

Gage said, in a recent podcast,
So there's other beams that have slag on the end in these sculptures that are round the world, this one in Manitoba, Canada. [Stephen Jones] does X-Ray florescence [and] finds iron, sulfur, potassium, manganese. These ingredients, well guess what those are, those are the ingredients of thermite. Particularly with the manganese, the aluminum and iron content here in addition to other stuff.
Content from External Source
In order to better understand what the X-EDS spectrum actually meant, I did a bit of reading.
https://en.wikipedia.org/wiki/Energy-dispersive_X-ray_spectroscopy
EDS can be used to determine which chemical elements are present in a sample, and can be used to estimate their relative abundance. The accuracy of this quantitative analysis of sample composition is affected by various factors. Many elements will have overlapping X-ray emission peaks (e.g., Ti Kβ and V Kα, Mn Kβ and Fe Kα). .
Content from External Source
While looking as some X-EDS results on Google Images, I happened to notice one that looked familiar:
https://www.mccrone.com/mm/semeds-analysis-problem-solving-food-industry/
Metabunk 2018-01-27 08-53-54.jpg
The iron to manganese ratio is consistent with carbon steel. ... The orange/brown coloration of the aggregates suggests that they are carbon steel rust particulates.
Content from External Source
Fe is iron, Mn is Manganese, Si is Silicon, Al is Aluminum. Notice Gage said the important parts of the signature were Mn, Al, and Fe. Let's compare those peaks with this sample of carbon steel rust. I've scaled it vertically to match the background levels.
Metabunk 2018-01-27 09-01-59.jpg

It's a perfect match for those elements! The only different is that the large peak on the right is labeled "Fe" on the rust particle, but Fe Mn on the slag. Yet the peak itself is nearly identical. Then I remembered what it said in Wikipedia:
Many elements will have overlapping X-ray emission peaks (e.g., Ti Kβ and V Kα, Mn Kβ and Fe Kα).
Content from External Source
Manganese and Iron have overlapping peaks! Specifically the K-beta line for manganese overlaps the K-alpha line for iron. Most elements have two measurable lines on the spectrum, alpha and beta. The alpha line is the stronger line. This large combined peak is the K-alpha of iron (6.402) and the K-beta of Manganese (6.490) . This means that the amount that Mn contributes to that Fe/Mn peak is less than the tiny K-alpha Mn (5.897) peak to the left of it.

How much less? Look at an X-EDS spectrum of manganese without iron:
Metabunk 2018-01-27 09-30-33.jpg

Mn K-beta about 1/8th the size of Mn K-alpha. Meaning there's basically no Mn in that second peak in the slag chart.

Which means the "signature" of Mn, Al, and Fe from the slag sample matches the carbon steel rust sample exactly.

Which means it's not thermite residue.

It's slag for the column being cut after the collapse, possibly with a thermal lance which explains the irregular cut (which isn't even that irregular without the forced perspective in that photo.

But what about the other elements mentioned on the slide?

Metabunk 2018-01-27 09-59-31.jpg

S is sulfur, K is potassium Ca is calcium. Let's look at those, keep in mind the alpha and beta peaks.
Metabunk 2018-01-27 10-01-11.jpg

The sulfur peak is barely there, it's actually less in the slag sample than in the rust sample. The Potassium (k) K-alpha peak is similar, and the even smaller K-beta peak is obscured by the Calcium K-alpha peak. They totally misrepresented this analysis.

Of course this proves nothing about the collapses of the towers other than that particular column was not cut with thermite. It does however prove that Architects and Engineers for 9/11 Truth don't really understand X-EDS spectra analysis. They have used this faulty interpretation to make a false claim over and over for ten years.

If they can get something as simple as this wrong, then we should probably assume they've got quite a few other things wrong too.
 
Last edited:
He says this is the chemical signature of thermite. He also says that the irregular and messy nature of the cut on the beam show sit was not Oxy-acetylene, contrasting it with a "clean" cut on a different beam.


Regarding this aspect, there's several cuts of varying neatness in the Peace Garden
http://www.manitobaphotos.com/peace

Here's the end of the beam in context. It looks much less dramatic from this angle. You can also clearly see cutting marks, exactly like in the "clean cut" example Gage used. I've highlighted a matching area of the background to prove it's the same beam.
Metabunk 2018-01-27 11-05-01.jpg

Here's another cut beam with an even more jagged edge.
Metabunk 2018-01-27 10-56-31.jpg

This one is particularly interesting in the context of the slag


Metabunk 2018-01-27 10-58-46.jpg

Not only does it show a similarly mess cut, it also has the same slag. But most importantly it's encased in concrete. This proves the cuts must have been made post collapse.
 
Last edited:
Slag is a mixture of iron oxide and molten iron. It's a normal byproduct of oxy cutting steel. Oxy cutting works by first heating the metal with oxy-acetylene until the surface is molten and then apply a high pressure stream of oxygen which rapidly oxidizes (burns) the molten iron, forming iron oxide and more heat. Thin metal can be cut very smoothly with practice. Here's a great overview:


Source: https://www.youtube.com/watch?v=7EGmrPiumEU


He shows how cutting too slow can create excessive slag even on a relatively thin cut.
Metabunk 2018-01-27 11-36-00.jpg


Slag is likely when cutting items that are very thick or irregular.
Metabunk 2018-01-27 11-37-04.jpg
 
Excellent analysis, Mick!

I am a bit surprised you did not mention the large Si-peak in the first AE911T spectrum you showed - which they don't mention, either! This sample contains only trace amounts of Mn and Al, but significant Si!

Especially the Al-content is absolutely miniscule - off my cuff I'd say <0.5%. You cannot compare peak heights and believe that content percentages scale roughly linearly to peak heights - they don't. Several factors influence peak heights, some of the more significant are:
  1. From left to right (0 to max keV), peak heights decrease for same mass percentage.
  2. By how much they decrease from left to right depends on the original energy of the electrons shot at the sample.
  3. For the heavier elements that have more than one distinct peak, the K-alpha is the biggest, then K-beta, then the L-levels (and M-levels for even heavier elements such as Pb). You cannot compare the L-alpha of one element with the K-beta of another, for example
  4. Also, as the number of energy levels increases from light to heavier elements, the total count of returned x-rays gets spread between the several peaks, such that the largest peak gets diminished relative to a lighter element that has fewer response levels.
My standard reference to see which elements have which levels at which keV values is this: http://csrri.iit.edu/periodic-table.html

One hands-on way to estimate contents given an XEDS plot is to simulate it using software and playing around with various percentages of the elements of interest. There is a (Java-based) software called DTSA-II that you can download for free (from NIST, of all places :D) here: http://www.cstl.nist.gov/div837/837.02/epq/dtsa2/

Let me try a first rough shot. Ogling the first (AE) spectrum in your first post:


My off-the-cuff guess (informed by having played with XEDS plots quite a bit in the past) is that it is mostly Fe2O3, with only small bits of the other elements. How about this:

C: 0.2%
Al: 0.2%
Si: 2.5%
S: 0.05%
K: 0.05%
Ca: 0.5%
Mn: 0.3%

(All mass fractions)
That's a total of 3.8% of the trace elements, leaving 96.2% for rust. One mol of Fe2O3 is 2x56 g of Fe plus 3x16 g of O for a total of 160 g, of which 112 g = 70% are Fe, and 30% are O. This gives us, for the remaining 96.2% of the "slag" material:
Fe: 67.3%
O: 28.9%

Now I turn to DTSA-II.
  • I click the "Tools" menu and choose "Simulation alien..."
  • I choose the first option: "Analytical model of a bulk, homogeneous material" (the "analytical model" computes in seconds, the "Monte Carlo" models may run more than a minute) and click "Next"
  • I "Edit" the bulk material, name it "Manitoba slag", assume a density of 5 g/cm^3 (pure ferric oxide has a little more), and then add Mass Fractions according to the percentages above.
  • "OK" and "Next"
  • "Beam Energy" shall be 20 keV. I leave all other "Instrument configuration" values at their default values.
  • "Next" "Next" "Finish"
Here is the result:
Manitoba slag Pass 01.jpg
I see I am somewhat underestimating the trace elements, and overestimating total iron.

Next pass:
Si: 5.0%
Al: 0.4%
C: 1.0%
S: 0.2%
K: 0.2%
Ca: 1.0%
Mn: 0.4%
Sum of traces: 8.2%
I'll split the remainder roughly 65% Fe, 35% O (certainly, the Al, Si, Ca all represent oxidized species):
Fe: 60.0%
O: 31.8%
Result:
Manitoba slag Pass 02.jpg

I still need a lot more carbon, more Ca, more Si. A bit more Al. But we are getting there! I am not going to go on playing to get an even closer match. It's rather pointless.

In this material, there is a hundred times more Fe than Al, there is almost no sulfur, there is only a small amount of Mn - just what you'd expect for A36 steel.
There seems to be some Calcium Silicate Carbonate along with Silica in that slag, from the nearby concrete, most likely. Both Si and Ca have nothing to do with thermite or thermate, and the little traces of Al and S strongly discourage an interpretation as such. Actual thermite slag would have a Fe:Al ratio by mass near 2:1, not 100:1. As so often, these Truthers miss reality by almost two orders of magnitude.
 
Last edited by a moderator:
I am a bit surprised you did not mention the large Si-peak in the first AE911T spectrum you showed - which they don't mention, either! This sample contains only trace amounts of Mn and Al, but significant Si!

I wanted to focus on the elements they claimed were a signature. The most important mistake was in claiming that manganese was abundant when the mistook the Fe K-alpha line for Mn. In fact it's perfectly consistent with the amount in steel.

One hands-on way to estimate contents given an XEDS plot is to simulate it using software and playing around with various percentages of the elements of interest. There is a (Java-based) software called DTSA-II that you can download for free (from NIST, of all places :D) here: http://www.cstl.nist.gov/div837/837.02/epq/dtsa2/
Lovely! Thanks. Unfortunately I can't install it on OSX High Sierra. But the graphs you provide demonstrate quite clearly their mistake with Mn. Given that the interpretation of "abundant Manganese" was made by Steven Jones, and repeated by Richard Gage for so long, it really should give people pause regarding their interpretations of other similar analytical results.

The finding that it's just oxy-fuel cutting slag creates a cascading problem for them. Gage argued that a jagged cut was evidence, and here we see it was not, he argued that visible slag was evidence, and here we see it was not. That means that, based on their own chemical analysis, they can't use any other messy slaggy cuts as evidence of controlled demolition.
 
Here's what he said. Which now he has to throw out, and admit he's be getting it wrong for ten years.

00:00 so there's other beams that have slag on
00:04 the ends and these sculptures that are
00:06 round the world this one in Manitoba
00:10 Canada. does x-ray fluorescence Steven
00:12 Jones and finds that this has iron
00:16 sulfur, potassium, manganese, these
00:19 ingredients. Well guess what those are
00:21 those are the ingredients of thermite,
00:24 particularly with the manganese and the
00:29 aluminum and iron content here in
00:32 addition to other stuff. Well they say
00:35 you know Mick West or somebody is going
00:38 to say this this is this comes from
00:41 cutting at the site. Well the
00:44 iron workers use very effective oxy
00:47 acetylene torches they give very clean
00:49 cuts like you see here but this is a
00:51 very jagged cut you know it's not made
00:54 by the Oxy oxy-acetylene torches
00:56 they're using out there this is not the
00:59 fastest way from point A to point B is
01:01 this a jigged-jagged note with the
01:04 molten slag coming off an aluminum
01:06 residue and complete chemical reaction
01:08 of thermite is what you're seeing on
01:10 these beams. And what what are you seeing
01:13 on this column which is still during
01:17 operations and rescue operations well
01:20 before the the iron workers are start
01:24 cutting the stuff down, 45 degree cuts
01:26 with thick slag coming off of these
01:28 beams well that's not the oxy-acetylene
01:31 signature. Something else is going on
01:34 here, and here as you can see all across
01:37 these columns during rescue operations
Content from External Source
 
Haha ok, it tool a bit now for it to occur to me that they thought there was a HUGE Mn spike! Especially since Mn is not all that typical for thermite to begin with. Harrit et al (2009) did not find Mn except traces in the inert gray layer. Perhaps Gage should send his material to Jeff Farrer and have him explain what's up with the manganese :D

Also, since when ist potassium (K) a signature for thermite? Since never ever that is! Perhaps he's conflating thermite with something something pyro that contains potassium permanganate as solid oxidizer. The first label "K" from the left, at 3.3 keV, is the main peak, and it's tiny. The second label at 3.6 keV is overshadowed by the Ca-peak at 3.7 keV. If there were no Ca at all, the second potassium peak would be essentially invisible to the naked I. The labels are placed by the software that comes with the SEM/EDS equipment, it does statistical analysis to detect signals, and sometimes finds signals that disappear in the noise when plotted and assessed by eye-sight only. Here, I quickly simulated what my approximate "Manitoba slag" would look like with the same 0.2% potassium, but minus the 1% calcium:

Manitoba slag without Ca.jpg
(Y-scale zoomed in)
You see the small peak at 3.3, and practically nothing at 3.6 keV.

Similarly, if I simulate that slag with vanadium (V) instead of iron, I get this:

Manitoba slag V instead of Fe.jpg

I picked V, because its main peaks are to the left of both Mn's and Fe's, but it's not a lot lighter than iron.
We still see the familiar small peak for 0.4% manganese at 5.9 keV. It's second peak at 6.5 keV, previously overshadowed by iron's K-alpha at 6.4 keV, simply is not there, to the naked eye!

Anybody with one (1) day of experience with SEM/EDS, whether practical on an actual instrument, or theoretical with software like I use, or academically through reading a textbook, a user manual, or getting a lecture, would understand that the second K-lever is always a lot smaller than the first and mostly irrelevant for analysis.
 
Haha ok, it tool a bit now for it to occur to me that they thought there was a HUGE Mn spike!
Yes, that seems to be the most fundamental error they made. The software they used puts the label above the curve, meaning the beta peaks for K and Mn were being bumped up to to the top of the alpha peaks for Ca and Fe when they should be at the bottom. They misinterpreted it as large values of K and Mn.

Anybody with one (1) day of experience with SEM/EDS, whether practical on an actual instrument, or theoretical with software like I use, or academically through reading a textbook, a user manual, or getting a lecture, would understand that the second K-lever is always a lot smaller than the first and mostly irrelevant for analysis.
I had no idea until yesterday. It's an understandable mistake to briefly make, but not for 12 years.
 
One note, which I don't think changes the chemical analysis above but which is worth noting for accuracy, is that iron workers used magnesium thermal lances to make many of the heavy cuts to columns at ground zero according to at least one iron worker, Willie Quinlan, who was on scene:

I had worked demolition jobs before and this was a demo job. On a demo job we don’t unbolt the iron or anything like that. We usually use torches to cut it apart, but at the Trade Center the iron was so heavy you couldn’t cut it with just a torch. We had to use a lance, a long magnesium rod, and compressed oxygen and a torch to light it. It burns at about 7,000 degrees and will cut through anything you put in front of it, even concrete. It’s just like a volcano with the lava running out.
Content from External Source
(from Nine Months at Ground Zero, The Story of the Brotherhood of Workers Who Took on a Job Like No Other, pg. 50.)
 
...

Slag is likely when cutting items that are very thick or irregular.

To confirm, the cuts made in this case took an extraordinarily long time. According to one of the construction workers on scene, Bobby Gray, the column cuts took an hour each:

Some of those box columns were more than 30 feet tall and weighed 60 tons. The plates were probably two, two and a half inches thick. Some were four feet by two feet, some were more square in shape, like two by two, or four by four. A lot of columns were wider than they were deep. It would take the ironworkers a good hour just to cut through a column.
Content from External Source
(from Nine Months at Ground Zero, The Story of the Brotherhood of Workers Who Took on a Job Like No Other, pg. 71.)
 
Looking at some old Steven Jones presention, I wonder if this might be the source of the "abundant" Manganese claim?
Metabunk 2018-01-29 23-49-55.jpg

I'm not sure how to read those. There's one for each of Mn, Fe, and F (Fluorine). The greyscale was hard to read so I converted it to color gradients, and blurred the images to get solid colors.
Metabunk 2018-01-30 00-08-16.jpg

Note the three scales are all different, so you can't compare numbers between images. This give approximately, in the highest areas:

Mn (Manganese) 35 in thin veins
Fe (Iron) 103, in thick areas
F (Fluorine) 6, in thick areas.

But what do the numbers mean?
 
Last edited:
But what do the numbers mean?
The images seem to come from a Cameca SX100 Electron Microprobe. Similar images from more recent similar machine label the scale as "cts"
Metabunk 2018-01-30 08-29-30.jpg

There's similar variations in scale, with this one going over 600:
Metabunk 2018-01-30 08-30-35.jpg

"cts" means "counts" and is the number of individual samples for a given point that fall inside the peak of element being considered. To convert that to a % of the weight is a complex process. However the cts is dependent on the sampling time. Sample twice as long, and you get twice as many cts. A better figure would be cps.

There's a lot of potential for error here just looking at cts. If it counts all the peaks (K and L) then there's the overlap problem
Metabunk 2018-01-30 09-01-08.jpg

Where if you had pure iron, and counted the samples for Manganese, you'd get quite a few counts.

Fluorine only has a single peak, which falls right in the middle of the L peak for iron.
Metabunk 2018-01-30 09-11-27.jpg
So again, it would seem that just going by the cts value you'd get some results for Mn and F, even if the sample were pure Fe.
 
I found a similar output on page 4 of this pdf from UMN. As with the cts scale, the gradients are indicators or relative intensity based on previous measurements. The UMN paper goes on at some length talking about various limits and considerations when obtaining and using such data, but much of it is greek to me.
 
Related.

https://www.azom.com/article.aspx?ArticleID=11971

Introduction
When an iron rich material is analyzed, an analyst may often observe the peak identification of elements such as fluorine (F) even though they are unlikely to be present. This article discusses the reason of that problem. ...

Visual confirmation of the presence or absence of fluorine in an iron sample may be a difficult task. However, differentiating these peaks is comparatively easy for the peak fitting algorithms, considering adequate accuracy in the data. This consideration contributes to the likely reason that leads to the misidentification of ‘F’ in a sample.
Content from External Source
Note F and Mn are the prime examples given for misidentification in iron rich samples.


Metabunk 2018-01-30 09-28-49.jpg
Content from External Source
 
A similar identification problem exists for Strontium (Sr), which has a peak (L-alpha) at 1.806 keV very near the Si K-alpha at 1.740 keV - a spread of 66 eV. The article says this should be no big problem for the software to disentangle.
This Si/Sr overlap becomes relevant in the analysis of certain red/grey chips analyzed by Jones (using Harrit as lead author): One of their key graphs detected minute signals of Sr in the noise beyond 14 keV, where the plot fizzles out - the K-family lines. But then there ought to be also a signal at said 1.806 keV location. This L-alpha would be much much larger than the K-lines, but it's buried under the Si K-alpha. This graphic from a whiteletter Harrit wrote in May 2009:
Harrit_WhyNotPrimer_05b.jpg
No label for Sr L-alpha.

I have done two simulations of the "LaClede" primer paint that was specified for the WTC1+2 floor joists - the red plot is the original paint recipe, in the blue line, I substituted Ge for Si, to remove the Si-peak. You can see a clear Sr-peak there:
Compare LaClede - LaClede-Si+Ge 20 keV.jpg
(I cut the plot at 10 keV, but around 14 and 16 keV, there is no visible peak amonge the noise).
(Note by the way that the highest Ge-peak, representing the exaxt same mass fraction as Si, has not even half the hight of the Si-peak. Why? Because it's the L-alpha of Ge, but K-alpha of Si. The Ge K-alpha is the blip very near 10 keV; that is short because all counts peter off as you go to the right.)

I have to go to sleep, or else I would dig up links and more graphs to make a more comprehensive point. The short is: I believe Jones and Harrit sometimes edit the element labels in their EDS plots.

(I also want to note that they forgot to "find" fluoride in the red material :D)
 
Another paper discussing the (several!) causes for misidentifying elements in EDS plots:
http://www.geology.wisc.edu/~johnf/g777/Scanning/Newbury_2009.pdf
: Automated peak identification in electron beam-excited X-ray microanalysis with energy dispersive X-ray spectrometry has been shown to be subject to occasional mistakes even on well-separated, highintensity peaks arising from major constituents (arbitrarily defined as a concentration, C, which exceeds a mass fraction of 0.1). The peak identification problem becomes even more problematic for constituents present at minor (0.01rCr0.1) and trace (Co0.01) levels. ‘‘Problem elements’’ subject to misidentification as major constituents are even more vulnerable to misidentification when present at low concentrations in the minor and trace ranges. Additional misidentifications attributed to trace elements include minor X-ray family members associated with major constituents but not assigned properly, escape and coincidence peaks associated with major constituents, and false peaks owing to chance groupings of counts in spectra with poor counting statistics. A strategy for robust identification of minor and trace elements can be based on application of automatic peak identification with careful inspection of the results followed by multiple linear least-squares peak fitting with complete peak references to systematically remove each identified major element from the spectrum before attempting to assign remaining peaks to minor and trace constituents.
Content from External Source
 
Straight cuts just indicate the skill of the user, and the circumstances. You can be a great operator, but if you have to stand or lean at an awkward angle, you won't be able to make a straight cut. Honestly, it's like none of these people have actually seen a torch cut (or other thermally cut) surface before. My partner and I used to ask iron workers where the alligators were, and when we got the WTF look, we'd say one was obviously chewing on this steel here, where'd it go?

With regard to the elements in question, none of those are unusual to find in steel. Al and Si are used in structural steels as deoxidizers during casting, calcium and possibly potassium are used in slag formation to protect the molten steel surface, Mn is present in virtually all steels, as is Sulphur, and the two go together, ie were it not for Sulphur, we wouldn't need to add Mn. I've had a fair amount of EDS work done for me, but am unfamiliar with the intricacies of it's interpretation, but it appears to be like most other analytical techniques. If you don't do it right and interpret the results properly, the end results don't mean anything. No analytical method I'm familiar with is as clean and sure as you see on TV or in movies. It's hard to imagine a BYU physicist or any architect or engineer familiar with construction not understanding how these tests could be wrong or misinterpreted.
 
Back
Top