
You are using an out of date browser. It may not display this or other websites correctly.
You should upgrade or use an alternative browser.
You should upgrade or use an alternative browser.
Useful Chemtrail Debunking Images and Infographics
- Thread starter Mick West
- Start date
Ross Marsden
Senior Member.
Well it's pretty dramatic! From 2 or 3 floors up, none or very little of the hot water reaches the ground. It has all evaporated, I suppose.
Notice that it is very cold and that it's ice foggy.
Why not just bring the boiling kettle out to the balcony on an extension cord, and watch the plume of steam -> ice cloud trail off into the distance in the light breeze?
Yes, this is a simulation of what we are talking about... in some conditions a plume of water vapor does not dissipate.
Leifer
Senior Member.
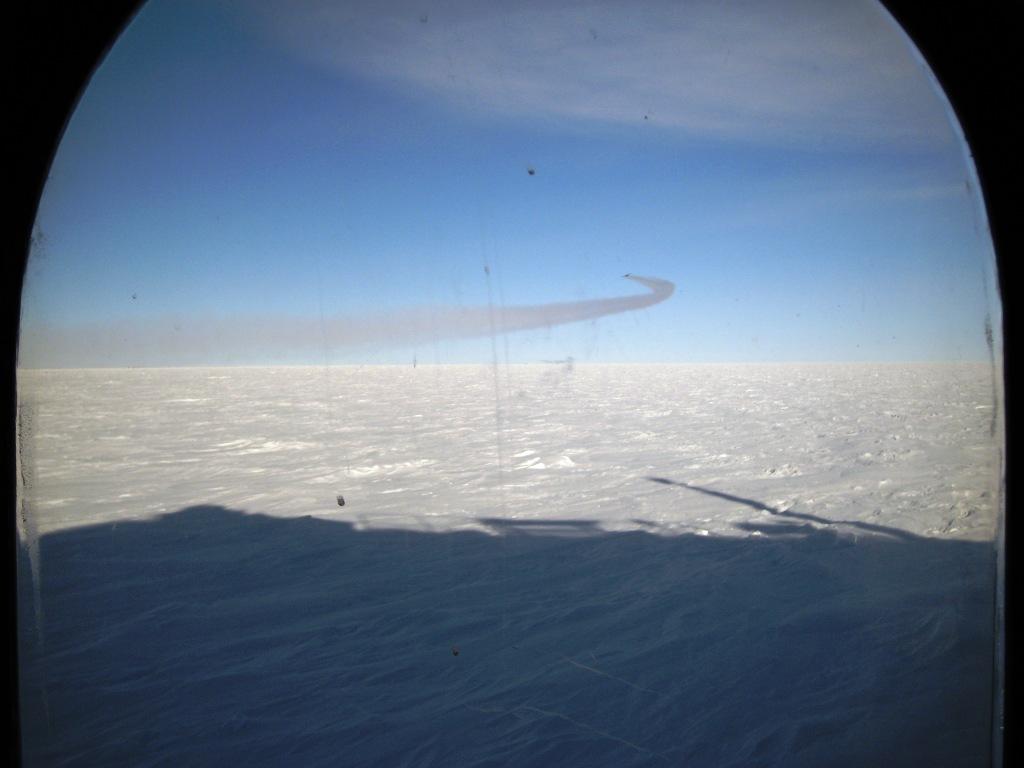
Ground/near-ground contrails, Antarctic....C-130.
credit, ESRL website,
https://www.esrl.noaa.gov/gmd//webdata/spo/gallery/Emrys_Hall_Album/The contrail.JPG
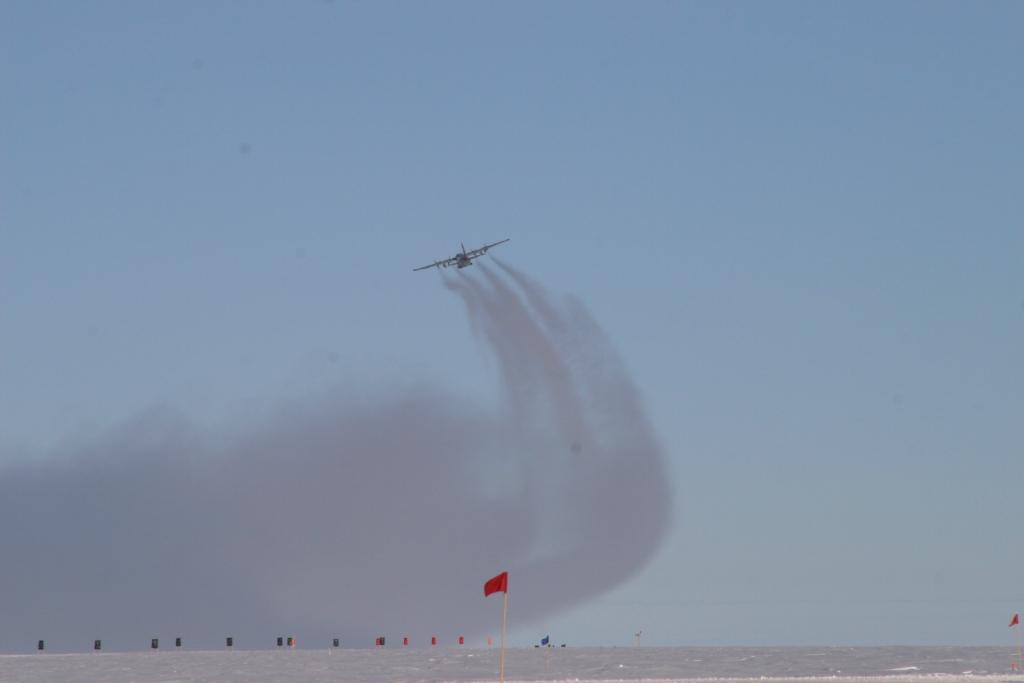
https://www.esrl.noaa.gov/gmd//webdata/spo/gallery/Emrys_Hall_Album/Herc contrail out the window at ARO.JPG
credit, ESRL website,
https://www.esrl.noaa.gov/gmd//webdata/spo/gallery/Emrys_Hall_Album/The contrail.JPG

https://www.esrl.noaa.gov/gmd//webdata/spo/gallery/Emrys_Hall_Album/Herc contrail out the window at ARO.JPG
Last edited by a moderator:
cloudspotter
Senior Member.
Well it's pretty dramatic! From 2 or 3 floors up, none or very little of the hot water reaches the ground. It has all evaporated, I suppose.
Notice that it is very cold and that it's ice foggy.
Why not just bring the boiling kettle out to the balcony on an extension cord, and watch the plume of steam -> ice cloud trail off into the distance in the light breeze?
Yes, this is a simulation of what we are talking about... in some conditions a plume of water vapor does not dissipate.
Slightly related (and very cool - literally)
Cairenn
Senior Member
One of the things that was hard to explain during the oil spill was the purpose of the using Corexit on the oil. It is primarily a surfactant, reducing the surface tension of the oil, thus allowing it to evaporate easier and allowing the natural oil eating microbes in the Gulf to consume it easier. It did allow the smaller droplets to mix into the top few feet of the water column. That part got turned into 'it sunk the oil'.
Miss VocalCord
Senior Member.
Not sure if this one was already mentioned earlier, but somebody gave me a link. It is called "Cloud Studies 1905 and 1925":
https://plus.google.com/photos/107393796095434664991/albums/5236028370090070321
https://plus.google.com/photos/107393796095434664991/albums/5236028370090070321
Not sure if this one was already mentioned earlier, but somebody gave me a link. It is called "Cloud Studies 1905 and 1925":
https://plus.google.com/photos/107393796095434664991/albums/5236028370090070321
That's my album
") I scanned those in from my personal 1925 copy, there's also full versions elsewhere.
I scanned those in from my personal 1925 copy, there's also full versions elsewhere. http://contrailscience.com/clouds-before-planes-cloud-studies-1905/
Miss VocalCord
Senior Member.
You're achieving fame all around the world
Critical Thinker
Senior Member.
Thought that this may help to convey an idea of the amount of air traffic that occurs, as well as to explain to some folks why they might be seeing all those contrails. Not sure if this animation is supposed to represent all traffic, or just commercial air traffic. (On a totally unrelated note... the other maps they have may also be worth a gander)
http://www.buzzfeed.com/jeremybender/maps-that-are-missing-from-your-life
20. And here is the current depiction of air traffic over a 24-hour period.

http://www.buzzfeed.com/jeremybender/maps-that-are-missing-from-your-life
20. And here is the current depiction of air traffic over a 24-hour period.
Thought that this may help to convey an idea of the amount of air traffic that occurs, as well as to explain to some folks why they might be seeing all those contrails. Not sure if this animation is supposed to represent all traffic, or just commercial air traffic. (On a totally unrelated note... the other maps they have may also be worth a gander)
http://www.buzzfeed.com/jeremybender/maps-that-are-missing-from-your-life
20. And here is the current depiction of air traffic over a 24-hour period.
View attachment 4339
Have you seen this:
http://contrailscience.com/map/
Critical Thinker
Senior Member.
I don't think this website has been mentioned as yet, which illustrates current wind conditions.
http://hint.fm/wind/

http://hint.fm/wind/
Ross Marsden
Senior Member.
It would be interesting to see one of these with winds at typical contrail altitude - say 34000 ft 250 hPa.
TomC
Member
I can probably produce something like that at work (although it will be model data of course)It would be interesting to see one of these with winds at typical contrail altitude - say 34000 ft 250 hPa.
Away on a course next week, I'll have a go the week after
I can probably produce something like that at work (although it will be model data of course)
Away on a course next week, I'll have a go the week after
The actual maps is animated and zoomable. Quite impressive. If we could munge something into the same data format as wind-data.js, then we could re-purpose their code to do the animation at different altitudes.
TomC
Member
Ahh.. slightly more complex.. I can do a static image of streamlines quite easily. Would have to check their data format to see if I can repurpose our data into their format. In my previous career I did a lot of computer coding and data manipulation so I might be able to manage itThe actual maps is animated and zoomable. Quite impressive. If we could munge something into the same data format as wind-data.js, then we could re-purpose their code to do the animation at different altitudes.
Ross Marsden
Senior Member.
You/we will need to check the format of that data array.
x0: -130.103438,
y0: 20.191999,
x1: -60.885558,
y1: 52.807669,
These are the longitude and latitude of the left-bottom (point 0) and top-right (point 1).
gridWidth: 501.0,
gridHeight: 237.0,
These are the number of grid points west to east and south to north for a total of 118737, and that is the length of that array called "field".
The crucial thing is how that array is laid over the map. We need to suss the map projection and make sure our data source matches the arrangement.
The data is probably from GFS at some server, so if we use the same model and domain, all should be sweet.
This animation shows the streamlines "moving", but illustrating the data at a certain instant.
I would like to see the animation through a 6, 12 or 24 hour period, and see the wind field evolve in that time. Data is only available at 6 hour time steps (maybe 3?), so considerable interpolation is required in the time dimension. I am not asking fore this here, though.
Unfortunately when I click on the the source of the data:
http://ndfd.weather.gov/technical.htm
I get:
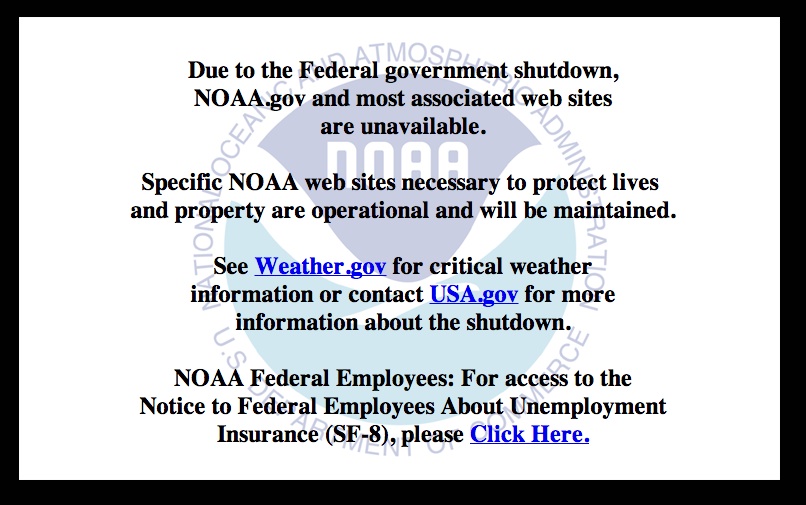
I suspect the grid projection is simply equirectangular.
http://ndfd.weather.gov/technical.htm
I get:
I suspect the grid projection is simply equirectangular.
Last edited:
Ross Marsden
Senior Member.
The grid projection probably is based on latitudes and longitudes, and it will be equi-angular; at maybe 0.25 degree intervals.
The latitudes and longitudes of the corners are those of the map which is probably polarstereographic. The model data grid is then draped over that geography.
If you want I can have ago at obtaining the specifics of the polarstereographic projection.
The latitudes and longitudes of the corners are those of the map which is probably polarstereographic. The model data grid is then draped over that geography.
If you want I can have ago at obtaining the specifics of the polarstereographic projection.
Leifer
Senior Member.


cE9s4PsMmnBQzSW8PGPw~~60_12.JPG") Just searched eBay....there are several older books, pamphlets, and documentation available from book sellers.....showing illustrations and photos of previous (long-standing) cloud classifications, that are routinely (falsely) claimed as "new cloud classifications".
Just searched eBay....there are several older books, pamphlets, and documentation available from book sellers.....showing illustrations and photos of previous (long-standing) cloud classifications, that are routinely (falsely) claimed as "new cloud classifications".These books/images refute that claim.
I just bought some. I will post images of my purchases....maybe even a video.
There is one book that is $300 (did not buy)....it's all in German.....1917 WWI era.
http://www.ebay.com/itm/RARE-German...t=Antiquarian_Collectible&hash=item3a7ce9cb4e
(link may be time-sensitive....may not last long, so I pulled an external image)
...full photo credit goes to the seller, "nomadvinyl".
Leifer
Senior Member.

(seven vintage meteorology books)
Here is a preview of the historical book/print items I bought. Frankly, these are fairly inexpensive items.....not in much in demand. However in our case, they will be very informative.
1907 Color Illustration Print~CLOUD FORMATIONS~Nimbus,Cirrus,Cumulus,Stratus,etc
1938 CLOUD Classification US WEATHER BUREAU Meteorology BOOK Dept of Agriculture
1962 Radar Observes The Weather: New Understanding of Cloud Physics by Battan
Hot Pink Flying Saucers And Other Clouds
7 VINTAGE METEOROLOGY TABLES CLIMATE CLOUDS STAR ALTAS WEATHER FORECASTING BOOKS
Harold. Charles; CAMERA ABOVE THE CLOUDS
Also, a purchase of a circa 1880's encyclopedia "Writers Of Eminence In Literature, Science and Art "
which has 6 plates of cloud descriptions.
....pics to follow, when I receive the books.
EDIT: surprisingly, I was able to buy the German cloud book, by offering 1/2 the asking price, and the offer was accepted. I'll get my German workmate to translate the important bits. (I'll buy her lunch). Also accepted (won by bid) was the pamphlet,
"Codes for Cloud Forms States of the Sky US Dept Agriculture Weather Bureau 1938"...perhaps it is the same pamphlet as I already purched above.....we'll see.....but it was not expensive, in either case.

Last edited:
Critical Thinker
Senior Member.
http://cloudappreciationsociety.org/gallery/#p=1&i=0
Many cool pictures of clouds along with some discussion.


(@Cairenn already mention this site in another post I just noticed, Just adding a couple of screen captures from the site)
Many cool pictures of clouds along with some discussion.
(@Cairenn already mention this site in another post I just noticed, Just adding a couple of screen captures from the site)
Last edited by a moderator:
I made a video, showing my recent book purchases, documenting cloud types, in the
often mistaken relationship of "chemtrails and HAARP" ("scalar wave clouds").
In one book, there's also a small section on condensation trails (1957)
Chemtrail Scalar Clouds Not True
Nice, I'll have to get a copy of that Cloud Study book for my collection.
mrfintoil
Active Member
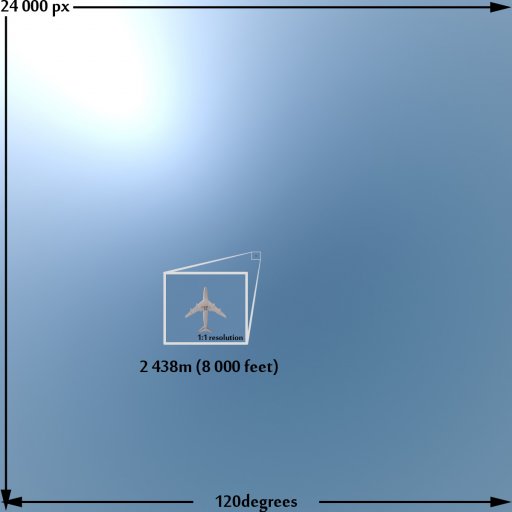
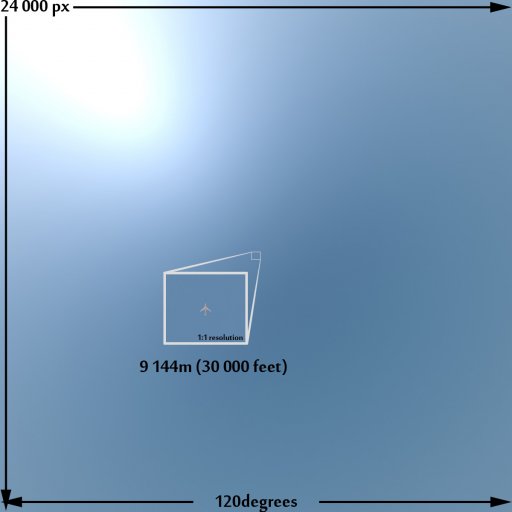
Here are actually two artificial images I made some years ago showing the visual difference between a plane at 8000 and 30 000 feet, seen from 180 centimetres above the ground. I think they were made as an experiment when discussing whether planes could be seen on really high altitudes or not.
The images are baser upon two factors, the resolution of the eye, which is estimated to be around 500 megapixel, which means 24k pixels when squared, and the effective human field of vision, which is roughly 120 degrees.
The artificial images show the actual size in the 1:1 box since the images have been scaled down. I don't know how accurate they really are, but they seem to match pretty much what really high flying planes really looks like. I'd love if someone with more experience could say how much they resemble a real situation. Just keep in mind that this virtual scene contained ideal weather conditions (basically no obscuring elements) except some slight atmospheric haze if I remember correctly, and the observer is standing perfectly below the plane.
Attachments
Last edited:
Here are actually two artificial images I made some years ago showing the visual difference between a plane at 8000 and 30 000 feet, seen from 180 centimetres above the ground. I think they were made as an experiment when discussing whether planes could be seen on really high altitudes or not.
The images are baser upon two factors, the resolution of the eye, which is estimated to be around 500 megapixel, which means 24k pixels when squared, and the effective human field of vision, which is roughly 120 degrees.
The artificial images show the result. I don't know how accurate they really are, but they seem to match pretty much what really high flying planes really looks like, barely visible.
I'd love if someone with more experience could say how much they resemble a real situation.
The problem with those images it that, unless you put your face one inch from the monitor, they don't represent the human field of vision. On my monitor at normal view distance it's about 30 degrees.
mrfintoil
Active Member
The problem with those images it that, unless you put your face one inch from the monitor, they don't represent the human field of vision. On my monitor at normal view distance it's about 30 degrees.
No, the borders of the images are representing the complete 120 degree field of vision, like if those images were the only thing you'd see. They are not supposed to emulate a real situation by including the distance from your eyes to the computer screen, because like you say, the distance from your eyes and screen size vary, and the image won't fill up your entire field of vision. Think of it more like the only picture you'd see in a real situation. That was the purpose of those images.
No, the borders of the images are representing the complete 120 degree field of vision, like if those images were the only thing you'd see. They are not supposed to emulate a real situation by including the distance from your eyes to the computer screen, because like you say, the distance from your eyes and screen size vary, and the image won't fill up your entire field of vision. Think of it more like the only picture you'd see in a real situation. That was the purpose of those images.
I know, but it makes the planes look misleading small in most viewing situations.
mrfintoil
Active Member
Yeah the original images are actually 24k x 24k pixels, but since that is ridiculously large for viewing on a 1920x1200 or 1080 screen I had to reduce them, but keep the actual 1:1 size in the little box.
But I guess the images need to be accompanied by some kind of description. Feel free to remove them if you think they are simply too vague and diffuse.
But I guess the images need to be accompanied by some kind of description. Feel free to remove them if you think they are simply too vague and diffuse.
I made a video, showing my recent book purchases, documenting cloud types, in the
often mistaken relationship of "chemtrails and HAARP" ("scalar wave clouds").
In one book, there's also a small section on condensation trails (1957)
Chemtrail Scalar Clouds Not True
I've scanned in the contrails pages of the 1957 book into a PDF with copyable text:
https://www.metabunk.org/files/1957-Cloud-study-a-pictorial-guide-OCR.pdf
External Quote:A small wind shear can draw out a contrail into an almost horizontal sheet of cloud [no. 70]. In this picture, the right hand trail is a few minutes older than the other and has been extended more. Some- times several trails drawn out in this way cover most of the sky with cirrus. If the trails are very persistent the clear air must be saturated for ice.
Last edited:
cloudspotter
Senior Member.
Professor Stan Gedzelman has put together some work on the sky in art
http://www.sci.ccny.cuny.edu/~stan/skyart.html
Some interesting entries in this chapter on the appearance of mammatus clouds in crucifixion paintings from the 1500's
http://www.sci.ccny.cuny.edu/~stan/skyart6.pdf
http://www.sci.ccny.cuny.edu/~stan/skyart.html
Some interesting entries in this chapter on the appearance of mammatus clouds in crucifixion paintings from the 1500's
http://www.sci.ccny.cuny.edu/~stan/skyart6.pdf
Barnacle
New Member
I found a bunch of news articles dating back to the 50's speaking of contrails blocking out the sun etc etc
Hopefully people can use these as a reference to quell the chemtrail theory. I showed them to Max Bliss and he suggested, well, that's how long they been spraying. I showed them to Russ Tanner and he suggested that jet turbo fans don't and never did have the ability to produce contrails and that these articles , like many movies and books have been edited "to normalise chemtrails"
To find similar images for yourself.. use search trems "contrails" "jets trails" etc on google/news / search tools / archives or custom date eg up to 1980
Enjoy.

http://news.google.com/newspapers?i...IBAJ&pg=4006,2121816&dq=jets+hiding+sun&hl=en

http://news.google.com/newspapers?n...VNYAAAAIBAJ&sjid=gfcDAAAAIBAJ&pg=5643,1072397

http://news.google.com/newspapers?i...pMNAAAAIBAJ&pg=3016,658814&dq=contrails&hl=en

http://news.google.com/newspapers?i...,4493966&dq=clouds+of+exhaust+particles&hl=en

http://news.google.com/newspapers?n...CPlXAAAAIBAJ&sjid=VfYDAAAAIBAJ&pg=6930,263522
Hopefully people can use these as a reference to quell the chemtrail theory. I showed them to Max Bliss and he suggested, well, that's how long they been spraying. I showed them to Russ Tanner and he suggested that jet turbo fans don't and never did have the ability to produce contrails and that these articles , like many movies and books have been edited "to normalise chemtrails"
To find similar images for yourself.. use search trems "contrails" "jets trails" etc on google/news / search tools / archives or custom date eg up to 1980
Enjoy.
http://news.google.com/newspapers?i...IBAJ&pg=4006,2121816&dq=jets+hiding+sun&hl=en
http://news.google.com/newspapers?n...VNYAAAAIBAJ&sjid=gfcDAAAAIBAJ&pg=5643,1072397
http://news.google.com/newspapers?i...pMNAAAAIBAJ&pg=3016,658814&dq=contrails&hl=en
http://news.google.com/newspapers?i...,4493966&dq=clouds+of+exhaust+particles&hl=en
http://news.google.com/newspapers?n...CPlXAAAAIBAJ&sjid=VfYDAAAAIBAJ&pg=6930,263522
Barnacle
New Member
Here are a few more, I don't have images saved of them though..
http://news.google.com/newspapers?i...AAAAIBAJ&pg=858,1486824&dq=vapor+trails&hl=en
http://news.google.com/newspapers?i...AAAIBAJ&pg=4558,2054892&dq=vapor+trails&hl=en
http://news.google.com/newspapers?i...BAJ&pg=2929,2163163&dq=contrails+spread&hl=en
http://news.google.com/newspapers?i...IBAJ&pg=6643,541867&dq=contrails+spread&hl=en
http://news.google.com/newspapers?i...pg=1695,3032457&dq=persistent+contrails&hl=en
http://news.google.com/newspapers?i...kMAAAAIBAJ&pg=2917,9515098&dq=contrails&hl=en
http://news.google.com/newspapers?i...cDAAAAIBAJ&pg=2904,5247238&dq=contrails&hl=en
http://news.google.com/newspapers?i...pg=3970,4084608&dq=vapor+trails+climate&hl=en
Barnacle
New Member
Thanks, I'd got a bunch a few years ago on contrailscience.com, but some of those are new to me. Google much be scanning new Newspapers all the time.
Yes, the ones on contrail science gave me the idea to search myself. Yup, I gather they are scanning new papers as they get them. They are a fascinating read and obviously completely debunk the "sky wasnt like this when I was young" theory.
Hama Neggs
Senior Member
But, as Max did... they just adapt their theory to encompass the new info and ignore that it proves the debunkers right and previous claims about chemtrails wrong.Yes, the ones on contrail science gave me the idea to search myself. Yup, I gather they are scanning new papers as they get them. They are a fascinating read and obviously completely debunk the "sky wasnt like this when I was young" theory.
Barnacle
New Member
But, as Max did... they just adapt their theory to encompass the new info and ignore that it proves the debunkers right and previous claims about chemtrails wrong.
Yup, their theory has to constantly evolve to cope with the ever mounting evidence against it. Incidentally, I was just listening to him in an interview posted on this forum, and he is saying that we didn't have these trails until a couple of decades ago. So, his story changes depending on who he's talking to.
The latest theory from Tanner is that they now have invisible chemtrails, so even the clearest blue skies can be just as deadly. So now, they don't even require visible evidence.
Hama Neggs
Senior Member
Yes. Tanner has been saying that for a while now- that short(or non-existent?) trails are chemtrails too. They don't seem to care about contradictions in their story or that it changes.Yup, their theory has to constantly evolve to cope with the ever mounting evidence against it. Incidentally, I was just listening to him in an interview posted on this forum, and he is saying that we didn't have these trails until a couple of decades ago. So, his story changes depending on who he's talking to.
The latest theory from Tanner is that they now have invisible chemtrails, so even the clearest blue skies can be just as deadly. So now, they don't even require visible evidence.
Hama Neggs
Senior Member
Yup, their theory has to constantly evolve to cope with the ever mounting evidence against it. Incidentally, I was just listening to him in an interview posted on this forum, and he is saying that we didn't have these trails until a couple of decades ago. So, his story changes depending on who he's talking to.
The latest theory from Tanner is that they now have invisible chemtrails, so even the clearest blue skies can be just as deadly. So now, they don't even require visible evidence.
Tanner has made himself somewhat famous by claiming that he is one of the rare people who can smell and taste chemtrails. Now I see that others are starting to make that same claim. It's just a meme which people are adopting because they started thinking about it and decided that "Hey... I smell something too!"
Similar threads
- Replies
- 3
- Views
- 575
- Replies
- 2
- Views
- 579
- Replies
- 1
- Views
- 466