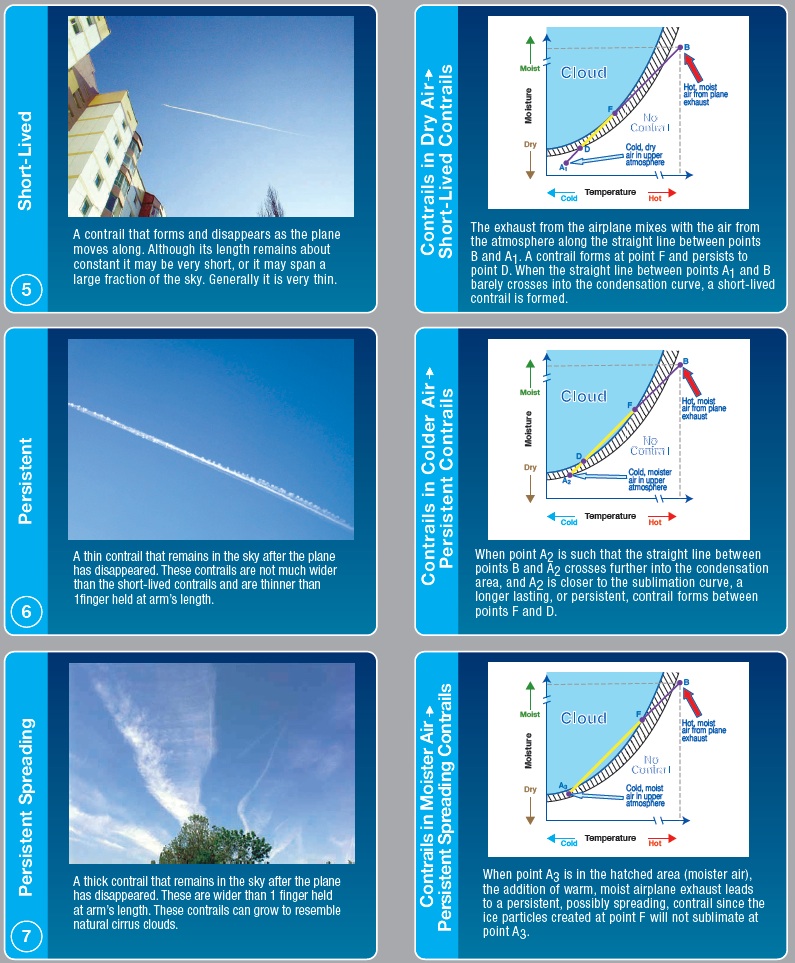
I have a chart that I have screenshot in 3 different poses.
Here they are:
The axes are temperature (horizontal) and water vapour partial pressure (vertical).
The static parts show the
saturation vapour pressure with respect to ice, and the
saturation vapour pressure with respect to water.
The area below the
ice line is unsaturated, and cloud won't form there; any cloud in this region will eventually dissipate.
The area between
the ice line and
the water line is where the air is supersaturated with respect to ice, but unsaturated with respect to water.
In the presence of ice, there is a surplus of water vapour and it will deposit on any ice present until the water vapour partial pressure decreases below the
saturation pressure for ice. If there is supercooled liquid water in this region it will evaporate because this region is
unsaturated with respect to water.
Above the
water line is
saturated with respect to water, and will be in cloud - either of ice crystals or supercooled water droplets.
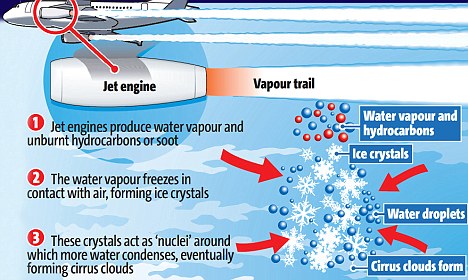
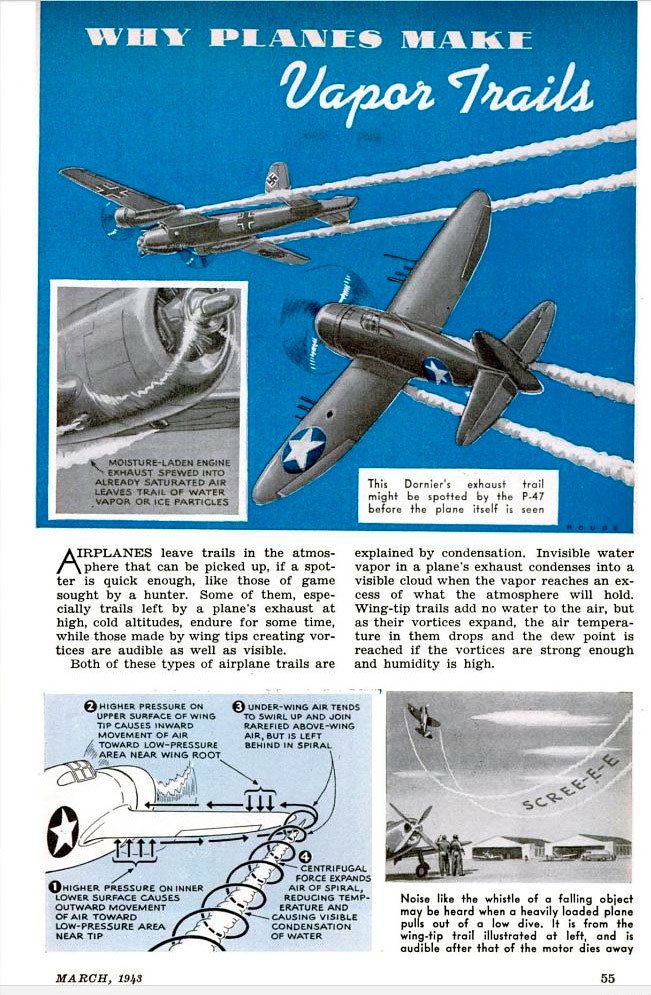
For condensation or freezing to occur, there must be cloud condensation nuclei (CCN, for condensation) or freezing nuclei (FN, for freezing).
There is an abundance of CCN in the atmosphere, so moist air brought above the
blue line (by any process; cooling, mixing) will immediately and spontaneously condense to form a visible cloud.
In the atmosphere there are very few FN, so air brought into the region between
the ice and
water line will not form an ice cloud unless some freezing nuclei turn up.
The variable part of the charts is a line that represents
the mixing of exhaust gasses (from way up to the top right, "off the chart"), and the environment (bottom, labelled).
The Relative Humidity with respect to ice (RHw) and with respect to ice (RHi) is shown as a percentage.
These are formed by the ratio between the water vapour pressure (WVP) of the environment and the saturation WVP with respect to water (blue), and the saturation WVP with respect to ice (cyan), respectively (vertical lines in
red,
blue and
cyan).
This first pose of this chart represents the jet exhaust gasses mixing with the environment and NOT forming a contrail.
Even though the mixture is ice saturated for a while, it is
never water saturated - it never crosses the
water saturation line.
The second pose represents the jet exhaust gasses mixing with the environment and forming an
ephemeral contrail.
The mixture condenses where the temperature is about -38°C (in this case). The droplets of supercooled water freeze by various processes, spontaneously if the temperature is below about -42°C, or seeded by soot, or sulphur dioxide in solution (H2SO4), nitrate, etc.
Mixing continues out of the water saturation zone with no change since there is no water - it's all ice particles/crystals.
Mixing continues (towards the environment condition) through the ice saturated zone,
and out. Now the ice is in the unsaturated zone, and starts to evaporate, and so the
contrail dissipates.
The third pose of this chart represents the jet exhaust gasses mixing with the environment and forming an
persistent contrail.
The mixture condenses where the temperature is about -36°C (in this case). The droplets of supercooled water freeze by various processes, as in the pose above.
Mixing continues out of the water saturation zone with no change since it's all ice particles/crystals.
Mixing continues towards the environment condition which is in this case is in side the ice-supersaturated zone.
Now the ice cannot evaporate - the air is
already ice saturated. So the
contrail persists, and the individual ice crystals grow in size by the deposition of the surplus water vapour directly onto the ice.