JRBids
Senior Member
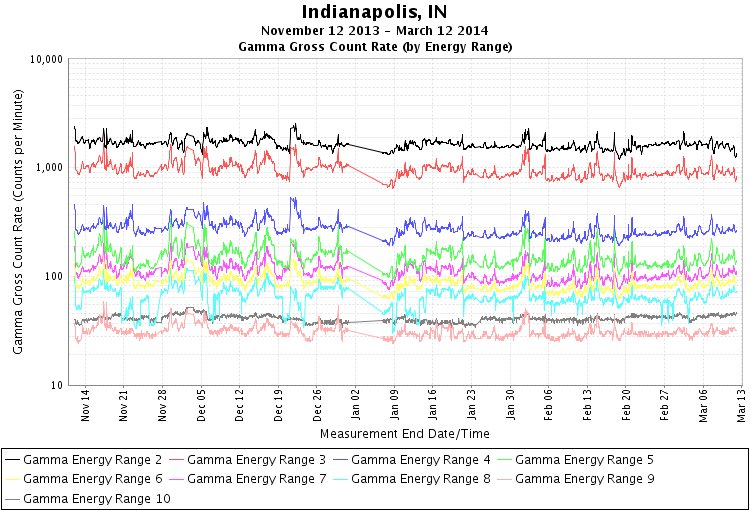
This person has been posting on CGS for a little while about Fukushima radiation in the rain.
https://www.facebook.com/groups/globalskywatch/permalink/10153899853195302/?stream_ref=2
Usually when they post maps with chemical hazards, biological and other warnings I can figure out that they are from innocuous sources . I'm not sure what the interpretation of this map is.
.png")
https://www.facebook.com/groups/globalskywatch/permalink/10153899853195302/?stream_ref=2
Usually when they post maps with chemical hazards, biological and other warnings I can figure out that they are from innocuous sources . I'm not sure what the interpretation of this map is.
")