The Quantity of Iron Microsphere at WTC Ground Zero after 9/11

Mick West

Administrator
Staff member
"How much", or "how many"? AE911 says:

http://www1.ae911truth.org/home/348...c-dust-reveal-use-of-thermitic-materials.html
External Quote:
The fraction of microspheres in the dust varied (between 0.2 and 1.3 % for USGS outdoor samples and a mean of 5.87% for all RJ Lee samples) depending on the area where the samples were taken. Due to their shape and density, the spheres were not likely to have traveled as far as other components of the dust. The diameter of the spheres in two evaluated dust samples ranged from about one micron (0.001 mm) to 1.5 mm.
The numbers come from:

The 0.2% number:
Metabunk 2018-02-23 17-46-48.jpg


The 1.3% number:
Metabunk 2018-02-23 17-48-29.jpg


http://911research.wtc7.net/essays/..._WTCDustSignatureCompositionAndMorphology.pdf
Metabunk 2018-02-23 17-50-13.jpg


But what do these numbers mean in terms of the actual number or weight of iron microspheres, and what can we reasonably compare it against?

Seems to me this measure is frequency or count of spheres.

And you'd need to compare against another steel framed building fire collapse dust to see if they are actually suspicious. The dust in other buildings that did not collapse is mostly stuff like flakes of human skin.
 

Attachments

The USGS data is not representing "Fe spheres", it represents the total of the element Fe in all of the dust - regardles of particle shape or chemical species. You'll have everything from metallic iron to oxides to sulfides/sulphates to carbonates to organic Fe-compounds.

Very clearly, the R.J. Lee data is an extreme outlier. Their ca. 6% "iron rich sphers" represent at least 4% Fe - if all the Fe is fully oxidized and the spheres are contaminated with some other stuff.

The RJ Lee samples were collected many months after 9/11, weren't they? Lot's of chances for Fe-spheres to get enriched through various processes.
 
The RJ Lee samples were collected many months after 9/11, weren't they? Lot's of chances for Fe-spheres to get enriched through various processes.

Lee Time Compoarison.jpg


All of the RJ-Lee samples were collected AFTER June 8 2002, all from the Deutsche Bank building (aka Banker's Trust Building) at 130 Liberty street, directly south of WTC2. June 2002 is after the removal of all the steel from the site (using microsphere producing oxy cutting).

External Quote:
Samples were collected from the Building beginning June 08, 2002 using "TP01: Protocol for the Monitoring of Non-Biological Indoor Environmental Contaminants at 130 Liberty Street" dated May 10, 2002.
(The building was seemingly never reoccupied, and was demolished a few years later)

Reference is made the to the gash, (which they italicize). It's not clear it this means they took all the samples from areas directly exposed to the gash, or if they sampled the entire building.

Here's the gash a few days after looks like lots of dust coating the surface.
Metabunk 2018-02-24 08-35-43.jpg


Metabunk 2018-02-24 08-44-12.jpg


Here is the gash on Sept 21, 2001:
Metabunk 2018-02-24 08-22-13.jpg


Notice here the large piece of WTC2, and also the rip in the steel frame of the building, with one exterior column broken, and several beams ripped and bent.
Metabunk 2018-02-24 08-23-29.jpg


Wider context:
Metabunk 2018-02-24 08-27-41.jpg


Interior view showing damaged beam, dust on lower right:
Metabunk 2018-02-24 08-30-07.jpg


So given that the samples were taken nine months after the event, there's a significant possibility that some of those spheres came from activity after the event, like the removal of steel by cutting and the grinding of edges to make them safe.

In addition, there would have been some localized production of microspheres due to steel-steel and steel-concrete contacts when the gash was created by the falling piece(s) of WTC2.

Here's the gash at a later date. It would be important to determine what it actually looked like on June 8 2002, and if any steel work was going on during the collection period.
Metabunk 2018-02-24 08-39-29.jpg
 
Last edited:
Have any of the 9/11 Truth activists measured the iron microsphere frequency in the dust samples they obtained?
 
Have any of the 9/11 Truth activists measured the iron microsphere frequency in the dust samples they obtained?
Not that I know of. Presumably, this would have been an oft-cited result if they ever did that and found significant percentages by weight.
 
Steven Jones writes:
http://www.journalof911studies.com/volume/200704/JonesWTC911SciMethod.pdf
External Quote:
I collected iron-rich particles in the dust by pulling a magnet across the outside of a plastic bag containing the dust, pulling upwards to the top the magnetic material and pulling this aside for further analysis. These magnetic particles were, as one might expect, rich in iron. There was a surprising amount of this iron-rich material. Although others have reported the presence of iron-rich particles in the dust[41], I was surprised to find the abundance of spherical particles in this iron-rich component some of which were considerably larger than previously reported. It was exciting to me to find for the first time iron-rich spheres up to about 1.5 mm in diameter in a 32.1-gram sample of dust.
...
One can estimate the implied amount of thermite needed to generate so many iron-rich spheres in the WTC dust. In a sample of 32.1 grams of WTC dust, I observed with the unaided eye two metallic-looking spheres, in addition to the micron-sized spherules collected using a magnet. The mm-size spheres proved to be iron-aluminum rich. The mass of these two larger spheres (0.012g) found in this sample can be used to provide a crude estimate of the fraction of iron-rich spheres in the dust: 0.012g/32.1g = 0.04%. If the mass of the WTC dust was about 30,000 tons,[44] then the iron-rich spherule content would be of the order of ten tons.


[41] E.g., http://pubs.usgs.gov/of/2005/1165/508OF05-1165.htm
[44] http://journalof911studies.com/letters/wtc_mass_and_energy.pdf
His [44] reference mentions neither dust, nor 30,000 tons. It calculates the entire mass of the towers as 500,000 metric tons for both, so 30,000 tons of dust seems unrealistic - but that's probably another topic in itself; the mythology of dustification.
 
"How much", or "how many"? AE911 says:

http://www1.ae911truth.org/home/348...c-dust-reveal-use-of-thermitic-materials.html
External Quote:
The fraction of microspheres in the dust varied (between 0.2 and 1.3 % for USGS outdoor samples and a mean of 5.87% for all RJ Lee samples) depending on the area where the samples were taken. Due to their shape and density, the spheres were not likely to have traveled as far as other components of the dust. The diameter of the spheres in two evaluated dust samples ranged from about one micron (0.001 mm) to 1.5 mm.
The numbers come from:
[…]

http://911research.wtc7.net/essays/..._WTCDustSignatureCompositionAndMorphology.pdf
View attachment 31966

But what do these numbers mean in terms of the actual number or weight of iron microspheres, and what can we reasonably compare it against?

Seems to me this measure is frequency or count of spheres.

And you'd need to compare agains another steel framed building fire collapse dust to see if they are actually suspicious. The dust in other buildings that did not collapse is mostly stuff like flakes of human skin.

It is not clear to me what data the table in the RJ Lee report shows. The caption of the table says "Statistical p-values",
nyenvirolaw_WTCDustSignatureCompositionAndMorphology_p_table.png

while the heading in the table says "Mean of composition (%)". So it is really not obvious what these numbers mean.

The document provides some information [bold emphasis is mine]:
External Quote:

Statistical analyses were performed to compare the distribution of particle types within TP-01 occupied spaces of the Building to those found in the Background Buildings by various statistical methods. Background Building samples were analyzed by SEM in the same manner as the samples collected within the gash of the Building. The same field technicians, sampling media, equipment, and laboratory technicians were used in all stages to minimize variability.

The data were evaluated using a two-tailed heteroscedastic analysis of means test. This type of test allows for unequal variances in the two populations tested, a condition which often occurs when one population has a substantially higher mean than the other. The statistical analysis was conducted for each of thirteen particle types as well as for composites of Class A and Class C particles. Eleven particle classes were derived from major building products or were influenced by high temperature (Class A particles). An additional two particle types included carbon-rich particles and flakes and carbon-rich fibers such as skin, cellulose, and hair (Class C particles). A summary of the results obtained for this analysis is provided in Table 3.

Class A particles are common WTC Dust Markers and Class C particles are common Background Building dust particles. The statistical analysis indicates that the dust in the below ceiling space in the gash is different from that observed in Background Buildings. The material collected in the gash is consistent with building materials derived from the destruction of the WTC; the carbon-rich particulate is abundant in typical office buildings. The data clearly shows statistically significant differences with the mean values in the two classes of particles, hence the WTC Dust can be distinguished from Background Building dust.
My take on this is that the numbers are in fact the mean values of composition; they did additionally the statistically analysis, testing for the hypothesis that the variances for the test samples and those of the background buildings are being different, where they got significance in each case. However, they do not show the p-values anywhere. I doubt that the table shows p-values, since they add the values for A and C together at the end. So most probably the caption is an editorial mistake.
 
Reference is made the to the gash, (which they italicize). It's not clear it this means they took all the samples from areas directly exposed to the gash, or if they sampled the entire building.

I found another report (attached) by the RJ Lee group that gives more information how they define the gash and the other areas where the samples where collected:

External Quote:
For analytical purposes, the Building was divided into five sectors (Figure 1). The 5-Sector divisions are as follows:
  • The below gash sector (Basement B through Floor 7), includes the crushed plaza area and has approximately 300 broken windows and spandrel glass.
  • The gash sector (north side of Floors 8 through 23) contains significant structural damage and has approximately 800 broken windows/ spandrel glass.
  • The opposite gash sector (remaining portion of Floors 8 through 23) received WTC Dust deposits from the nearby exposed gash sector and has approximately 30 broken windows/ spandrel glass.
  • The above gash sector (Floors 24 through 39) received WTC Dust deposits from the nearby exposed gash sector and has approximately 350 broken windows/spandrel glass.
  • The top sector (Floors 40 and 41) includes mechanical floors with intake louvers and closet fans and has no broken windows/spandrel glass.
gash.png
 

Attachments

Two more things relating to the RJ Lee reports:

I found the sources I've posted before via the Internet Archive, finding this 2006 overview of nyenvirovlaw.org, where a collection of these RJ Lee reports are found.

There is also the report on the sampling of background buildings, and also a presentation of the findings.

I could not find much more information regarding the concentration of iron or iron spheres there besides an occasional mention or image of an iron sphere, though.
 
Regarding comparisons, the RJ Lee study compares the WTC Dust in the Deutsche Bank gash to dust in untouched nearby buildings.

Metabunk 2018-02-26 07-14-43.jpg


Like most interior dust, the "background loading" is mostly human skin, fragments of paper and clothing fibers, and other organic (carbon based) stuff. The WTC dust is an entirely different thing.

It make no sense to compare the frequency of microspheres against a background level as a multiple. Some of the other dust particles like gypsum (drywall) are not found at all in the background, so have infinitely times as many in the WTC dust.

The entire RJ Lee study is a little over the top. It's an insurance study. They want to show the building is contaminated with asbestos, and that it came from the WTC. Very large insurance claims are vigorously contested, so they needed this excessive study to prove what was essentially obvious.
Metabunk 2018-02-26 06-42-39.jpg

The fire protection has been removed from the large structural beam above the sampling location. There appears to be a tag on the beam. This suggests that engineers were in there before the sampling and did the removal for structural safety inspection. This would contaminate this particular location.
 
Last edited:
The fire protection has been removed from the large structural beam above the sampling location. There appears to be a tag on the beam. This suggests that engineers were in there before the sampling and did the removal for structural safety inspection. This would contaminate this particular location.

RJ Lee actually removed some fireproofing
http://web.archive.org/web/20060114131053/http://www.nyenvirolaw.org:80/WTC/130 Liberty Street/Mike Davis LMDC 130 Liberty Documents/Contamination in building materials from 9_11/Structural Steel/CR25.Summary.Final.121503.pdf
External Quote:
2.1.2.1 Mercury in Mill Scale from Structural Steel Forty bulk samples of mill scale were analyzed. These samples were obtained by scraping the steel surface after the fireproofing was removed and the steel was scrubbed and left to dry. The following represent the major analytical results for mercury contamination on steel.
But tried to minimize additional dust
External Quote:
After the selection of a sampling site, the site was prepared by marking an appropriate area using a 1 ft2 template and wetting with deionized water to minimize dust formation once the removal of the fireproofing commenced. As shown in Figure 14, a minimum area of 5 ft2 was marked off, and the fireproofing was then removed. The bottom side of the fireproofing contained scale of oxidized structural steel, which were scraped from the fireproofing, and formed the bulk samples called "scale from the bottom of fireproofing" (Figure 15).
Metabunk 2018-02-26 07-08-30.jpg


This looks a lot cleaner and neater than the previous one though, so I'd still lean towards structural inspection for that.
 
Last edited:
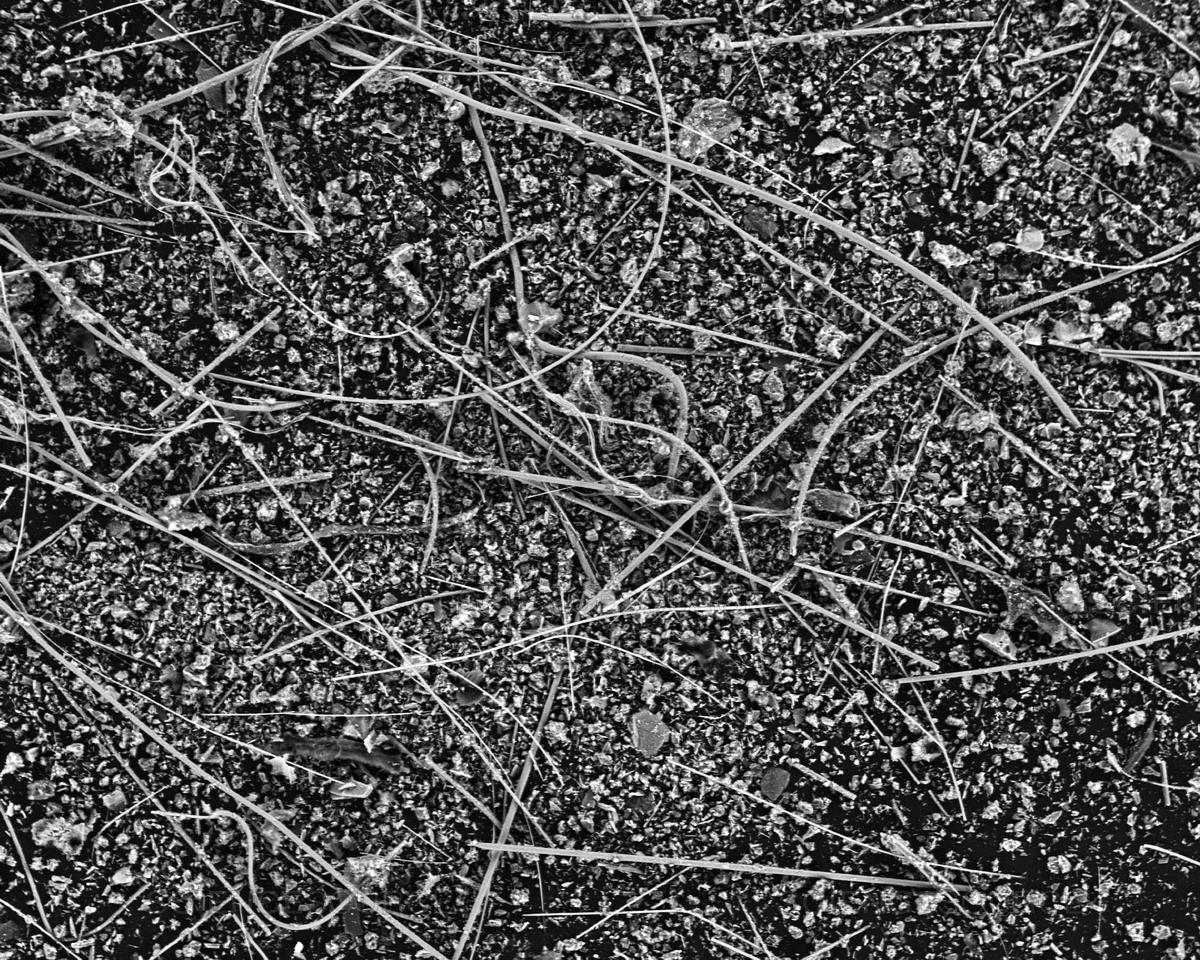
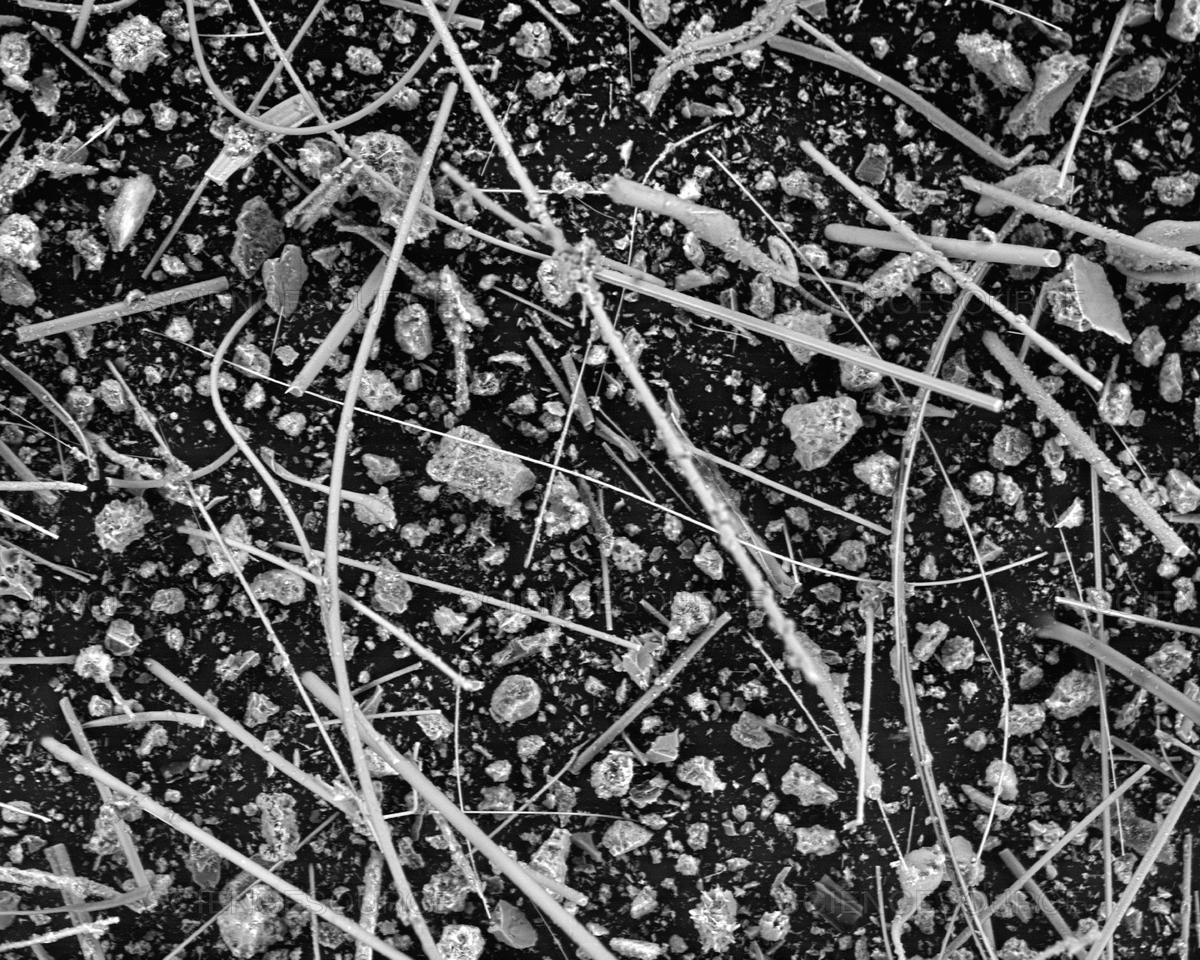
The 5.87% figure for Iron Spheres seems especially incongruous when you look at the SEM images of dust.
upload_2018-9-23_9-58-40.png


That seems quite clearly less than 1% of either the number of particles, or the area or particles. There's just one spherical particle, and it's not clear if it's iron.

There's a collection of WTC dust images here:
https://www.sciencesource.com/archive/World-Trade-Center-dust--SEM-SS2498295.html

Example:
b4562ea3e2335cd706c27ca7d230b8a6.jpg


There's maybe a few potential spheres in there, but 5% is ludicrous.
d2a90dbefe0910d8abc72cb6a4c1e3e5.jpg
 
Perhaps beating a dead horse here, but for completeness I'd like to figure out what is meant by:

External Quote:
Statistical analyses were performed to compare the distribution of particle types within TP-01 occupied spaces of the Building to those found in the Background Buildings by various statistical methods. ... The data were evaluated using a two-tailed heteroscedastic analysis of means test. This type of test allows for unequal variances in the two populations tested, a condition which often occurs when one population has a substantially higher mean than the other.

The data clearly shows statistically significant differences with the mean values in the two classes of particles, hence the WTC Dust can be distinguished from Background Building dust.
In relation to:
Metabunk 2018-09-23 15-16-00.jpg

In the "Analytical Results for Bulk Dust Samples", there's a few times iron has results, example (pdf page 240):
Metabunk 2018-09-23 15-41-41.jpg


I extracted that (four pages, not just that one) to a spreadsheet and cleaned up the Al and Fe columns, and did a scatterplot
Al Fe Scatter.png


The first line there, 20000, is 2%. The vast majority is under 1%, and the average is 0.70% Fe (Iron), and 0.39% Al (Aluminum)

It's not incredibly clear where these samples are from.
 

Attachments

Last edited:
An average of 0.70% for Iron is roughly consistent with the USGS figures. This is probably the most comparable sample, 30th floor of a building 400m south. 1.1% Iron. However this is an "Area Percentage"
Metabunk 2018-09-23 16-41-20.jpg


Here's the ranges:
Metabunk 2018-09-23 16-45-27.jpg


USGS have four spectra for iron. One of which is a "Iron Rich Particle," (which looks like a rust flake) and all of them appear to be iron oxide.


Metabunk 2018-09-23 16-47-07.jpg


Two spheres are shown. I presume this is because they look different, as the one the right has more surface structure, and more contaminants in the spectrum.
 
Last edited:
Back
Top