Debunked: HAARP rings/scalar squares, etc. validated in paper from Stanford

The forecast discussion out of Nashville, TN from as far back as the 12th mentions the possibility of thunderstorms on the 18th.

AREA FORECAST DISCUSSION
NATIONAL WEATHER SERVICE NASHVILLE TN
324 PM CDT TUE MAR 12 2013

[..]

IN THE EXT FCST...WARMING TREND TO CONTINUE AS HEIGHTS CONTINUE
TO RISE AND SFC TEMPS REACH THE LOWER 60S FOR FRIDAY AND SATURDAY.
A COLD FRONT WILL THEN SETTLE SLOWLY SOUTHWARD AND STALL ACROSS
THE AREA THROUGH THE WEEKEND. THIS WILL ALLOW FOR RAIN CHANCES TO
RETURN FOR MUCH OF THE EXT PERIOD FROM SATURDAY AND BEYOND.
INSTABILITIES WILL INCREASE BY MONDAY AS A STRONGER SFC LOW MOVES
NORTHEAST WITH A TRACK TO THE NORTH OF TN. COULD SEE SOME TSTM
ACTIVITY MON INTO MON NT.

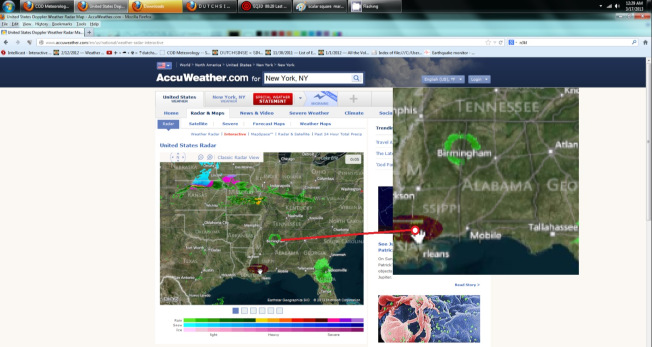
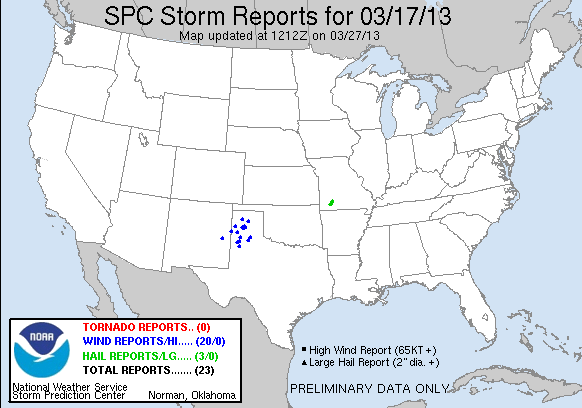
Dutch claims skies were clear/cloudless in the areas where the radar anomalies occurred but he didn't provide any satellite images as evidence and I doubt he even looked, he just made it up. In fact I'm looking at a 24 hour satellite loop right now. Yesterday, Sun. 3/17, the entire CONUS from TX, OK, KS, NE, SD and ND all the way to the east coast was under considerable cloud cover which extended even farther west the day before.

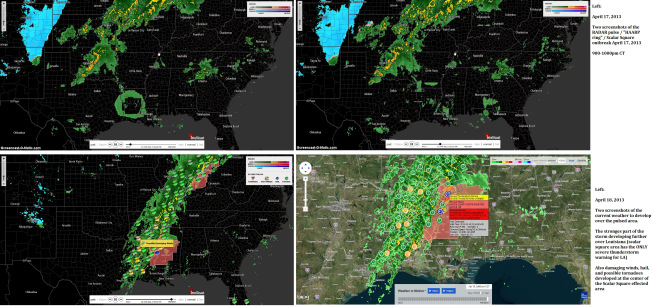
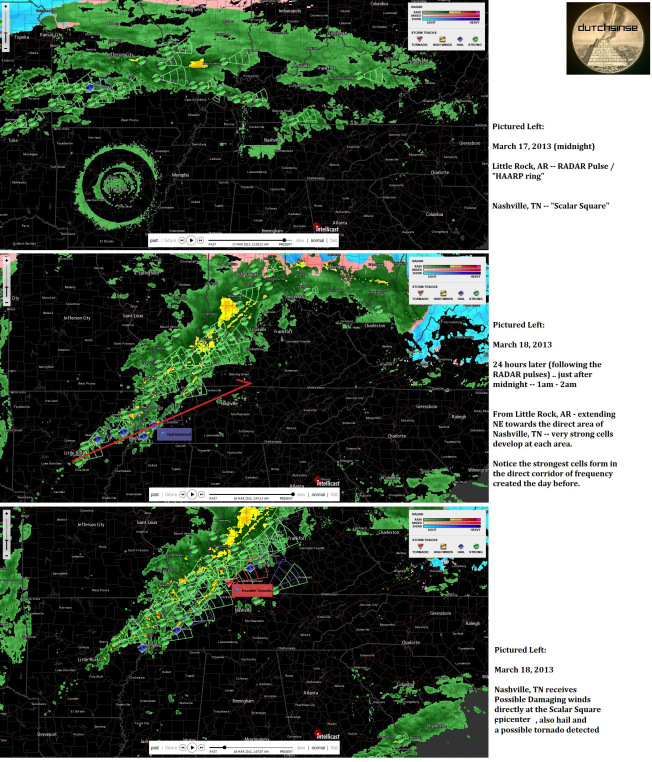
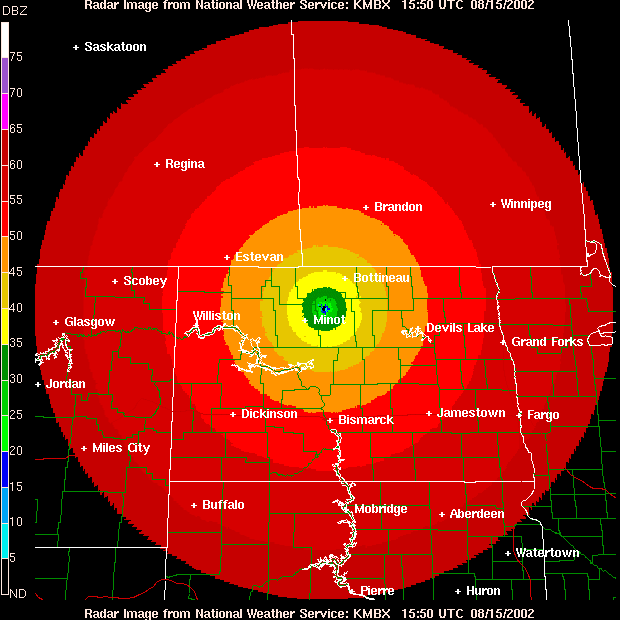
Most of the areas experiencing the RADAR pulses are CLEAR (with no cloud cover) .. a few are occurring inside the actual storms.. causing areas to “disappear” even though there IS precipitation at the location (disappearing in a sawtooth / square pattern) .

These recorded pulses occurred in the late PM on March 16, and early AM of March 17 ..

Is he incompetent, lying or both?
 
[q](disappearing in a sawtooth / square pattern) .

These recorded pulses occurred in the late PM on March 16, and early AM of March 17 .. [/q]

The square pattern is Intellicast's computer attempting to filter out non-precipitation returns from the displayed map. That has been explained to Dutch countless times.
 
He really steps in his own doodoo with his latest attempts to pigeonhole storms as labeled on Intellicast "hitting" the "epicenter" of his "haarp rings".

3/18/2013 — RADAR pulse / ‘Scalar Square’ / ‘HAARP ring’ confirmation — Tremont, MS / Bexar, AL

Again the frequency pulse epicenters are hit within 48 hours of the original pulses.

Below, in this series of screenshots.. you can first see the frequency outbreak on March 17th.. and the follow up real life storm results 24 hours later: (hail / damaging winds / possible tornado)

Notice once again, that the areas which received the RADAR pulses (HAARP rings) 24 hours earlier .. are the same areas to directly receive the worst weather in the FOLLOWING storm…

March 17, 2013 (1230am CT) — Tremont, MS / Bexar, Alabama receives a RADAR pulse / “HAARP ring”:


A different "confirmation" for AR and TN.

/18/2013 — RADAR pulse / ‘Scalar Square’ / ‘HAARP ring’ confirmation — Little Rock, AR to Nashville, TN

In this series of screenshots.. you can first see the frequency outbreak on March 17th.. and the follow up real life storm results 24 hours later: (hail / damaging winds / possible tornado)

Notice that the areas which received the RADAR pulses (HAARP rings) 24 hours earlier .. are the same areas to directly receive the worst weather in the FOLLOWING storm…


However the SPC storm reports show that the bulk of the most severe weather happened OUTSIDE of his "haarp ring" and "scalar square" "epicenters", while the LEAST severe weather occurred within those areas. The ground truth reality is exactly the OPPOSITE of what he claims.


http://www.spc.noaa.gov/climo/reports/130318_rpts.html

Another alleged "hit" from the 17th for the Springfield, MO area, where there were three reports of moderately sized hail from one storm. He conveniently ignores the high wind reports from throughout the TX panhandle, where again the most severe weather happened somewhere other than his "haarp ring epicenter".

3/17/2013 — RADAR pulse / ‘Scalar Square’ / ‘HAARP ring’ confirmation — Springfield / Nixa Missouri

Screenshots below from the PM of March 16, 2013 over Springfield/Nixa, MO — showing the “Scalar Square” return:


And the SPC storm reports for the 17th.


http://www.spc.noaa.gov/climo/reports/130317_rpts.html

All he does is look at pretty pictures of software glitches and radar anomalies and then uses labels of questionable accuracy on Intellicast for "confirmation". His "research" skills are sloppy and inaccurate to the extreme. Funny how he ignores radar anomalies that occur when there is no obvious severe weather approaching, and in turn ignores the severe weather that happens in areas where there were no previous radar anomalies.
 
Last edited by a moderator:
http://www.youtube.com/watch?feature=player_embedded&v=ly6gQ4Uvlfs

3/24/2013 — RF (radio frequency) atmospheric heating - Occurring above broadcas...

Above NEXRAD RADAR towers, and above Microwave towers (radio towers)... the airports each have a nearby radio tower which handles local broadcasts --- [see on climatviewer by turning on the FCC database.]

full post with links to past events, and link to climateviewer here

Weather radar can't measure temperature. Those "heated" spots are simply the result of surface thermometers that are reading warmer than the surrounding area. Intellicast attempts to integrate surface observations, temperatures estimated from digital elevation models, etc... with its radar display to depict precipitation type. Intellicast is likely making an error in p-type at that location because the surface report is coming in warmer than the surroundings. This is a common occurrance with the intellicast display when boundary layer conditions are right on the border for rain/snow.

Furthermore, if there is substantial heating occurring above radio transmitters, weather radars, airport radars, etc... One finds it odd that not one meteorologist, public or private, broadcast or research, has noticed.

 
Snow doesn't reflect the radar signal very well for one thing, and the display of precip type is not always accurate in a wintry mix.

The latest "pulse"/"haarp ring" vid.

http://www.youtube.com/watch?v=ktTqV_ENIYs

For this latest vid I only have time to debunk the Paducah, KY part. In this particular case the radar is just switching between Volume Coverage Patterns 32 and 21, clear air mode and precip mode respectively. This happened immediately after the radar was down for maintenance. It went down for maintenance again after switching modes for about five hours. Since clear air mode is much more sensitive than precip mode, any precipitation returns will be more intense than they are when detected in precip mode. Clear air mode is also more sensitive to non-precip returns such as bugs/birds/bats/dust and ground clutter.

The National Climatic Data Center archives all Nexrad data making it easy to retrieve details on any Nexrad station all the way back to 1995.

Here's the link to the text messages I ordered regarding the maintenance down time for the KPAH (Paducah, KY).

http://ftp3.ncdc.noaa.gov/pub/has/HAS010115539/

NOUS63 KPAH 271325
FTMPAH
Message Date: Mar 27 2013 13:25:06

KPAH WSR88D RADAR WILL BE DOWN FOR MAINTENANCE TODAY 3/27/2013 FROM 1330 UTC TIL
L 1830 UTC.


NOUS63 KLMK 272108
FTMPAH
Message Date: Mar 27 2013 21:08:44

KPAH WSR88D RADAR MAINTENANCE IS COMPLETE.

Here are the archived time stamps for data products showing the down times and mode switching, with my comments in brackets:

ZTIME,OPMODE,VCP
20130327 13:16,B,32
20130327 13:26,B,32 (last scan before maint.)
20130327 19:15,A,21 (precip mode data)
20130327 20:52,A,21 (precip mode data)
20130327 21:01,A,21 (precip mode data)
20130327 21:07,B,32 (clear mode data)
20130327 21:17,B,32 (clear mode, first full VCP after return to service msg.)
20130327 21:27,B,32
20130327 21:36,B,32
20130327 21:46,B,32
20130327 21:56,B,32
20130327 22:05,B,32
20130327 22:15,A,21 (precip mode)
20130327 22:21,A,21
20130327 22:27,A,21
20130327 22:32,A,21
20130327 22:38,A,21
20130327 22:44,A,21
20130327 22:50,A,21
20130327 22:55,B,32 (clear mode)
20130327 23:05,B,32
20130327 23:15,B,32
20130327 23:24,A,21 (precip mode)
20130327 23:30,A,21
20130327 23:36,A,21
20130327 23:42,B,32 (clear mode)
20130327 23:51,B,32
20130328 00:01,B,32
20130328 00:11,B,32
20130328 00:20,A,21 (precip mode)
20130328 00:26,A,21
20130328 00:32,A,21 (last scan before down again)
20130328 13:23,A,21 (first scan after return to service)
20130328 13:29,A,21 (back in normal operation)

Now off to enjoy this most beauteous day.
 
4 april 13.png4 april 13-1.jpg


So I wonder if super sleuth Dutchsinse will see this anomaly from the Marquette, MI radar this morning and make a post about it? We've been having issues with the radar for the past 24 hours. Our vertical channel has a component within it that has attenuated beyond tolerance and is inserting a higher amount of noise into the system than it should. This problem has been periodically affecting the quality of data coming from the system but not so much as to prevent using the radar to watch the intermittent snow and rain showers that are currently occurring. It's more of a nuisance issue than a show stopper.

So we have parts on order to hopefully fix the high noise issue, which can cause some quirky data rendering. And I believe what we are seeing here is super refraction of the LaCrosse, WI radar signal that is being received by the Marquette radar as those "beams" point directly in the direction of LaCrosse. The two radars operate at nearly identical frequencies.

But I cannot help but imagine there will be a post coming soon from him should he see this.

Also - notice the way Intellicast renders the same data versus the way College of Dupage represents it.
 
He certainly noticed the nocturnal clutter over the last few nights. High pressure sliding off the east coast with a return flow is optimal for bird migration. Here is a shot of a weather map overlayed onto a national radar mosaic. I grabbed if from a bird watching blog (link at the end of the post). Notice all the nocturnal non-precipitation returns behind the warm front up the east side of the US. Notice there are almost no such returns where the wind is out of the north.


04_07_13usmap.gif

http://www.youtube.com/watch?v=vOXjQlG0SOs

Multiple RADAR pulses / "HAARP rings" occurring out of the midwest (area forecast now to be hit with severe weather)..

Pulses started on the Night of April 5, and culminated last night (april 6 going into april 7).

Dutch's pulses are the radars detecting migrating birds. We had a storm that slowed migration on the 4th and 5th. A lot of birds crossed the gulf and settled out right on the gulf coast and Florida peninsula (documented by birdwatchers). As soon as the weather settled and we got a southerly flow and tranquil weather the birds lift off and head north. The radars light up at night under such conditions in the spring (deep southerly flow and tranquil weather). These returns are similar to the nocturnal clutter that preceded the April 2011 tornado outbreak that Dutch claims to have "predicted" by HAARP rings 24-48hrs out. It is quite common for these widespread outbreaks of nocturnal clutter to precede cold fronts in the spring and to follow cold fronts in the fall. As such they are correlated with the weather but of no predictive use. His big breakthrough video that put him on the map, where he claims to have predicted the Joplin tornado, was based on nocturnal bird clutter. In that video he said that the rind epicenters would get hit. Then as now he ignored all the rings epicenters that do not get hit and claims a successful prediction if any weather occurs anywhere near a "ring".

Of course Dutch and his believers don't understand how radar works and they don't know anything about biology so they think you are insane when you attempt to explain to them that the birds are migrating at night in numbers large enough for the radar to pick up. They don't think that the radar detects objects like that and they will call you stupid for insisting that there are that many birds aloft or that radars detect such things. They think that radars detect "frequencies" and many seem to think that they are viewing satellite imagery. As such, I've yet to figure out a good way to communicate reality to them. I always get shut down before I can even lay the basic groundwork of explaining how the radar works and why birds look like precip or basic bird biology...

http://badbirdz2.wordpress.com/

http://birdcast.info/forecast/regional-migration-forecast-5-april-12-april-2013/

https://www.metabunk.org/threads/75...s-and-Scalar-Squares-are-Often-From-the-Birds
 
Last edited by a moderator:
You think these are birds?

No. That looks nothing at all like birds on radar. What it does look like is a test pattern and it seems the nexrad data inventory archive confirms that the radar was in fact undergoing maintenance at the time. I'm sure our resident radar technician can confirm as well that it's just a test pattern.


Timestamp log below with my comments in brackets. M = Maintenance Mode. A = Precip Mode (VCP = 21)

ZTIME,OPMODE,VCP
20020815 15:12,M,0 (Radar in maint. mode)
20020815 15:13,M,0
20020815 15:14,M,0
20020815 15:15,A,21 (VCP 21 Precip. Mode - test pattern)
20020815 15:17,M,0
20020815 15:18,M,0
20020815 15:19,M,0
20020815 15:20,M,0 (Maintenance Mode)
20020815 15:50,A,21 *(VCP 21 Precip. Mode - test pattern)
20020815 15:52,M,0 (Maintenance Mode)
20020815 15:54,M,0
20020815 16:04,M,0

* matches the timestamp on the radar screencap

http://www.ncdc.noaa.gov/nexradinv/...=15&yyyy=2002&product=XBL3GSM&filter=&id=KMBX

http://www.ncdc.noaa.gov/nexradinv-...roduct=GSM&dateRange=20020815&attributes=mode

http://www.ncdc.noaa.gov/nexradinv/

http://www.docstoc.com/docs/3678758...fic-Controllers-Alfred-Moosakhanian-FAA-ATO-E

http://www.roc.noaa.gov/wsr88d/PublicDocs/NNOW/nexnow9.pdf
 
Last edited by a moderator:
No. That looks nothing at all like birds on radar. What it does look like is a test pattern and it seems the nexrad data inventory archive confirms that the radar was in fact undergoing maintenance at the time. I'm sure our resident radar technician can confirm as well that it's just a test pattern.


Timestamp log below with my comments in brackets. M = Maintenance Mode. A = Precip Mode (VCP = 21)

ZTIME,OPMODE,VCP
20020815 15:12,M,0 (Radar in maint. mode)
20020815 15:13,M,0
20020815 15:14,M,0
20020815 15:15,A,21 (VCP 21 Precip. Mode - test pattern)
20020815 15:17,M,0
20020815 15:18,M,0
20020815 15:19,M,0
20020815 15:20,M,0 (Maintenance Mode)
20020815 15:50,A,21 *(VCP 21 Precip. Mode - test pattern)
20020815 15:52,M,0 (Maintenance Mode)
20020815 15:54,M,0
20020815 16:04,M,0

* matches the timestamp on the radar screencap

http://www.ncdc.noaa.gov/nexradinv/...=15&yyyy=2002&product=XBL3GSM&filter=&id=KMBX

http://www.ncdc.noaa.gov/nexradinv-...roduct=GSM&dateRange=20020815&attributes=mode

http://www.ncdc.noaa.gov/nexradinv/

http://www.docstoc.com/docs/3678758...fic-Controllers-Alfred-Moosakhanian-FAA-ATO-E

http://www.roc.noaa.gov/wsr88d/PublicDocs/NNOW/nexnow9.pdf

As a resident of North Dakota who watches the state regularly on radar, Minot AFB radar often goes down for maintenance quite a bit. This looks to be no exception, based on what I've seen before.
 
Last edited by a moderator:

No, I think this is a WSR-88D that was suffering from an extreme amount of internal noise, which was being interpreted by the product generator as a very strong returned signal throughout the scope of the radar's coverage area. Notice how the signal increments in DBZ the further distance it is from the radar. Due to computer algorithms built into the system that I am not going to get into here, the radar is confusing this noise to be a large singular target with increasing reflectivity the further away the "target" is from the radar. It makes perfect sense to me and I have seen this happen several times with WSR-88 radars.

Every radar has internal "noise" generated by various components throughout its system. One of our jobs as technicians is to account for this noise through various calibration techniques. A noisy system can cause all sorts of anomalous returns. A bad component that has attenuated beyond tolerance can induce an unacceptable amount of noise into the system, which is what we just had happen last week.

In addition, at the completion of every volume scan, the radar runs a calibration routine, part of which involves it checking its own internal noise. It has a built in noise source. From time to time this noise source might get quirky for a volume scan or two and then it settles back down again. This could cause the occasional "bullseye" representation as we see here, typically lasting for just a single volume scan, and "flashing" on and then off again when viewed on the mosaic.

And to answer a preceding question, the test mode/maintenance mode is supposed to disable all data feeds to the world outside of the NWS - but this screenshot is from 2002 - long before my days in the NWS. It is possible back then test mode data did go out. We are constantly adding new software builds that write in and out certain functions.
 
Last edited by a moderator:
And to answer a preceding question, the test mode/maintenance mode is supposed to disable all data feeds to the world outside of the NWS - but this screenshot is from 2002 - long before my days in the NWS. It is possible back then test mode data did go out. We are constantly adding new software builds that write in and out certain functions.

Thanks for the info on noise and calibration. I thought that since it occurred in the middle of status messages tagged as maintenance mode that it was a test/calibration pattern related to some sort of maintenance. Apparently those bulls-eye patterns were addressed in upgrades implemented in 2004.

The Open Systems Radar Data Acquisition (ORDA) will
provide an initial build with functionality equivalent to that of
the legacy RDA while providing the foundation for rapid
enhancements in future builds. The controlled scope of the
initial build will enable rapid development and test, and a
deployment beginning in late calendar year 2004.
[..]
2.4 Eliminate Bulls-Eye Pattern

Radar calibration methods will be simplified by prevent-
ing the flow of base data to the RPG during the CW Substi-
tution Reflectivity Error check. This will eliminate the bulls-
eye pattern that has occurred (Albertelly, 1999) in products
when this calibration procedure is performed.
Content from External Source
(RPG = Radar Products Generator and CW = Constant Wave)

https://ams.confex.com/ams/pdfpapers/30705.pdf

More info on calibrations:

https://ams.confex.com/ams/pdfpapers/86259.pdf

Bottom line is those bulls-eye patterns are not something actually being detected in the atmosphere by the radar.

You replied before I could edit my previous post! :)

Yes - I began working for the NWS since after ORDA was implemented. In my time, entering into the System Test Software (STS) automatically severs the connection to the rest of the world when in a maintenance mode, precluding the possibility of any test signal data being sent out. Before ORDA, however, I can see how there might have been numerous examples of the bullseye pattern accidentally being sent out and upon further examination, I would guess that is what happened with this previous screenshot from 2002.

With that said however, a "noisy" system could cause exactly the same thing and if you ever seen those bullseye patterns in more recent times, chances are that is what it is. Like the one out of Nebraska not too long ago that Dutchsinse and numerous others made a big deal about.
 
you could always interpret their thinking that your radar systems are flawless and never produce technical errors/artifacts as a veiled compliment XD
 
And now he is at it again, completely disregarding the fact that the Jackson NWS office sent out an free text message stating the radar was down for maintenance and that techs had been notified just 18 minutes after these screenshots. Forecasters will not call in off duty technicians or keep them later than necessary (and chances are at that time of the day they were either headed home or about to leave - 2058 UTC is 3:58 PM CST) unless that radar was either broken or putting out unrepresentative data.

And, once again, in spite of being told numerous times by multiple people, he continues to misconstrue the meaning of RF when viewing the key on a radar velocity product. He continues to think it just means "RF" as in radio frequency when it really means range folding.

I just don't get it - when I try to explain to his followers what they are seeing, I am called a shill, a disinformant, etc. even though I have proof of my background with the weather service. Meanwhile, Dutchsinse has absolutely no background, no credibility, yet they absorb all of his posts as if they are gospel. They say they want to learn the truth, yet they disregard factual evidence from people with legitimate backgrounds in what they want to know about in favor of someone who's research is severely flawed and never takes the time to to truly investigate all possibilities before piecing together his "findings". Do they just have the need to hang onto their distrust of the government that badly?

http://sincedutch.wordpress.com/201...issippi-low-intensity-radar-pulse-haarp-ring/
 
KDGX radar in Jackson is currently down for maintenance again, meaning the techs there are probably troubleshooting and or repairing whatever caused yesterday's anomalous data and subsequent down time. But hey, there was a "pulse" and there is severe weather forecast for that area, so I am certain there will be a "confirmation" post coming from Dutch in regards to his "haarp ring forecast".....
 
http://www.youtube.com/watch?feature=player_embedded&v=-9KsKllL-SM


Michael "dutchsinse" Janitch says:

Published on Apr 17, 2013
Large RADAR pulse / HAARP ring / Scalar Square event across the south, midatlantic, and midwest .

Watch each pulsed area for severe weather within 24-72 hours.

Its a VERY large area to watch.. the biggest pulse outbreak at once that I've seen.

Explanation on what I believe is occurring here:

Reality says it is big spring bird migration ahead of the approaching front:

http://www.woodcreeper.com/

http://www.woodcreeper.com/2013/04/...-new-jersey-as-the-latest-front-marches-east/

[h=1]More birds push north from Texas to New Jersey as the latest front marches east[/h]Posted on 4/17/2013 by David La Puma
[h=2]National overview[/h]The latest frontal boundary extends from Texas to New Jersey as of last night, bringing southerly flow from Mexico’s Yucatan Peninsula all the way through the Mid-Atlantic region. Trans-Gulf migration was evident late yesterday afternoon across the Texas and Louisiana Gulf Coast, and birds could also be seen making landfall in Florida this morning as they left Cuba after sunset last night.

Dutch went on to claim on his blog:

http://sincedutch.wordpress.com/201...uare-confirmation-multiple-storms-re-develop/


Starting on the night of April 16th, moving to the late pm on April 17th, 2013 — multiple RADAR pulses / “HAARP rings” / Scalar squares appeared out of Louisiana, Mississippi, Arkansas.


Move forward two days from the original Scalar Square.. all the areas that received pulses in Texas, Oklahoma, Missouri, Louisiana, Arkansas, Illinois, and Mississippi — All received damaging winds, hail, and several tornadoes over the entire region, many of which had WARNINGS issued for the direct pulse epicenters (documented on my followup page)

The "scalar square" is Intellicast's sloppy attempt to filter out the non-precipitation returns generated by the migrating birds. The storms did not strike "pulse epicenters". The weather was spread along the entirety of the cold front.
 
Here are dutch's screencaps from 4/17 (top set) and 4/18 (bottom set)


http://sincedutch.files.wordpress.c...rmation-haarp-ring-april-18-2013-550pm-ct.jpg

Here are the storm reports for 4/17, the day of the so called "pulses" and "scalar squares". 200 total reports with 10 tornadoes.


http://www.spc.noaa.gov/climo/reports/130417_rpts.html

Here are the storm reports for 4/18, the day severe weather allegedly the "epicenters". 81 total reports (so far) with 3 brief EF0 tornado touchdowns.


http://www.spc.noaa.gov/climo/reports/130418_rpts.html

Notice there are no reports of severe weather under the so called "scalar square" in Louisiana and that the weather was not nearly as severe as it was the day before. Looks more like "haarp rings" and "scalar squares" are really a protective shield against severe weather. How ironical.
 
Last edited by a moderator:
Thank you for adding his screen caps and the subsequent storm reports.

Dutch makes a very specific claim e.g. many of which had WARNINGS issued for the direct pulse epicenters . That claim alone is obviously incorrect when storm reports you provided here or even the radar captures he uses are overlaid directly onto the previous rings/squares etc...
 
Now dutch is claiming that a segment on the show Hacking the Planet on The Weather Channel proves that microwaves can create tornadoes.

http://sincedutch.wordpress.com/201...-microwaves-experiments-prove-theory-correct/

http://www.youtube.com/watch?v=AEjVK0YTUyM

This video shows a microwave induced tornado, experiments done in the laboratory, documented on video. Aired on television in February 2013.
Content from External Source
The "experiment" shown in the video is of a laser shining up through the bottom of a column of water and slightly heating a metal plate on top of the column. The producers of the show obviously insert a graphic to represent a tornado in the column of water. At no time does the interviewer or Dr. Tepic remark about convection or rotation in the column of water, they just notice that the temp of the metal plate went up a tiny bit. However dutch is fooled by the inserted graphic and thinks they've actually created a tornado in a jar with microwaves.


Picture shows the microwave laboratory experiment producing heating causing convection
Content from External Source
Heating a plate with a laser shining through a column of water is hardly proof that microwaves can heat air in the free atmosphere. Anyone with a microwave oven can do a simple experiment to prove that microwaves can not heat air. Simply blow up a balloon, stick it in a microwave for at least a minute on the highest power setting and see if it expands. There is more water vapor in exhaled breath than there is in the atmosphere so if microwaves can heat water vapor in the air then the balloon should expand as the air inside gets hotter. If anyone performs this experiment and gets the balloon to expand I'd love to see it. AFAIK no experiment has ever heated air with microwaves.

And who is Dr. Slobodan Tepic, the one who has the idea of creating artificial tornadoes with microwaves? He's a mechanical engineer who specializes in orthopedic veterinary medicine. Atmospheric sciences and electrical engineering are not his fields of expertise.

http://www.kyon.ch/about/slobodan-tepic

http://en.wikipedia.org/wiki/Tibial_tuberosity_advancement

I respect the good doctors achievements in veterinary medicine, but he ain't no meteorologist.
 
Last edited by a moderator:
The weather channel vid says "but if the upper plate, which represents the upper atmosphere, shows an increase in temperature then there's hope for a microwave induced tornado on a larger scale".

That is a massive fundamental misunderstanding of how convective updrafts operate in the first place. If you heat the air on top then you stifle convection. Convection is a buoyancy driven process. You warm moist bouyant air at the surface and cold air aloft for vigorous convection to occur. That's why The Weather Channel had to animate the convection in the jar. The crackpot didn't even achieve that much, else he'd have been able to show his vortex with a little tracer smoke. (I'm not even going to get into the details on why wind sheer with height is needed for persistent convection and long lived tornados).

Plus, how does heating a plate at the top of a jar simulate any process in the atmosphere?

And would this be a perpetual motion machine? He wants to heat the air over the laser to create and updraft with the inflowing air spinning his turbine. Might as well turn on a fan to blow air and spin your wind turbine. Have to use energy to run the microwave. You aren't going to extract more energy from the updraft than you emitted in the first place to create it. Or does he really think he'll trigger a tornado that will then be powered by classic bouyancy driven convection and then keep that tornado in place somehow over his wind farm?

Maybe weather channel just did a poor job of explaining? That show appears to be very poorly researched.
 
HAARP low frequency waves are also capable of ground and water penetration and are used to detect - and communicate with - submarines.

The signal levels at the receiver end are only just above the threshold of electronic detection. Incidentally, HAARP does not directly generate low frequency waves. They are indirectly generated by a modulation process in the ionosphere.


I am MUCH more concerned about the possible effects of HAARP on LIFE on the planet - including humans! I know how to get in out of bad weather - how do I get away from HAARP?

You seem to be under the impression that you are being bombarded with high power radio beams. You are not. HAARP sends radio frequencies upwards and practically all the energy gets absorbed by the ionosphere. HAARP is not continuously transmitting either. It has to select the right propagation conditions for experiments to be done.
 
Must be sad to be freaked out by birds causing nocturnal clutter on weather radars.

http://www.youtube.com/watch?v=ALHnA-73-fA

Dutch says:

Late pm on April 30, 2013 -- going into early AM May 1, 2013.

Oklahoma, Texas, Kansas, Nebraska, Iowa, Louisiana --- several RADAR pulses / "HAARP rings" and Scalar Squares.

The Scalar Square effected area from last night in Louisiana, is now under a tornado warning (545pm CT May 1, 2013).

Severe weather breaking out in Oklahoma and North Texas... Damaging winds in Kansas, Nebraska, Iowa.

Bird watchers say:

http://www.woodcreeper.com/


[h=2]More MAYgration into the Great Lakes region[/h]Posted on 5/2/2013 by David La Puma
High pressure over New England and some gnarly precipitation in parts of the Southeast, Great Plains and Upper Midwest, thwarted nocturnal migration for some locales last night, but otherwise birds were on the move throughout most of the country. The heaviest returns continue to come from the Texas Gulf Coast indicating heavy Trans- and Circum-Gulf migration. Heavy migration was also apparent throughout the Midwest east of the stationary front, and along the Pacific flyway from the Desert Southwest all the way up into the Pacific Northwest. It’s clearly May, and for nocturnal migrants that means “all systems GO!” Continue reading →
[h=3]Share this:[/h]


Posted in Birds, Forecast, Migration, Migration Radar, NEXRAD Migration Study, Spring Migration 2013 | 1 Comment

[h=2]BOOM! It’s MAY!!![/h]Posted on 5/1/2013 by David La Puma
Migration was hot and heavy along the Central and Mississippi Flyways last night, while high pressure over the Mid Atlantic and Northeast kept birds down for that part of the world. A stalled front stretching from the Great Plains to the Upper Midwest marked the boundary (and fallout line) for the Central US, and migration continued across the Gulf Coast, Desert Southwest and up the Pacific Coast as well. Continue reading →
[h=3]Share this:[/h]


Posted in Birds, Forecast, Migration, Migration Radar, NEXRAD Migration Study, Spring Migration 2013 | 2 Comments

[h=2]Heavy migration finally reaches the Upper Midwest[/h]Posted on 4/30/2013 by David La Puma
With a few exceptions, migration was hot and heavy or most of the US last night. Birds continued to stream across the Gulf of Mexico and Florida Straits and make landfall throughout the US Gulf Coast. Birds also poured up through all four major flyways- the Pacific, Central, Mississippi and Eastern. High pressure over the Northeastern US as well as in the Four Corners region of the west, represented the only areas where migration was not evident on the radar last night. Continue reading →
 
Last edited by a moderator:
So Dutch says the clutter is actually NEXRAD manipulating the weather.

Funny that bird watchers use the clutter to track bird migration.

Or maybe all the ornithologists are in cohoots with the National Weather Service since he blames NWS for causing severe weather:

Here are several posts explaining the basics behind the theory of radio frequency modification of the weather, more specifically an explanation on how I believe RADAR is playing a role :

Maybe he should learn what is actually displayed on his screan from radars before he tries to formulate theories on what radar is doing to the weather.
 
Oh, and notice that the bird watchers aren't using Intellicasts heavily processed feed. They want the raw(ish) data display. Intellicast attempts to filter all the non-precip returns. The "scalar squares" that Dutch goes on about are Intellicast's computer automatically deleting non-precipitation returns from the image. Intellicast renders mosaics with layers of squares. When a square is deleted but adjacent squares in the same layer are not, you get a square hole in the display. He knows this by now. Numerous people have explained it to him in detail over the last several years.
 
any chance you know of a forum of bird trackers that we could screen shot and paste together along side the flying dutchman's crap to point out how they are talking about the same activity, however in the case of the bird watchers, pictures of actual birds come of it?

cause that would be so to the point funny id sit down and do the photoshopping.
 
So Dutch says the clutter is actually NEXRAD manipulating the weather.

Funny that bird watchers use the clutter to track bird migration.

Or maybe all the ornithologists are in cohoots with the National Weather Service since he blames NWS for causing severe weather:


Maybe he should learn what is actually displayed on his screan from radars before he tries to formulate theories on what radar is doing to the weather.

I am almost certain he DOES know...he just ignores it so he can continue on with his delusion. I could never count how many times he has been told weather radar does not "pulse" at 10 MHZ - I even sent him a screenshot of this from one of the official NWS tech manuals but I am sure he figures it was photoshopped; I cannot tell you how many times he has been told a radar can only see returned energy at or near its own operating frequency; I cannot tell you how many times he has had it explained to him about the post processing anomalies that occur within external parties software such as Intellicast; and on and on and on. He never listens. He claims to want to know the truth but dismisses any and all technical explanations as disinformation coming from "shills".

Funny how super sleuth has never (apparently) arranged for a tour of his local St. Louis weather office, or at least I have seen anything from him indicating he has. Every office does open houses from time to time and personal tours for small groups. As I stated before, I have given tours of the radar shelter with the transmitter and receiver assemblies in full view. The only off limits area is the radome and that is for safety sake and not because there is anything to hide.

I am sure he knows such tours are possible. Why not go straight to the heart of the offending parties and expose their secrets? Maybe because he knows he won't find anything there?

I don't think he actually wants the truth; I think he just doesn't want to let go. He's quite popular on YouTube and Facebook these days.....
 
any chance you know of a forum of bird trackers that we could screen shot and paste together along side the flying dutchman's crap to point out how they are talking about the same activity, however in the case of the bird watchers, pictures of actual birds come of it?

http://www.nemesisbird.com/2013/05/moderate-migration-with-some-mid-atlantic-blocking/

This website had this to say about the night of April 30 to May 1:
[h=3]Regional Overview[/h]Last night we had some good conditions for some solid migration, but the high pressure system which I thought had moved out over the Atlantic was still lingering in the Mid-Atlantic. Basically there was a dead-zone of very little movement from North Carolina up through central PA, while all around birds were streaming north everywhere else. We really need to fix this blocking so that birds get into PA for the Birding Cup this weekend!


overnight30apr1may.gif


The dead zone they refer to is the area from NC through PA where there is no clutter around the radars. the most dense clutter in SE Texas and southern Illinois corresponds to the areas dutch identified as having "rings", "scalar squares", etc...

The birds are moving at night so there aren't photos of the actual migrations except occassionally some early risers catching some late arrivals dropping out of the sky at dawn. Mostly you get birdwatchers getting out and seeing if new species have arrived.

You get some responses such as:

Jeanne Heuer says:
5/2/2013 at 1:38 pm
You were spot on for yesterday. Birders on the Wednesday birdwalk at our local sanctuary started seeing warblers. Yellow, Pine, Yellow rump and Black-throated Green. White crowned and white throated sparrows and a water thrush have also arrived. (Green By, Wi area)


Tony Nowak says:
5/2/2013 at 8:58 am
Spent about three hours birding this morning. Big numbers of YR Warbler and WT Sparrow along with good numbers of Palm Warbler and RC Kinglet. Also had Black and White, Orange-crowned, Yellow, BT Green and Nashville Warblers. FOY RB Grosbeak and Catbird as well. 51 species total for the outing. Kaukauna, WI Link to ebird checklist: http://ebird.org/ebird/view/checklist?subID=S13951537

Also if you read the full blog posts they sometimes go into a lot of detail:

http://www.woodcreeper.com/2013/05/02/more-maygration-into-the-great-lakes-region/

Something interesting to visualize is how, while the surface winds were out of the north last night, as birds appear on the radar you can see that the upper level returns (the ‘outer rings’) are heading from south to north as is expected during spring migration. This is most prevalent on the Davenport, IA and La Crosse, WI radars where the winds were strongest out of the north by sunset. This indicates how birds pushed through the headwinds to gain altitude and reach the more favorable winds aloft for migrating!
 

Attachments

  • April30.gif
    April30.gif
    30.3 KB · Views: 666
Surely dutch has noticed that this particular type of radar return is most prevalent in the spring and fall and is generally ahead of fronts in the spring and behind fronts in the fall. Surely he has noticed that this type of return occurs ONLY at night. If this return was really "frequency" being "beamed" at the sky to manipulate the weather surely he'd have to wonder why only in the spring and fall? Why only at night? If "they" are beaming frequency at the sky you don't exactly have to hide under the cover of darkness.

It doesn't seem that anybody wrapped up in the NEXRAD hoax has any idea that weather radar just detects a narrow band of waves that matches its own signal such that the vast majority of "anomalous" returns are still physical objects off of which the signal bounced (birds, bats, bugs, dust, and in the case where the signal gets bent back to the ground--cars, trucks, waves on the Chesapeake Bay, wind farms...).

Obviously biologists noticed this as there is actually a field of "radar ornithology" and "aeroecology" that use radar to track bird migration, bat movements, etc.... There are websites such as badbirdz reloaded that use the Key West and Miami radars to note the arrival of neo-tropical migrants in the spring.

You can actually track the velocity and altitude at which mexican free tailed bats disperse on their nightly foraging trips. You can do the same at daybreak for purple martin colonies. (note that the rings they produce on the radar are the circular shape of the dispersing flock with the roost as the center. This contrasts the nocturnal clutter of widespread bird migration which centers around the radar with the image being round because the radar sweep is round and the birds are dispersed throughout the scan).


http://news.sciencemag.org/sciencenow/2011/02/scientists-use-weather-radar-to-.html?ref=hp


Radars are a window into airspace. They send out radio waves that reflect off raindrops, airplanes, bats, and so forth. To predict storms, meteorologists must filter out reflections from organisms. So what Frick needs are the unfiltered raw data, which are less readily available. Until recently, researchers could typically look at information from just a few places for a few points in time.
At the meeting, Frick and her colleagues described a new Web portal, called Surveillance Of Aeroecology using weather Radar, that makes using radar data much easier for biologists. To compile weather and flood information used by forecasters around the country, the National Severe Storm Laboratory in Norman, Oklahoma, stitches together data from 156 NEXRAD radars from across the United States and overlays the filtered information on a U.S. map. Researchers can look at the big picture or zoom in to a particular locale. The data are updated every 5 minutes, and all of the information is archived.
Now the lab is making it easy for researchers to download and use not just data processed for meteorologists, but the unfiltered data as well. And in the next few years, those radars will be upgraded. The new equipment may allow biologists to tell birds, insects, and bats apart, something they can't do right now.

A final note. Flying animals are not the only source of non-precipitation returns, just a very common source.
 
I am almost certain he DOES know...he just ignores it so he can continue on with his delusion. I could never count how many times he has been told weather radar does not "pulse" at 10 MHZ - I even sent him a screenshot of this from one of the official NWS tech manuals but I am sure he figures it was photoshopped; I cannot tell you how many times he has been told a radar can only see returned energy at or near its own operating frequency; I cannot tell you how many times he has had it explained to him about the post processing anomalies that occur within external parties software such as Intellicast; and on and on and on. He never listens. He claims to want to know the truth but dismisses any and all technical explanations as disinformation coming from "shills".

Funny how super sleuth has never (apparently) arranged for a tour of his local St. Louis weather office, or at least I have seen anything from him indicating he has. Every office does open houses from time to time and personal tours for small groups. As I stated before, I have given tours of the radar shelter with the transmitter and receiver assemblies in full view. The only off limits area is the radome and that is for safety sake and not because there is anything to hide.

I am sure he knows such tours are possible. Why not go straight to the heart of the offending parties and expose their secrets? Maybe because he knows he won't find anything there?

I don't think he actually wants the truth; I think he just doesn't want to let go. He's quite popular on YouTube and Facebook these days.....

Apparently he went straight to the top. He announced on Facebook that he managed to get a gentleman named Julio (forgot his last name) to interview Dr. Louis W. Uccellini, current National Weather Service Director and former President of the American Meteorological Society.
 
http://www.youtube.com/watch?v=VPJR4MoMIA4

There are excerpts from that interview in this "documentary".

Here is a comment he posted to that video:
Wait until you hear the NWS director DENY cloud seeding is taking place.. DENY knowing about it.. saying something about the weather modification companies don't disclose where they're flying??????
LOL!!!
There is a NOAA form that must be filled out AND APPROVED BEFORE any weather modification activity takes place!!
They must disclose where, when, and what is used. And they use RADAR, Radiometers to monitor the seeding when its done... Plus use TITAN storm tracking as well ..
NWS busted


[q]
 
This comment is interesting too:

yes .. contrails.. . there ARE cloud seeding programs active.. but when you see an american airlines flying over leaving a trail..its a man made cloud made of jet fuel... technically .. i guess you could call it a chemtrail.. but that would mean its intentional..
The x's in the sky are airlines not cloud seeding
They (nasa and nws ) are USING these persistent contrails (lingering man made clouds) to conduct solar radiation management.
Have the FAA group planes where they want clouds etc..

So he has adapted to the fact that the trails are from commercial airplanes.

But he does not understand what the trails comprise.

And he thinks that NWS and NASA are deliberately getting FAA to route planes to make more clouds.
 
Apparently he went straight to the top. He announced on Facebook that he managed to get a gentleman named Julio (forgot his last name) to interview Dr. Louis W. Uccellini, current National Weather Service Director and former President of the American Meteorological Society.

Yah, I saw that, at the Tornado and Severe Weather Seminar, and Dr. Uccellini and his companion seem to dismiss the idea of covert weather modification and geo-engineering in the most professional and respectful manner they could. They almost seemed mildly irritated at the line of questioning. And, as one would expect, they are accused of lying in both the conclusion of the video and in the comments section.

A locally based meteorologist or electronics technician is still going to know a heck of a lot more about any sort of anomalous radar activity in their areas, and the explanations for it, than the director of the weather service will.
 
R3zn8d posted a link to his FB page. I followed the link. Dutch commented on R3zn8d's page:

This is the same forum that CLAIMS "HAARP rings" are BIRDS AND BUGS !!!! LOL

Well Dutchsinse, we do not claim that all rings are caused by biological targets flying through the volume scan and causing non-precipitation clutter around the radar. However, the majority of your rings in the spring and fall are migrating birds (not bugs btw, bugs are a summer phenom and are usually closer to the radar). You can go back through your own video archive and see that the rings are most common in spring and fall and are ahead of fronts in the spring and behind them in the fall and coincide with the same clutter that the bird watchers are claiming to be migrating birds.

I'm not the sole source of the claim that those rings are birds. Professional ornithologists and amateur birdwatchers both use the unfiltered data to study bird migration and to know where are the best spots to go watch birds on a given day. They actually go out an find the birds after a night of "rings" on the radar.

This is the same forum that CLAIMS we get our forecasts right by STEALING THE NATIONAL WEATHER SERVICE DATA

Kevin Martin does that with his HAARPstatus and chemtrail forecasts. Your forecast success isn't good enough to level that accusation at you.
 
R3zn8d posted a link to his FB page. I followed the link. Dutch commented on R3zn8d's page:


Well Dutchsinse, we do not claim that all rings are caused by biological targets flying through the volume scan and causing non-precipitation clutter around the radar. However, the majority of your rings in the spring and fall are migrating birds (not bugs btw, bugs are a summer phenom and are usually closer to the radar). You can go back through your own video archive and see that the rings are most common in spring and fall and are ahead of fronts in the spring and behind them in the fall and coincide with the same clutter that the bird watchers are claiming to be migrating birds.

I'm not the sole source of the claim that those rings are birds. Professional ornithologists and amateur birdwatchers both use the unfiltered data to study bird migration and to know where are the best spots to go watch birds on a given day. They actually go out an find the birds after a night of "rings" on the radar.


Kevin Martin does that with his HAARPstatus and chemtrail forecasts. Your forecast success isn't good enough to level that accusation at you.

You left out the best part of Micheal claiming Mick was some part of a mind control thing with the video game industry, but I digress. Excellent response.
 
any chance you know of a forum of bird trackers that we could screen shot and paste together along side the flying dutchman's crap to point out how they are talking about the same activity, however in the case of the bird watchers, pictures of actual birds come of it?

cause that would be so to the point funny id sit down and do the photoshopping.

Go to 4:01 mark in dutch's latest video:

http://www.youtube.com/watch?v=4U9bne0WL6o&list=FLHE92x768p8h-fMrqhsnE1Q&index=2

He is looking at the a reflectivity loop from the La Crosse Nexrad site at that point in the video. If you watch the loop you can see the targets move from SE to NW.

woodcreeper.com had this to say about the radar:

Well, the tables have turned a bit, as weather to our south has prevented significant influx of birds into the southern part of the state, while all of the previously backed-up birds are finally making it into the north. The radars do a good job of showing this with the La Crosse radar indicating heavy (25+ dBZ) migration throughout the night

http://www.woodcreeper.com/2013/05/06/birds-continue-to-push-north-across-the-u-s/

Woodcreeper also has captures of the reflectivity loop and relative velocity loops from that radar for that night. These are the same radar data that dutch is claiming to be HAARP.

http://www.woodcreeper.com/images/spring2013/wi-karx-br-20130506.gif
http://www.woodcreeper.com/images/spring2013/wi-karx-bv-20130506.gif
 
I wish I could screen cap the vids for a side by side.

One further note on Dutch's latest video is a good illustration of how the unfiltered radar data appear as rings in Intellicasts filtered data. Compare the base reflectivity from the 4:01 mark in dutch's video to the intellicast national mosaic at 4:20. It's the same date from NWS just processes differently.
 
Back
Top