Oroville Dam Spillway Failure

Status
Not open for further replies.
With so much attention being paid to the 2005 license renewal requests for armoring the emergency spillway, it seems prudent to ask, "If the primary spillway was not damaged, and running within the operational guidelines during the heavy rains leading up to the overtopping of the emergency weir, would the reservoir level have reached El.901?"

Thanks in advance for anybody here would like to undertake that opportunity.

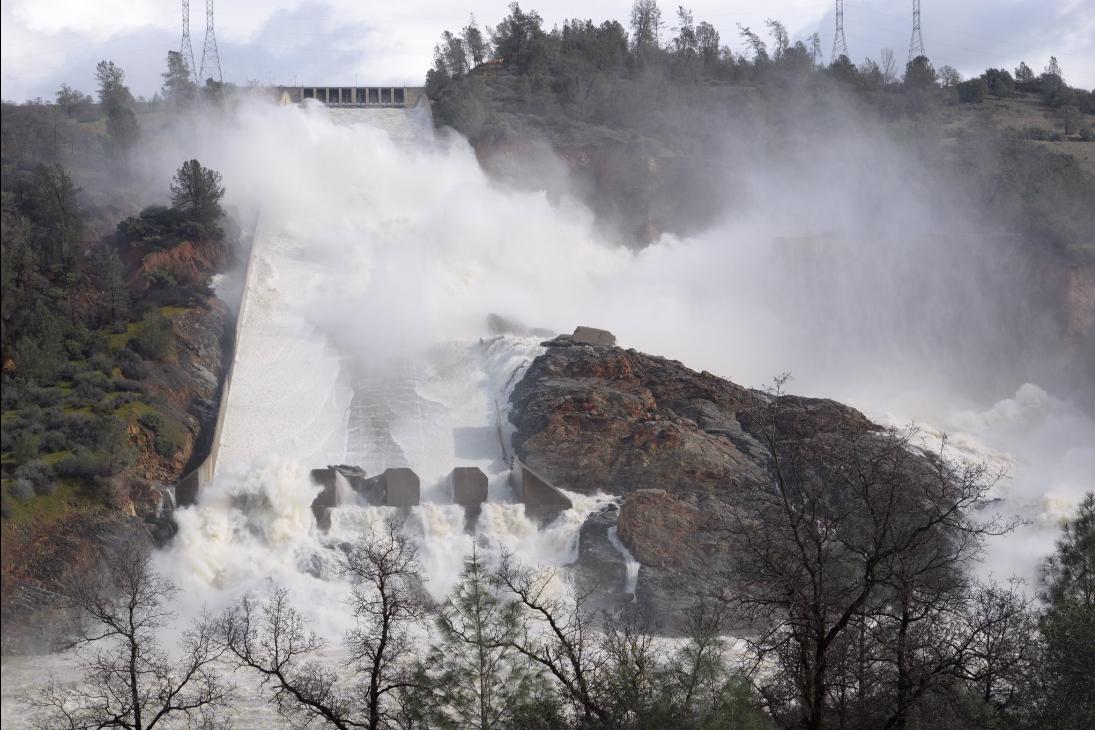
The answer is NO, even with the damaged spillway!! There is so much misinformation and misunderstanding regarding the emergency spillway. The emergency spillway is only there to protect that dam in case of an "act of god" inflow, where the concrete spillway is running at full capacity of 260,000 cfs and the reservoir is continuing to rise above 901. The concrete spillway should be designed to handle the probable maximum flood, which is a calculated inflow hydrograph based on extreme precipitation, saturated watershed and runoff coefficients. This would be routed through the reservoir to determine spillway capacity requirements. This event should be so extreme as to be unlikely to occur in nature. But of course there are "act of god" events that nobody can predict or calculate. For example back to back events without an opportunity to reduce the reservoir flood pool level back down to the rule curve. There is a "controlled spillway maximum" of 150,000 cfs which is just an administrative agreement to control downstream flood levels. The decision to reduce flow in the concrete spillway was not a good one. The operators should have been aware of the consequences of using the emergency spillway and also should have been aware of the foundation conditions along the horizontal section of the chute and the steep section at the end. They had time to start clearing trees below the emergency spillway so they should have had time to determine that there really was only one operational strategy and that was to use the main spillway to prevent the 901 being reached. They will not make that mistake again.
 
Last edited:
But of course there are "act of god" events that nobody can predict or calculate... ...They will not make that mistake again.

One would hope, Sandy. But consider that managing Lake Oroville means managing the other nine Feather River reservoirs upstream of Lake Oroville, nearly all of which are near their tops. Lake Almanor is at the top of the North Fork Feather chain and holds back over a million acre-ft of water. I would love to tell you the level of that reservoir, but the CDEC sensor went out almost two weeks ago as the water levels were nearing the max. elevation of 4495'. They have to be close to that now. Everything over 4495' edit: 4500' overtops through an ungated spillway, which has never happened.

This is a PG&E dam, not a Cal DWR one. Note the storage of all the downstream dams before Oroville. Butt Valley has 1/20th the storage and the rest less than 1% of Almanor. If Almanor overtops, is this a problem for every other reservoir downstream? I don't know, but you would think the DWR boys would say something reassuring. Or at least get the sensor fixed for all the nervous types that live in Oroville. I hope the upstream reservoirs have sound spillways, but it's difficult to find out much of anything on them.

Lake_Almanor.png

Edit: Source of diagram above here.

Relevant article:
Reservoirs feeding Lake Oroville are filled to brim as more rain rolls in
 
Last edited:
One would hope, Sandy. But consider that managing Lake Oroville means managing the other nine Feather River reservoirs upstream of Lake Oroville, nearly all of which are near their tops. Lake Almanor is at the top of the North Fork Feather chain and holds back over a million acre-ft of water. I would love to tell you the level of that reservoir, but the CDEC sensor went out almost two weeks ago as the water levels were nearing the max. elevation of 4495'. They have to be close to that now. Everything over 4495' edit: 4500' overtops through an ungated spillway, which has never happened.

This is a PG&E dam, not a Cal DWR one. Note the storage of all the downstream dams before Oroville. Butt Valley has 1/20th the storage and the rest less than 1% of Almanor. If Almanor overtops, is this a problem for every other reservoir downstream? I don't know, but you would think the DWR boys would say something reassuring. Or at least get the sensor fixed for all the nervous types that live in Oroville. I hope the upstream reservoirs have sound spillways, but it's difficult to find out much of anything on them.

Lake_Almanor.png

Edit: Source of diagram above here.

Relevant article:
Reservoirs feeding Lake Oroville are filled to brim as more rain rolls in

You might want to take a look at this sister thread https://www.metabunk.org/oroville-watershed-weather-forecast-lake-level-and-inflow-calculations.t8406/

People over there are calculating the possible inflows of the entire watershed into Lake Oroville. If I'm interpreting correctly, what is expected to come down shortly will not overflow Lake Oroville, now that they managed to lower it substantially. But the ones in the thread will be in a better position than I to give you details.
 
Question for the civil engineers - can this type of failure be modeled with open channel flow simulation software (if there is such software out there)? The objective would be to calculate dynamic and static forces on the concrete weir, all for a given range of V notch sizes/flows? Is there any way that the end of the weir could could be pushed aside, if one end were to be bypassed and a V notch formed? Or is the weir too massive to be pushed aside or pushed forward by any foreseeable flow?
Late to the game here, but dam failure modeling has been done for years using, among others, a program called DAMBRK developed by a guy in the National Weather Service. FERC provides guidelines for breach parameters (the size of the failure) based on various types of construction. My copy dates back to 1988; at that time we modeled the failure of two monoliths occurring in 0.1 hr to 0.3 hr. A monolith would be the section between two vertical construction joints.

http://amazon.nws.noaa.gov/articles...01-150/149_DAMBRK_THE_NWS_DAM-BREAK_FLOOD.pdf
 
Last edited by a moderator:
I have very similar looking debris islands in the field behind my house. There's a seasonal creek that runs down the hill that's run about ten times as much as normal and is grinding through the hill. . It has created very similar looking flat topped "islands" of essentially coarse grained sand and mud where the water reaches a flatter area and slows down. Scaling that up I'd expect these "islands" to consist mostly of medium sized stones under a foot in diameter.

I'd take a photo, but it's raining here :)

It stopped raining (it was incredibly heavy last night)
20170221-081329-ycwee.jpg

So those are my versions of the debris piles in the pool. This area was just grass before the rains, now those pile are about a foot deep. They are pretty soft and muddy:
20170221-081619-6u5fv.jpg

And they have a range of small stones of the local variety, under 2" in size.
20170221-081711-krye8.jpg

I'm posting this to help people understand what the debris piles are in Oroville. Like this, but with bigger rocks.
 
The emergency spillway is only there to protect that dam in case of an "act of god" inflow, where the concrete spillway is running at full capacity of 260,000 cfs and the reservoir is continuing to rise above 901. The concrete spillway should be designed to handle the probable maximum flood, which is a calculated inflow hydrograph based on extreme precipitation, saturated watershed and runoff coefficients. This would be routed through the reservoir to determine spillway capacity requirements. This event should be so extreme as to be unlikely. But of course there are "act of god" events that nobody can predict or calculate.

No. Dams in the US, at least where I've worked, are designed to handle the PMF. Depending on the state, smaller dams can get away with less than the PMF in many cases. Oroville's emergency spillway was specifically designed to handle the PMF, as it should be. See:

Oroville Watershed Weather Forecast, Lake Level and Inflow Calculations

and for verification:

http://www.graffiotech.com/2017/02/15/oroville-dam-spillway-evacuations-reduced-residents-being/

The dam began overflowing into a spillway over the weekend, and officials spotted possible weak spots in the spillway, prompting the massive evacuation order. "The emergency spillway meets FERC's engineering guidelines for an emergency spillway". The spillway eroded to the point where it partially collapsed, leaving officials unable to drain Lake Oroville fast enough on Tuesday. Rather than investigating themselves, each official rebuked the warnings, leading to the potential catastrophe it is today. FERC's attorneys noted: "The emergency spillway was created to safely convey the Probable Maximum Flood, and DWR has reviewed and confirmed the efficacy of the PMF hydrologic analysis for Oroville Reservoir".
Content from External Source
Dams are not designed to handle more than a PMF, since by definition, that is the maximum flood. PMFs evolve over time, however, as our understanding develops, but there is a relatively accepted science to develop them. Technically, we fool ourselves a bit, however - say if Earth went into another ice age and caused another Missoula Flood,

https://en.wikipedia.org/wiki/Missoula_Floods

During the last deglaciation that followed the end of the Last Glacial Maximum, geologists estimate that a cycle of flooding and reformation of the lake lasted an average of 55 years and that the floods occurred several times over the 2,000-year period between 15,000 and 13,000 years ago. U.S. Geological Survey hydrologist Jim O'Connor and Spanish Center of Environmental Studies scientist Gerard Benito have found evidence of at least twenty-five massive floods, the largest discharging ≈10 cubic kilometers per hour (2.7 million m³/s, 13 times the Amazon River).[2] Alternate estimates for the peak flow rate of the largest flood include 17 cubic kilometers per hour[3] and range up to 60 cubic kilometers per hour.[4] The maximum flow speed approached 36 meters/second (130 km/h or 80 mph).[
Content from External Source
a lot of dams in four states would fail. Perhaps that's what you mean by an "act of God." So we ignore stuff like that, and the US Government publishes PMP (Probable Maximum Precipitation) for the US that people use to develop PMFs.

The decision to reduce flow in the concrete spillway was not a good one. The operators should have been aware of the consequences of using the emergency spillway and also should have been aware of the foundation conditions along the horizontal section of the chute and the steep section at the end. They had time to start clearing trees below the emergency spillway so they should have had time to determine that there really was only one operational strategy and that was to use the main spillway to prevent the 901 being reached. They will not make that mistake again.

In retrospect, yes. The well-publicized environmental group request that the emergency spillway be beefed up as part of the FERC relicensing was also valid in hindsight.[/U]
 
You might want to take a look at this sister thread https://www.metabunk.org/oroville-watershed-weather-forecast-lake-level-and-inflow-calculations.t8406/

People over there are calculating the possible inflows of the entire watershed into Lake Oroville. If I'm interpreting correctly, what is expected to come down shortly will not overflow Lake Oroville, now that they managed to lower it substantially. But the ones in the thread will be in a better position than I to give you details.

The models/forecasts of expected inflows are based on the upstream plumbing being managed/operating 'normally', so one would think that - as you stated - the Oroville levels shouldn't be a problem in the next few days. The forecasting thread is interesting in its own right, but isn't the whole story. A large part of that forecast rain is going into upstream reservoirs, so their levels are critical to understanding what will eventually happen at Oroville. Even if the effects on Oroville are not significant, the spilling of Lake Almanor will be catastrophic to hundreds (thousands?) of people immediately downstream. The river is mostly dry up there - nearly all the water is diverted through pipes downstream to power generation. Can PG&E keep it from spilling as they have in the past? Will people get more than an hour notice to evacuate up there if PG&E can't?

The risk should be easy enough to check quickly by sensors (paid for by the public and public utility customers) that let us confirm 'normal' operation of the system upstream. That's hard to do when the reservoirs managed by PG&E suddenly stopped reporting to the California Data Exchange Center on Feb. 10th. Buck's Lake and Mountain Meadows are relatively small reservoirs, but Lake Almanor is pretty significant. Why would PG&E allow those sensors to go black for so long (and at this point in time) considering that they provide information critical to a quarter million people's health and welfare?
 
The operators should have been aware of the consequences of using the emergency spillway and also should have been aware of the foundation conditions along the horizontal section of the chute and the steep section at the end.

I think it is important to remind ourselves that at the time this dam was designed cigarettes were good for you, cars did not contain seat belts, the dash was made of stamped sheet metal, the steering column had no padding or collapse mechanism to prevent it spearing the driver's chest, and getting inebriated and going for a fun, high speed, twisty ride, was a relatively common event.

Times change. The Oroville structures were built with the best knowledge of the time and followed what were then understood to be best engineering practices. The general body of knowledge has significantly increased since the design period and engineering practices are greatly advanced today.

This is not intended as a critique of the poster. Those of us who were around in the 1960's (and who retain any memory of that period) will quickly testify that it was a very different world. I think we should be careful about making retroactive knowledge claims and imposing a contemporary knowledge standard on the operating and design personnel of the 1960's.
 
California Department of Water Resources placed sandbags along a inside wall at the Edward Hyatt powerplant to manage possible water seeping due to the debris backup in the diversion pool from the damage Oroville Dam spillway. The powerplant is located underground at the left abutment near the axis of Oroville Dam in Butte County. Photo taken February 16, 2017.

http://pixel-ca-dwr.photoshelter.co...4/KG-oro-spillway-damage-12406-02-16-2017-jpg

KG_oro_spillway_damage-12406_02_16_2017.jpg
6 new photos posted http://pixel-ca-dwr.photoshelter.co...yfg/G00003YCcmDTx48Y/Oroville-Spillway-Damage
 
I think it is important to remind ourselves that at the time this dam was designed cigarettes were good for you, cars did not contain seat belts, the dash was made of stamped sheet metal, the steering column had no padding or collapse mechanism to prevent it spearing the driver's chest, and getting inebriated and going for a fun, high speed, twisty ride, was a relatively common event.

Times change. The Oroville structures were built with the best knowledge of the time and followed what were then understood to be best engineering practices. The general body of knowledge has significantly increased since the design period and engineering practices are greatly advanced today.

This is not intended as a critique of the poster. Those of us who were around in the 1960's (and who retain any memory of that period) will quickly testify that it was a very different world. I think we should be careful about making retroactive knowledge claims and imposing a contemporary knowledge standard on the operating and design personnel of the 1960's.

I think that was the point Sandy was trying to make, DWR shouldn't have trusted 60 year old engineering standards and expected the emergency spillway to act as designed.
 
New here, found this forum trying to make sense of this dam disaster, it's history and construction before the collapse. Tired of the armchair 'experts' on YouTube and repeat shared, copied, fake reports/videos. Awesome info and photos here and have suggested this as a go to for updates. Kudos to all!!!
 
I have not seen mention here yet of two minor earthquakes that appear to have occurred near the spillway and pool in the early morning hours of 2/14/17. Time is in UTC, so it would have been 2:39am and 2:56am local time. I have heard conflicting rumors about their cause, one being a quarry blast which actually occurred on 2/8/17 and so I have also included that to show that it was a different event.

Screenshot source:http://earthquake.usgs.gov/earthquakes/map/#{"autoUpdate":[],"basemap":"grayscale","feed":"1487700994618","listFormat":"default","mapposition":[[39.12579898118161,-121.937255859375],[40.204050425113294,-120.948486328125]],"overlays":["plates"],"restrictListToMap":["restrictListToMap"],"search":{"id":"1487700994618","name":"Search Results","isSearch":true,"params":{"starttime":"2017-01-22 00:00:00","endtime":"2017-02-21 23:59:59","maxlatitude":40.012,"minlatitude":39.259,"maxlongitude":-120.861,"minlongitude":-121.882,"minmagnitude":0.01,"orderby":"time"}},"sort":"newest","timezone":"utc","viewModes":["map"],"event":null}


I assume these quakes were due to induced seismicity, as discussed here:

Engineers building the Oroville dam wanted to know if such induced seismicity would occur behind their dam as well, and thus they built seismic station ORV. The reservoir was first filled to capacity in July 1969 - and nothing happened for almost six years. The seismic sensors did not record any uptick in seismic activity around Lake Oroville. That changed suddenly on June 28, 1975, when a magnitude 3.5 quake occurred south of the lake. During the month of July, it was followed by almost 20 minor shocks in the same region, until a magnitude 4.7 quake hit on August 1. It was followed in turn by a magnitude 5.7 quake, which was felt in large parts of northern California and even in Carson City, Nevada. The quake caused light damage to buildings in the city of Oroville, but left the dam untouched. After another month or so the earthquake swarm subsided.
Content from External Source
http://seismo.berkeley.edu/blog/2017/02/16/oroville-dam-makes-its-own-earthquakes.html

[Giant screenshots removed, see attachments]
 

Attachments

  • Screenshot_2017-02-21-10-16-55.png
    Screenshot_2017-02-21-10-16-55.png
    309.3 KB · Views: 381
  • Screenshot_2017-02-21-10-17-21.png
    Screenshot_2017-02-21-10-17-21.png
    336.4 KB · Views: 416
  • Screenshot_2017-02-21-10-17-25.png
    Screenshot_2017-02-21-10-17-25.png
    334.5 KB · Views: 418
  • Screenshot_2017-02-21-10-17-36.png
    Screenshot_2017-02-21-10-17-36.png
    295 KB · Views: 409
Last edited by a moderator:
Even if the effects on Oroville are not significant, the spilling of Lake Almanor will be catastrophic to hundreds (thousands?) of people immediately downstream. The river is mostly dry up there - nearly all the water is diverted through pipes downstream to power generation. Can PG&E keep it from spilling as they have in the past? Will people get more than an hour notice to evacuate up there if PG&E can't?

The catchment area of Almanor is about 15% of the total Oroville catchment, or 17% of Oroville excluding Almanor.
20170221-101052-eno7i.jpg

Yet the surface area is 44 sq miles vs 25 sq miles for oroville. So for the same rainfall you'll get a much lower rise, like 1/10th the rise (17%*25/44) - assuming they were not letting any water out.

From Feb 7 to Feb 10, Oroville went up 36 feet. Almanor went up 2 feet to 4491.71. The spillway is at 4,500 ft, so it's got another 8 feet. So from this simplistic analysis Oroville will overtop long before Almanor does.

http://www.waterboards.ca.gov/water...upper_feather_ferc2105/eir2014nov/unffr_3.pdf
Lake Almanor is the upstream-most reservoir on the North Fork Feather River within the UNFFR Project boundary and has the largest usable storage capacity (1,134,016 AF). The maximum water surface area is 27,000 acres, and the maximum normal water surface elevation is 4,494 feet (PG&E elevation datum). Lake Almanor is impounded by Canyon dam, an earth-filled structure that is 135 feet high by 1,400 feet wide at its base and 1,250 feet long across its crest. Canyon dam has an outlet tower with multiple outlets that deliver water to a tunnel capable of releasing up to 2,100 cubic feet per second (cfs) to the North Fork Feather River (Seneca reach) directly below the dam. In addition to the outlet structure, the dam has a concrete overflow spillway at an elevation of 4,500 feet (PG&E elevation datum). Water is also diverted from Lake Almanor through the Prattville intake, which conveys flow through the 10,899-footlong Prattville tunnel No. 1A and the 5,568-foot-long Butt Valley penstock to the Butt Valley powerhouse. The combined operation of these intake structures allows PG&E to maintain the water surface elevations for Lake Almanor under the current license. In addition to providing the required flow releases to the Seneca reach of the North Fork Feather River, water can be released from the Canyon dam outlet tower in very wet years to control the level of Lake Almanor in order to avoid use of the spillway.
Content from External Source
I don't know if an overtopping of the Almanor spillway is itself a huge problem, due to the relatively low inflow. There's only a few dwellings on the ravine. Providing the spillway is sound, of course.
 
Last edited:

The new photos (taken yesterday) mainly show DWR staff and Conservation Corps members manually spreading what is described as "road base material" along the left (kayaker's right) side of the main spillway structure:

RoadBase.jpg

Another photo shows a backhoe already in place but I am not sure exactly where on the slope or indeed from where it would have got access:

RoadBase2.jpg

I assume this means that preparations are under way to get machinery access to the damaged part of the spillway. If this marks the start of the repair stage it can be anticipated that at some point in the near future there will be more information about the cause(s) of its failure and what will be done to restore something like normal operation.
 
I think it is important to remind ourselves that at the time this dam was designed cigarettes were good for you, cars did not contain seat belts, the dash was made of stamped sheet metal, the steering column had no padding or collapse mechanism to prevent it spearing the driver's chest, and getting inebriated and going for a fun, high speed, twisty ride, was a relatively common event.

Times change. The Oroville structures were built with the best knowledge of the time and followed what were then understood to be best engineering practices. The general body of knowledge has significantly increased since the design period and engineering practices are greatly advanced today.

This is not intended as a critique of the poster. Those of us who were around in the 1960's (and who retain any memory of that period) will quickly testify that it was a very different world. I think we should be careful about making retroactive knowledge claims and imposing a contemporary knowledge standard on the operating and design personnel of the 1960's.[/QU

Agree
 
They had time to start clearing trees below the emergency spillway so they should have had time to determine that there really was only one operational strategy and that was to use the main spillway to prevent the 901 being reached. They will not make that mistake again.
The reason that they are working night and day on the emergency spillway is so that it is usable, if needs be. It is always easier to see outcomes after the fact. I would not assume that trying to use a fraction of the design capacity of the emergency spillway in that situation was a mistake nor do I presume myself competent to make that judgement.
 
Moderator Note - deirdre
Please do not copy LONG comments in your replies, by simply hitting the 'reply' button on the right lower corner. This thread is long enough without unnecessary repeat posting of comments.

Simply highlight the specific portion of a post that you are replying to. and use the 'pop-up reply' link. If readers want to see the whole replied to post they can access it with the arrow button next to the original commenters name.

7-28-2016 12-07-25 PMa.png

https://www.metabunk.org/how-to-reply-with-and-without-quoting-other-posts.t2561/

Thank you.
 
There's now a chunk of concrete on the rock to the right of the spillway.

That was there Feb 18th
20170221-115901-oz022.jpg

It appears to be a bit of the nearby sidewall. Not moved too far:
20170221-120756-l606j.jpg

It's indicative of the downward erosion. Really just breaking off the few last pieces of the spillway that are not anchored to that large bottom rock area.

The channel is going to be very interesting to look at when they switch off the water.
 
Last edited:
Hello, newbie here. Name is Jack.

The Lake Oroville Webcam is still operational. The Webcam is a service of the Parks. It streams live footage from within the dam. The camera is mounted on a tower on or by the reservoir. The shot points toward the dam wall. The camera automatically pans and zooms. Occasionally, it goes wonky--this is either because someone in the tower moved it, or it may have been moved remotely by a Parks person. Otherwise, it sticks to its pan and zoom schedule. The cam is open for anyone with an internet connection to see.

In the past few days after the primary spillway break, the top of a water plume or geyser was visible over the dam wall. I think, but I'm not sure, that that water spout originated around the spot of the primary spillway break.

However, today, I see TWO and perhaps THREE plumes. Two are partially obscured by a tree; the third plume is to their right. They're clearly plumes and moving. I viewed this less than twenty minutes ago.

You can go check. I'm not sure why there would be three plumes? Thought I would ask you experts. Cheers.

Lake Oroville Webcam
https://www.parks.ca.gov/?page_id=29411
 
The new photos (taken yesterday) mainly show DWR staff and Conservation Corps members manually spreading what is described as "road base material" along the left (kayaker's right) side of the main spillway structure:

I wonder what the orange R numbers (I see R10, R9 and what looks like R8 heading upstream) are for. It looks like they are fresh and painted about 25 feet apart (based on the workers being 5-6' tall and the poles for the fence being ~5' apart).
Given how close they are to the top, it seems that it would be more efficient to bring in a gravel slinger truck and drop a pile of "road base material" near the top, then work downhill from there. That might not work with truck traffic on the bridge though.

Aaron Z
 
Two are partially obscured by a tree; the third plume is to their right. They're clearly plumes and moving. I viewed this less than twenty minutes ago.
next time take screen shots.

this is what i see. plume to right, and es that is water spray behind tree but i havent seen 3 yet
2-21-2017 3-33-30 PM.png
edit time add
kk.png
 
This is an amazing site with an astounding amount of information.

From a system engineering perspective, and for the people who live downstream from all this water, the most important question is how well is the end to end system of reservoirs, spillways, levees, and control systems serving to minimize downstream flood damage.
Does anyone have an overall view since some reservoirs are owned by the state and some are owned by the federal government? I'm guessing DWR would have responsibility.
 
next time take screen shots.

this is what i see. plume to right, and es that is water spray behind tree but i havent seen 3 yet
2-21-2017 3-33-30 PM.png

I actually captured some video from my screen before I initially posted. If you're interested I can try uploading it. But right now the live cam shows what I saw. If you go to the live cam, you will see the plumes moving.

Edited screenshot below. I've circled the plumes I think I'm seeing.

 
It's basically next to the lower transmission tower
20170221-125636-vh0i6.jpg

[EDIT] HAD THE WRONG TOWER

I'm calculating the Webcam as being on Kelly Ridge, or thereabouts.
20170221-130230-dc8d8.jpg
 
Last edited:
So it appears to be a bit above the damage line, so one of:
  1. It's just the spray from the waterfall being blown around
  2. The waterfall has moved back up the hill
  3. Something else.
I'm calculating the Webcam as being on Kelly Ridge, or thereabouts.

Not much in the way of wind right now. Correct, the webcam is on top of the visitor center tower in Kelly Ridge.
 
I am a geologic dweeb. Marine and aeronautical charts are not a problem. But when it comes to looking at rock maps, I am a total fish out of water. In trying to understand the geology of the site I have gone back through the thread looking for relevant information.

This image is from a post by Rock Whisperer to be found here:
https://www.metabunk.org/oroville-dam-spillway-failure.t8381/page-29#post-201541

RAVINE FAULT v02 21-02-2017 2-13-55 PM.jpg

Rock Whisperer added the purple circle. This circle is centered on the erosion slope below the auxiliary spillway.
There is much critical information in this image. To make that information visible I turned the image on its side and shaded the Flood Control Spillway with grey.

RAVINE-BASE-AND-FCS-2017-2-22-20-PM.jpg

Next, I highlighted the geological symbols of interest. The purple circle is centered on a symbol I did not understand. The base of the symbol aligns with a known seam or fault line in the rock. The extension at the middle of the base line extends in the direction of a down dip. This means that the plane of the faulted rock extends down below the adjacent rock (see the Wikipedia link at the bottom of this post). In this case the fault extends down and toward the Flood Control Structure. I lack the knowledge to make any further interpretation. At the 2 o'clock position on the periphery of the purple circle is another geologic symbol. This has a triangle extending from its base. I cannot locate the meaning of this symbol.

The last image enhances the imprinted text. I do not know enough to understand the relationship between the change in color between the two zones and the symbols.


RAVINE-ALL-2017-2-22-20-PM.jpg


I don't wish to be an alarmist. The fact that this information is already known and contained in the rock maps is a good sign. As Mark Twain said: "It ain't what you don't know that gets you into trouble. It's what you know for sure that just ain't so."

Additional Reading

This post contains an excellent explanation of the rock in the area of the spillway:
https://www.metabunk.org/oroville-dam-spillway-failure.t8381/page-10#post-200216

The gabbro in the area is a strong rock. When the spillway was excavated they would have cut down to expose the gabbro which would have appeared to be fully competent (meaning that the rock had structural integrity). But this kind of rock will weather and becomes relatively soft and incompetent with years of weathering. See Rock Whisperer's post for his much better explanation.

https://www.metabunk.org/oroville-dam-spillway-failure.t8381/page-16#post-200547
Gives a more in depth analysis of the geology.

An explanation of Strike and dip on Wikipedia:
https://en.wikipedia.org/wiki/Strike_and_dip
 
I had the identified the wrong towers in my earlier post. The line through the tower to the spray is:

20170221-132118-ayhqz.jpg

20170221-131831-ywyvg.jpg

So you are just seeing spray from the initial drop, then more spray where it bounces off the big rock lower.
 
what I saw. If you go to the live cam, you will see the plumes moving
found footage from 2 days ago and i think the issue is wind... the plume in the tree (bottom of spillway probably) is harder to spot and looks like its blowing to the right and more spread out. or the tree is blocking it.. dont want to watch 4 hrs of footage :)

but yea the top spot you circled is the river in the background.

x.JPG wind.JPG
 
I had the identified the wrong towers in my earlier post. The line through the tower to the spray is:

20170221-132118-ayhqz.jpg

20170221-131831-ywyvg.jpg

So you are just seeing spray from the initial drop, then more spray where it bounces off the big rock lower.

Well I guess at the very least a live shot of the plume at the main spillway gash is interesting. :)

I'll look at the footage I recorded. If it feels like I may have possible riposte/rebuttal, I'll upload and post it later. Cheers.
 
Sorry, this is my last post on Almanor - I realize this is only marginally on topic.

The catchment area of Almanor is about 15% of the total Oroville catchment, or 17% of Oroville excluding Almanor.

But the maximum regulated outflow from Almanor through the Prattville Intake/Butt Valley Reservour at 2,118 cfs if I'm reading PG&E's document right. The other outlet is described as "...and through the multi-level outlet structure at Canyon dam, which releases flows into the Seneca reach of the North Fork Feather River..." That seems pretty small and capable of a hundred or so cfs, but I can't find its actual capacity.

From Feb 7 to Feb 10, Oroville went up 36 feet. Almanor went up 2 feet to 4491.71. The spillway is at 4,500 ft, so it's got another 8 feet. So from this simplistic analysis Oroville will overtop long before Almanor does.

That's if Almanor could release the equivalent of 15% of Oroville's 100K cfs releases, ~15K cfs. At just over 2K+ cfs since Feb. 10th, it has (probably?) never dropped. If Almanor is at, say, 4497', then there is still plenty of storage - I don't mean to exaggerate the potential problem. If Almanor is at 4499' right now, then will they be able to dump enough through Butt Valley and the 'multi-level outlet structure' before the rains next week?

Noting we can do about it and it may not ever affect the operation of Oroville, but there's a small chance that it may, especially since Almanor spilling could overwhelm the chain of much smaller reservoirs downstream. Almanor spilling would only be in the thousands (vs. tens of thousands) of cfs. I'm just less inclined to trust a utility like PG&E (vs. DWR) when they say "Trust us... there is nothing to worry about."

In their 2002 FERC re-licensing application (as stated in your Draft Environmental Impact Report link):

3. Operate and maintain the existing gages to determine river stage and minimum streamflow below Canyon dam at the NF-2 stream gage (United States Geological Survey (USGS) gage No. 11399500) and Belden forebay dam at the NF-70 stream gage (USGS gage No.11401112) under the supervision of the USGS.
Content from External Source
Too bad that didn't include "...and tell the public what it says".
21. Take such reasonable actions as may be prudent to prevent the water surface elevation in Lake Almanor from exceeding an elevation of 4,494.0 feet unless a higher level is approved by FERC and DWR’s Division of Safety of Dams.
Content from External Source
So did they go silent just because of the bureaucracy involved with exceeding 4,494' - which they must be close to or over now? People can understand that PG&E has no control over the weather, but people get kind of cranky about 1-hour evacuation notices.
 
Last edited:
Status
Not open for further replies.
Back
Top