Mendel
Senior Member.
Claim
Source: https://youtu.be/3yCFFLrr14Q


Learmonth Radar (currently offline)
http://www.bom.gov.au/products/IDR293.shtml
Serpentine Radar (near Perth)
http://www.bom.gov.au/products/IDR70D.shtml
Explanation
From the same page:
Source: https://youtu.be/3yCFFLrr14Q
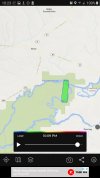
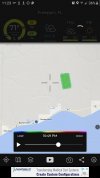
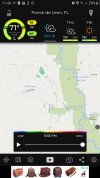
The radar images in the video come from the Australian Bureau of Meterology.[1:40] If radio waves and radar haven't got any effect, pretty coincidental these two different areas in Western Australia pushing the clouds out or stopping them from coming in, whichever way it goes.
Learmonth Radar (currently offline)
http://www.bom.gov.au/products/IDR293.shtml
Serpentine Radar (near Perth)
http://www.bom.gov.au/products/IDR70D.shtml
Explanation
http://www.bom.gov.au/australia/radar/info/wa_info.shtml#broome1Meteorological Aspects
On the 27th of October 2008 the Bureau installed a C-Band radar at Broome airport, replacing the existing WF 44 radar. The introduction of this new more sensitive radar has led to a number of occasions where "false" or anomalous echoes have been displayed.
This is not caused by a malfunction in the radar, but rather is a result in the increased sensitivity of the radar.
Radar works by sending pulses of electromagnetic energy (in the form of waves), which are then reflected back to the radar by objects in the path of the wave. The radar beam follows a slightly curved path and goes progressively higher the further away from the radar it travels, until it hits an object in its path usually rain droplets.
In the Broome area it is quite common for strong temperature inversions to occur, which means the temperature actually increases with height over a small distance in the atmosphere instead of steadily decreasing with height. There are a number of reasons why inversions can happen, and in the Broome area, one of the most common examples is when hot air from the inland moves out over the cooler ocean. This leads to marked temperature inversions close to the surface, and the effect of this inversion is to "trap" the radar beam in the layer of air between the cool ocean and the hot air a couple of hundred metres above it. Because of the change in the refractive index between hot and cool air, the radar beam is "bent" back towards the waters surface. When the beam strikes the water it reflects its energy back to the radar and it is that image which is displayed on the radar picture.
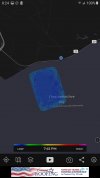
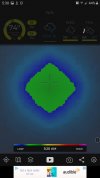
In certain circumstances the inversion can be strong enough such that displays similar to the one below occur.
This phenomenon is the price to be paid for increased sensitivity which means that rainfall and thunderstorms are much better depicted by the radar. With practice it is quite easy to recognise the difference between real and anomalous echoes.
From the same page:
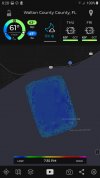
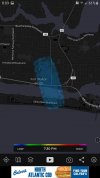
In January, Australia (especially Western Australia) was hot and dry, remember the bush fires? That's another indication that these "clouds" weren't really there.Perth (Serpentine) Weather Watch radar has good coverage in all directions. Intense thunderstorm or cold fronts can be seen up to 250 kilometres away, however at this distance the radar is sensing the structure of the system well above the ground and may give a misleading view of the actual surface rainfall intensity of the system. The radar is susceptible to anomalous propagation (AP) for distances up to 60 kilometres along the coastline and seaward of it. The AP appears as an area of low intensity echoes. A local phenomenon which has been observed occasionally is that of false mirror echoes approaching the radar from the southeast as an intense cold front approaches from the south west.Heavy rain directly over the radar site can cause attenuation of all signals. Path attenuation can also occur when the radar beam passes through intense rainfall, with the returned signals from cells further along that path reduced.
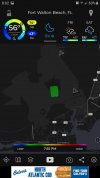
Note that there was no rainfall observed on and around the 8th, and cloud cover was 0/8 to 1/8 only.

http://www.bom.gov.au/climate/dwo/202001/html/IDCJDW6111.202001.shtml
Observe that the West coast was dry the whole month.

http://www.bom.gov.au/climate/current/month/aus/archive/202001.summary.shtml
I didn't look for a satellite image, but the times are logged on the images in the screenshot from the video, so it'd be easy to check if you have access to an archive.
http://www.bom.gov.au/climate/dwo/202001/html/IDCJDW6111.202001.shtml
Observe that the West coast was dry the whole month.
http://www.bom.gov.au/climate/current/month/aus/archive/202001.summary.shtml
I didn't look for a satellite image, but the times are logged on the images in the screenshot from the video, so it'd be easy to check if you have access to an archive.
Last edited: