
The Carbon Monoxide overlay on earth.nullschoool.net appears to show a sudden spike in CO levels over most of California on 2/26/2016. There's a large area shown at off-the-scale levels.
The previous day looked like:
i.e. basically none. So what's going on here? Was there a huge spike in CO? I'm right in the middle of that black area, I did not notice anything on Feb 25th (last Thursday).
It turns out it was just a glitch in the data. Here's NASA's statement:
http://gmao.gsfc.nasa.gov/news/geos_system_news/2016/incorrect_CO_concentrations.php
The important thing to realize here is that the earth.nullschool.net display is not actually showing real measurements of carbon monoxide. It's a computer model, basically an estimate or forecast of what carbon monoxide is likely to be, give a variety of input data. In this case there was incorrect input data about fires in California, and this led the system to predict high CO levels, which were then later rendered as a graphical CO forecast.External Quote:
March 1, 2016
IMPORTANT NOTICE: Elevated carbon monoxide concentrations over California in the GEOS-5 products since February 25, 2016, are incorrect. They are a consequence of unrealistic CO emissions computed by our biomass-burning algorithm, which is based on satellite observations of fires. Several data points over California were incorrect and these led to unrealistically high emissions of CO, causing the elevated atmospheric CO concentrations.
GMAO is working to correct this problem.
The glitch happened on Feb 26th. The other thing that happened around then is on Feb 25th when the Terra satellite came back on line after being in "safe mode" for a few weeks. Terra is responsible for the "Fires and Thermal Anomalies" part of the equation. Here's the Feb 24 input:
(i.e. no data at all)
And here's Feb 25th:
So basically the input data went from zero fires worldwide, to lots of fires. The forecasting algorithm was unable to handle this, and it resulted in the odd spikes over California and other areas in the next day's CO forecast. As new data came in, things settled down to normal.
Of course the actual "ground truth" of this was the levels of CO on the ground on 2/26. The faulty data shows levels of over 30,000 ppb in the California Central Valley:
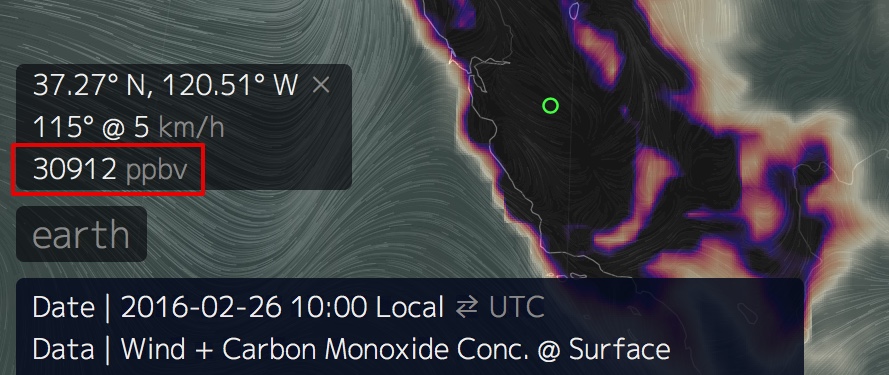
30,000 ppb (parts per billion) is 30 parts per million. (30 ppm)
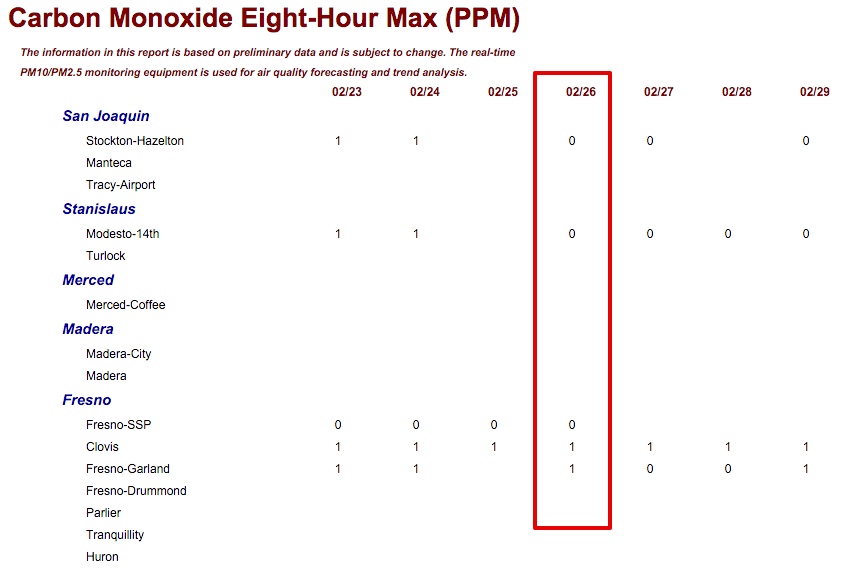
But actual ground level monitoring stations showed 1 ppm or lower. And there was no increase from the previous day.
http://www.valleyair.org/aqinfo/d-CO.htm (Archived: http://archive.is/nUAvw)
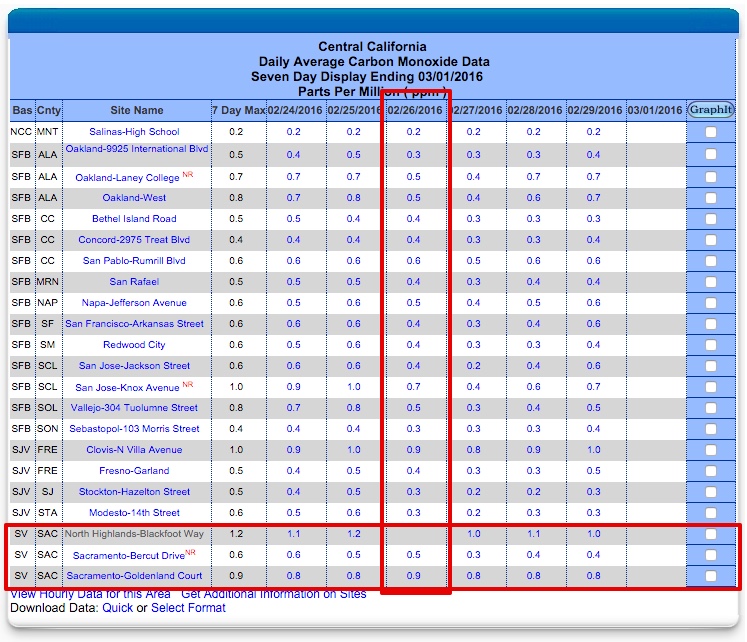
There are multiple reading here: http://www.arb.ca.gov/aqmis2/aqdselect.php
In Sacramento, near where I live, the story is the same, normal levels, of under 1 ppm (http://archive.is/LqPqo ) with no spike on 2/26
Last edited:
") ...
...