This discussion is split from the main Oroville discussion thread, and should be focussed only on weather forecasts, hydrologic forecasts, and lake level forecasts
Some things to note:
Resources:
DWR-CDEC Oroville Dam real time sensors:
http://cdec.water.ca.gov/cgi-progs/queryF?s=ORO
NOAA 6-Day precipitation accumulation
http://www.cnrfc.noaa.gov/precipForecast.php?cwa=STO&imgNum=1
Bucks Creek Powerhouse (BUP) sensor which gives daily rainfall totals.
http://cdec.water.ca.gov/cgi-progs/queryDaily?s=BUP
For a nice wide view of the incoming water vapor, try the GFS / Pacific Sector / Precipitable Water loop at http://weather.cod.edu/forecast/
Nam, Nam4k, and others, will have higher resolution maps of P.W., 6 hour, and total precip.
http://www.tropicaltidbits.com/analysis/models/ is also good. Their map even has Lake Oroville on it.
Some things to note:
- The weather forecast, especially just loca rain forecast, don't tell you the picture. You need the hydrologic forecast - i.e. how much water is gong to reach the lake
- The watershed (catchment area that drains into the lake) is about 3,600 square miles.
- It's the average rainfall over the whole watershed that's important. 2" in one small spot is not as important as 1" over the whole area.
- The snow level is very important, as the more that falls a snow, the less goes directly into the lake. But later higher snow level can melt the low lying snow
- It takes some time for rainfall to get into the lake.
Resources:
DWR-CDEC Oroville Dam real time sensors:
http://cdec.water.ca.gov/cgi-progs/queryF?s=ORO
NOAA 6-Day precipitation accumulation
http://www.cnrfc.noaa.gov/precipForecast.php?cwa=STO&imgNum=1
Bucks Creek Powerhouse (BUP) sensor which gives daily rainfall totals.
http://cdec.water.ca.gov/cgi-progs/queryDaily?s=BUP
For a nice wide view of the incoming water vapor, try the GFS / Pacific Sector / Precipitable Water loop at http://weather.cod.edu/forecast/
Nam, Nam4k, and others, will have higher resolution maps of P.W., 6 hour, and total precip.
http://www.tropicaltidbits.com/analysis/models/ is also good. Their map even has Lake Oroville on it.
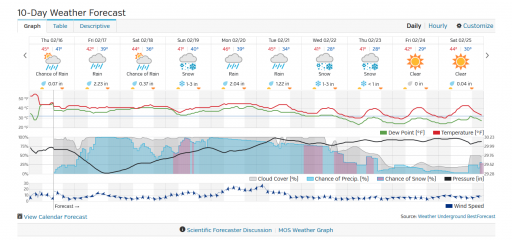
First rains have arrived in the area:
Should not be a problem in terms of rising lake levels for at least a day - and probably not at all if 100K CFS is maintained. Just might cause some operational difficulties - and less opportunities for good photos.
Last edited: