StickyMockwell
New Member
By doing a simple water balance with the observed inflows and outflows, I've had a look at what the reservoir water level would have been without the main spillway temporary shut down and reduced outflows through 7-9 Feb. (I must admit I needed a small fudge factor to get the predictions to closely match the observed reservoir water level.)
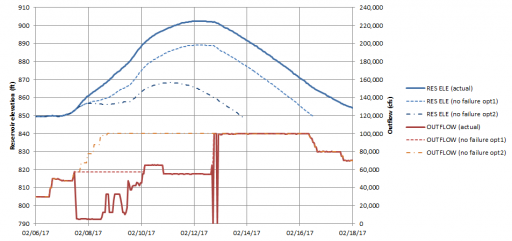
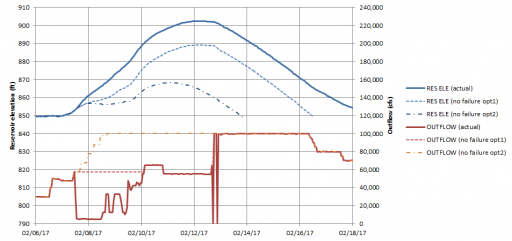
In the chart below, the continuous lines show the actual observed water level (blue) and outflow (red). There are then two alternative options looking at amended reservoir outflows (the dashed lines): (1) just fills in the 7-9 Feb shutdown gap at around 60,000cfs; (2) shows a more aggressive ramp up to 100,000cfs. The results show in each case the peak reservoir level is well below the emergency spillway level (900ft): with (1) just below 890ft; or with (2) below 870ft.
In summary, unless either (a) there is a storm with much more rainfall than experienced in early February or (b) the main spillway becomes compromised and has to be throttled back, it seems unlikely the reservoir level gets near the emergency spillway crest.
In the chart below, the continuous lines show the actual observed water level (blue) and outflow (red). There are then two alternative options looking at amended reservoir outflows (the dashed lines): (1) just fills in the 7-9 Feb shutdown gap at around 60,000cfs; (2) shows a more aggressive ramp up to 100,000cfs. The results show in each case the peak reservoir level is well below the emergency spillway level (900ft): with (1) just below 890ft; or with (2) below 870ft.

In summary, unless either (a) there is a storm with much more rainfall than experienced in early February or (b) the main spillway becomes compromised and has to be throttled back, it seems unlikely the reservoir level gets near the emergency spillway crest.

