Full-Disk HD Images of the Earth from Satellites

Another thing that comes up often, is the question "why don't we ever see any other satellites and space debris that are supposedly orbiting the Earth?"

I have my thoughts on this, namely, that I'm not sure we should expect to see any because of how small they are in comparison. But we CAN see satellites from the ground on a clear nighttime sky where there's minimal light pollution in the form of reflected light, right? So why don't we ever see the same thing in these full disc Earth images? And also on that topic, why don't we see stars in them?
 
Another thing that comes up often, is the question "why don't we ever see any other satellites and space debris that are supposedly orbiting the Earth?"

I have my thoughts on this, namely, that I'm not sure we should expect to see any because of how small they are in comparison. But we CAN see satellites from the ground on a clear nighttime sky where there's minimal light pollution in the form of reflected light, right? So why don't we ever see the same thing in these full disc Earth images?

You can see satellites from the ground because they are lit by sunlight against a dark night sky, any satellites in the images will be lit by the sun against the disk of the earth lit by the sun so wont stand out

And also on that topic, why don't we see stars in them?

Camera exposure is set to capture a brightly lit earth so the stars will be too dim to show up
 
The DSCOVR satellite is very far away, so has a much narrower field of view (a long lense), so it is more capable of photographing stars, etc. However it's still designed just for Earth. Hover, it did take this long exposure of Jupiter and it's moons:
20170623-073303-khizc.jpg
Source: https://epic.gsfc.nasa.gov/galleries/2016/imaging_jupiter

You can boost that image to maybe see some stars. Might just be sensor noise though.
20170623-073440-r44nl.jpg
 
But we CAN see satellites from the ground on a clear nighttime sky where there's minimal light pollution in the form of reflected light, right? So why don't we ever see the same thing in these full disc Earth images? And also on that topic, why don't we see stars in them?
The sunlit earth is very bright and the exposures required to properly expose it without over-exposing it prevent us from seeing stars and satellites in the images, which are far too dim. Here's some math on that which I did a while ago. At the time, DSCOVR was 967,970 miles from earth. ISS, being one of the largest and brightest satellites, is still only about 357 feet long, or about 0.07 miles. That means it would have an angular size of about 0.012785 arcseconds from DSCOVR. Earth has an equatorial diameter of about 7,926 miles, and in this image that length occupies about 1548 pixels, for a resolution of about 5 miles per pixel. That means even ISS would be very much a point-like source of light at best. We can therefore treat it as a star-like object.

How bright would the "star" of ISS be from this distance? Well at a perigee of 402 km altitude and 100% illuminated it has an apparent magnitude of -5.3.
H = m-2.5*log(distance of ISS^2 * distance of ISS from sun^2/AU^4)
(This is assuming a phase angle of 1, fully illuminated)
Where H = the absolute magnitude and m = the apparent magnitude. Plugging in we get a solar system absolute magnitude of ISS of H = 22.55 (this is the same metric used to calculate the expected brightness and size of asteroids).

Now we can reverse this and solve for the apparent magnitude of ISS at a given distance, such as the distance of DSCOVR, assuming a best case scenario where the station is fully illuminated. Given that DSCOVR has a distance to earth of about 967,970 miles, that works out to 1557797 km. Plugging that in we get an apparent magnitude of ISS of 12.6. That's well over a hundred times dimmer than the dimmest star that can be seen by naked eye. DSCOVR's EPIC camera uses fast, short exposures to properly expose the bright daylit earth. It's too fast to detect stars, let alone satellites, even a large and bright one like ISS. You would need a very long and deep exposure just to detect the brightest satellites and the view would be filled with stars. The problem is that the earth is too bright; the glare would blind the camera long before it could get to magnitude 12.
 
There's a GOES-16 viewer up and running, and it's pretty awesome. Although it's a bit slow generating the zoomed in animations.
http://rammb-slider.cira.colostate.edu/
20170825-125404-sakx7.jpg

I anticipate this being very useful in contrail tracking and explanation. In particular it should help people understand why grids sometimes form.
 
Last edited:
The above is likely getting a lot of traffic because of hurricane Harvey which is making landfall in Texas and about to create some serious flooding. So the site may speed up in a couple of days.
20170825-130221-jb2mb.jpg
 
I made a simulation of the Lunar Transit as seen from the DSCOVR Satellite


Camera Distance: 1 609 344 km (1 000 000 miles).
Diameter of the Earth: 12 742 km (7917 miles)
Diameter of the Moon: 3474 km (2158 miles)
Distance between Earth and Moon: 384 400 km (238 855 miles)

I'll be working on visually showing the angular diameters of the Earth and the Moon from that simulation.
 
Last edited:
Live views of SpaceX Starman


"Fisheye lens", right? Wrong. One minute later:


Last edited:
Live views of SpaceX Starman


"Fisheye lens", right? Wrong. One minute later:


Probably off topic, but has that car being launched into space set some kind of kind of new speed record for electric powered automobiles? I know it wasn't being powered by it's electric engines at the time but surely that's just nitpicking.
 
I saw a notice that says GOES-17 is due to become operational this month, replacing GOES-15.

I'm looking for source imagery for the Pacific Coast on July 6th, 2015. This was the date of the first DSCOVR photo of the full disk of the Earth: the one that contains the infamous 'sex in the clouds'.

I've found this:


Source:
Source: https://i.imgur.com/ul5DuJM.mp4


But it'd be nice to trace it back to the root.
 
Last edited:
I saw a notice that says GOES-17 is due to become operational this month, replacing GOES-15.

I'm looking for source imagery for the Pacific Coast on July 6th, 2015. This was the date of the first DSCOVR photo of the full disk of the Earth: the one that contains the infamous 'sex in the clouds'.

I've found this:


Source:
Source: https://i.imgur.com/ul5DuJM.mp4


But it'd be nice to trace it back to the root.


This page should give you what you're looking for:

https://www.ssec.wisc.edu/datacenter/goes-archive/#GOES15

It will take you to a search page where you can be as broad or as specific as you like.
 
The Himawari 8 satellite captured the moon in view a few times since it went operational in 2015.

... I seem to be calculating the moon at about half the distance.

Anybody else attempt such a calculation? Do you see any errors in my calculations?

Given that neither you nor I have actually travelled there, I would suggest you defer to those who have.

In recent months, there has been a joint Chinese/Saudi mission which returned a new Earthrise photo
The Chinese have landed on the far side, and prior to this, placed a comms satellite in a halo orbit for signal relay purposes.

If the accepted distance were wrong, dontcha think someone would have noticed, when their craft missed the Moon?


Of course, there are other methods of confirming distance to the Moon;

- Laser ranging
- Radio signal ranging
amongst others

Lastly, there's the Italian (?) schoolchildren who took the unedited Apollo voice transmissions, and using the delay in the signal, and the speed of radio waves, calculated the accepted distance from those.

So many agreements with the "accepted distance", and just you out of step....
 
So many agreements with the "accepted distance", and just you out of step....
It's not about the distance, it's about the legitimacy of the satellite images. If there is an image that's "impossible", it serves as evidence for the space conspiracy. There must be a reasonable explanation for it.

First, some corrected values:
R=3963 miles (semi-major axis, since we're on or close to the equator)
b=222422 miles (excentricty of lunar orbit, actual value for time/date, source: mooncalc)
B'=B+0.24° (adding half the angular size of the moon, estimated by measuring the full disc at 9cm and the moon at 0.5cm on my screen)
Note also that the latitude of Himawari 8 is +/- 0.04° (Satellite motion charts for HIMAWARI-8). I was unable find the actual position for that date.

But even with these corrections, angle A is still approximately 20 arc seconds too large.
To take up the excess, the moon needs to be further away from the satellite. Waiting 1:40 minutes puts the moon at 31.46W, and everything matches. (+/- 15 seconds for the orbital variation of Himawari 8). (central angle calculator)

How could this occur?
I know that Himawari 8 is on a 20 minute cycle, i.e. the data collection schedule repeats every 20 minutes. I also know that Himawari images are published with an apparent 20 minute delay. My hypothesis is that the image is stamped with the start time of the data cycle, but actually collected and transmitted after this starting time.

How could this be corrobarated?
a) ask the Japanese Metereological service
b) find sensor skew due to Earth rotation in the full disc image, and compute the time it takes to collect
 
Last edited:
I also know that Himawari images are published with an apparent 20 minute delay.

I was waiting for a Himawari-8 live image the other day and I think it was a 10 minute delay.

Just checked now and it was 24/25 minutes.
 
Last edited:
Here's a great video from Scott Manley, talking about a large asteroid that burned up over the Bering Strait:


Source: https://www.youtube.com/watch?v=fpaxvjFh-qA

The occurence wasn't discovered until some time after, given that it was almost literally in the middle of nowhere, but the cool thing is that when satellite images from that timeframe were looked at, the asteroid was seen, as well as its trail. Himawari got some good shots, and other weather satellites captured it too.
 
Hi guys. Interesting thread. I'm an electronics tech, amongst other things. One of the fun things I like to do is receive weather satellite images. I live in cyclone territory and to have access to satellite weather data live rather than from internet. This is useful to track cyclones when the internet goes down. I have access to the NOAA ATP sats, the Russian Meteor M2 and more recently Himawari 8.

I've attached an image I received yesterday. You can see cyclone Veronica in WA and ex cyclone Trevor in the NT. This was received with a 2.3m dish, Novra S300D and DVB-S2 receiver via Jcsat2B. The image is a 9 band composite, made from one visible and 8 infrared bands. Single bands of course are monochrome. Xrit2pic was used to combine the bands.

Looks like it's spherical. ;) Anything you want to know just ask.
190323_2320_J.jpg
 
@Learjet if it's one visible band, why is the surface blue and green and brown? and also I thought Himawari has three visible band sensors?
 
@Learjet if it's one visible band, why is the 644nm is surface blue and green and brown? and also I thought Himawari has three visible band sensors?

This is a false colour palette. Green is vegetation from one of the IR channels, land is from a different IR channel and visible at 644nm is mapped to blue, even though 644nm is actually red. Confusing isn't it? Himawaricast via Jcsat2B doesn't include green or blue sensor data for some reason so a false colour palette has to be created.
 
What's the time difference between you receiving the images and them being available on the Himawari website?
 
I have the images in about 15 minutes. It takes about that amount of time to receive all the data. For instance for the 12pm image, data transfer starts at about 12:05 and ends at 12:15. There are 140 - 150 HRIT files. This adds up to nearly 500mb! That's about 3gb per hour. On top of that LRIT files are generated along with sataid files.
 
I probably should correct my calculation post above where I stated that Himawari is on a 20 minute cycle.
In each 10-minute period, the AHI will scan the Full Disk once, the Japan Area and Target Area four times, and the two Landmark Areas twenty times. These 10-minute divisions are basic units of an observation schedule called a timeline. In Himawari-8 and -9’s baseline observation, the timeline will be repeated every 10 minutes except in their housekeeping operation.
Content from External Source
( https://www.data.jma.go.jp/mscweb/en/himawari89/space_segment/spsg_ahi.html )
image.png

This is the system @Learjet is using:
image.png
https://www.data.jma.go.jp/mscweb/en/himawari89/himawari_cast/himawari_cast.php


Himawari-8 takes 10 minutes to scan the full disk from the observation start time, and it is expected to take 16 minutes from the observation start time to receive all segment files.
Content from External Source
https://www.data.jma.go.jp/mscweb/e...ast/note/HimawariCast_dataset_20150624_en.pdf
 
Yes Mendel, that's the method I use. I get parts of an image for each band first which after 10 minutes makes a complete image.
 
Like a lot of people, I used to think that full disk images from the Himawari-8 images were taken with a single shot, rather than being 'composites'. But what I've recently learned is that its camera takes twenty-three 500km wide 'swaths' in order to make up a full disk:
The imager uses a continuous imaging technique for East-West-Imaging and South-North Stepping at swath width of 500 Kilometers.

Full-disk images of the entire planet as seen by the instrument are acquired once every ten minutes requiring 23 South-North swaths to be taken.
Content from External Source
It also takes another eight swaths that zoom into specific areas, giving 50ish images every ten minutes, from 87 swaths:

7387346_orig-1024x643.jpg
Source: http://spaceflight101.com/spacecraft/himawari-8-and-9/

I say "50ish" because I'm not quite sure how they've tallied the numbers. The above link states "49 images every ten minutes" but the breakdown seems to show 53.

There's a couple more links here detailing the process:

https://www.data.jma.go.jp/mscweb/en/VRL/VLab_RGB/RGBimage.html
https://www.wired.com/2015/08/americas-next-best-weather-satellite-japan-already/
 
Like a lot of people, I used to think that full disk images from the Himawari-8 images were taken with a single shot, rather than being 'composites'. But what I've recently learned is that its camera takes twenty-three 500km wide 'swaths' in order to make up a full disk:

Here's a video showing a possible scan sequence. It's interesting that it scans the smaller regions in the middle of the full-disk scan. But that makes sense, as it's doing the full-disk scan over ten minutes, and the smaller regions are scanned multiple times during those ten minutes.

Source: https://www.youtube.com/watch?v=sFg_VpY3e0g


The video was made before deployment, so the actual scan sequence could vary.

I think most satellite cameras employ some kind of scanning technique, which makes sense as they can get a higher resolution that way, and they don't need to capture fast action. I suppose you'd get some objection that "it's all CGI" because it's scanned, but that's rather a semantic argument. Lots of phone cameras use a "rolling shutter" where they "scan" the image very rapidly. Rolling shutter is even used in some film cameras, where (for very short exposures) only one narrow strip of film is exposed at a time (a very short time, but still the same concept)

The DSCOVR images, however, are "single images" using a since 2048x2048 CMOS sensor.
https://epic.gsfc.nasa.gov/about/epic

So if there's some objection to scanned images you can always show them DSCOVER: single images that show the full disk of a rotating Earth with changing weather.
https://epic.gsfc.nasa.gov/
Metabunk 2019-04-06 09-33-36.jpg
Photo from 2019-04-04 18:46:25 (UTC, I think)
 
About Himawari 8 scanning, with the data that comes down, I receive 10 north / south segment "swaths" per image in HRIT format for each band. There are 14-15 bands available from Himawaricast and 16 from the net version. I don't know why they leave out green and blue for Himawaricast since I have to use a false colour IR palette rather than RGB for a colour image, but I digress.

14x10 = 140 HRIT files / part images every 10 minutes for full disc only from Himawaricast. I can sometimes see a slight delay between segments, especially when the Moon finds itself in the middle of two segments, it is shifted slightly.

So for a full disc monochrome image, 10 segments are needed. For a 3 band colour image, 30 segments/strips/swaths/etc are used. I sometimes use a 9 band composite with various transparency settings as it gives more cloud layers, so that's like 90 segments to make a single image. The curve, of course, is clearly seen in every segment anyway.
 
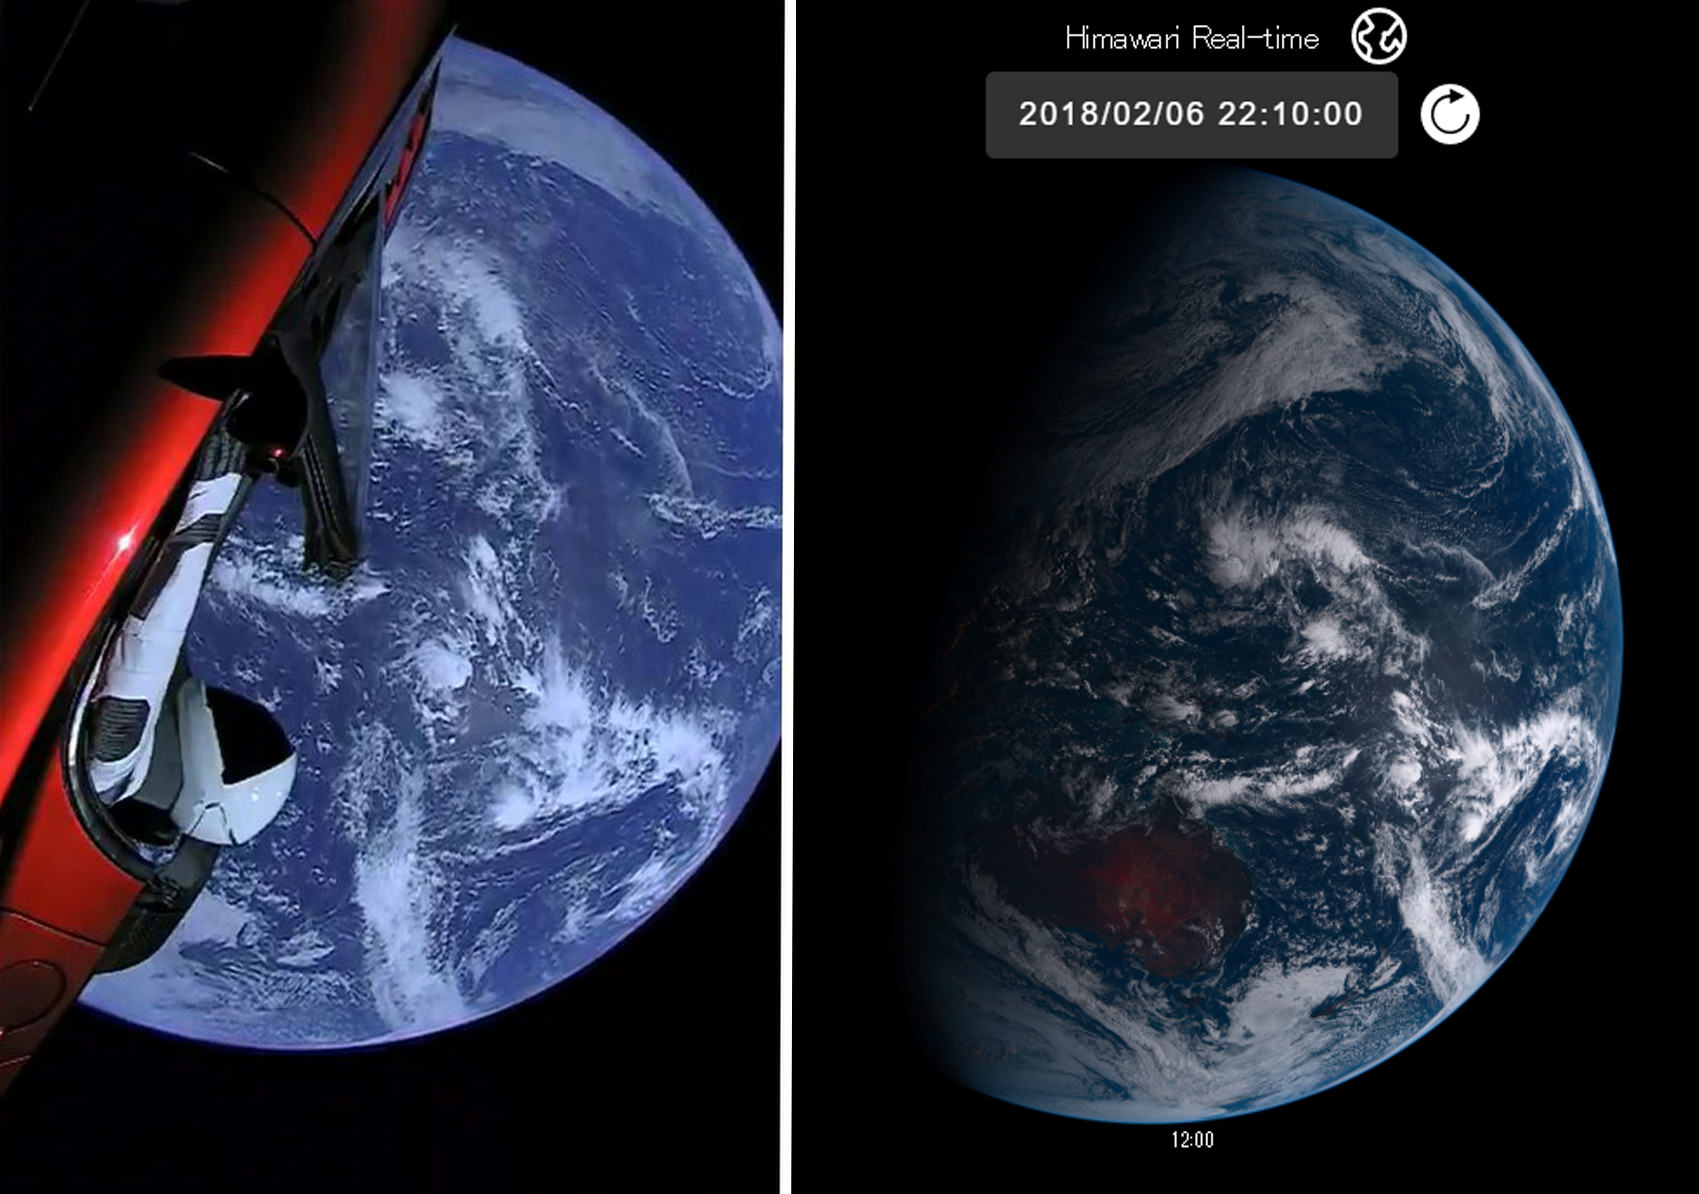
For the laymen, would you describe Himawari-8 full-disk images as "composites"?

I think there's a danger of confusion in asking if something fits the meaning of a word without actually specifying the meaning of the word. This is especially true when you know that the Flat Earth and Fake Space folk want to claim that all space images are fake. If you say an image is a "composite" then that could be interpreted as saying it's fake.

All the satellites mentioned in this thread use a monochrome camera (or cameras) and filters (and/or beam splitters). for example, here's the GOES-16/17 setup:
Metabunk 2019-04-24 08-45-02.jpg
Source: https://www.goes-r.gov/downloads/resources/documents/GOES-RSeriesDataBook.pdf

The visible light images come from the VNIR (Visible & Near Infrared) sensor on the right, which is actually responsible for six bands.

So if you are seeing a color image then it's a "composite" of two or more channels (bands, wavelengths, colors).

Most of them "scan" the image in a couple of ways. Firstly, they divide a region into "swathes" which they image individually and then stitch those swathes into a set of single-band images (which can then be combined into color images, or processed to highlight or measure certain things, like cirrus clouds). This is somewhat analogous to the "panorama" mode on a phone camera (but with less overlap). This large scale scanning is done by aiming with two mirrors which obviously can be moved much easier than the camera itself.

Then, many of the satellites "scan" the image in way more like a simple scanner. Instead of the full image being registered on a single CCD, like on a conventional camera, the satellite imagers have "Focal Plane Modules" which have multiple columns of pixels, different columns for different bands. As the east/west mirror moves across the image this registers one column at a time
Metabunk 2019-04-24 08-55-58.jpg Here's the resolution of the
Metabunk 2019-04-24 08-57-03.jpg
While they have multiple columns, only one pixel per row is used (it picks the best one). The first two are visible wavelengths. The highest resolution on is the 0.64µm (640nm, red) channel at 1460 pixels high. The lower resolution 0.47µm channel is blue. Notably absent is green (which would be around 0.51µm). So you can't get a natural color image by combining red, green, and blue (which is what most cameras do). Green has to be calculated from the other channels - maybe including the IR 0.86 band, which detects vegetation, as a partial green band. (Himawari-8 has a green band)

Are the GOES or Himawari images "composite?" They produce full disk single band images that are scanned and stitched, but I would not describe those as composite unless you are being particularly pedantic. Here's the red image
Metabunk 2019-04-24 09-21-53.jpg

I'd be quite happy in describing that as a full-disk image of the Earth from space.

Once the individual band data is on the ground, it is used to make composite images referred to as "products". For example the "GeoColor" product
Metabunk 2019-04-24 09-25-41.jpg

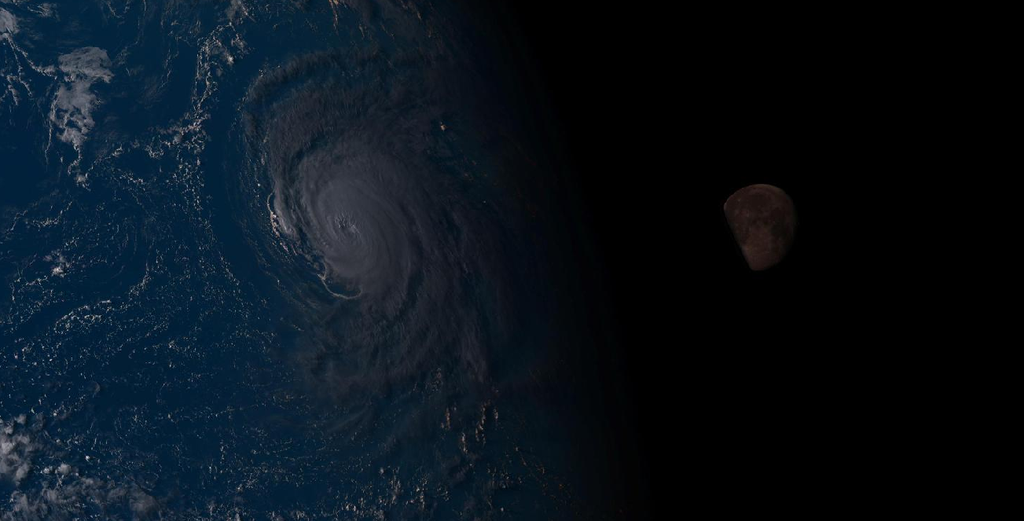
Notice half the planet is in night, and you can see clouds and city lights in the dark half - here the day and night parts of the image come from different bands. The night clouds probably from the longwave radiation (outgoing heat) I think the city lights seem to be from a single image, possibly the 2012 Night Lights image from the Blue Marble project. So that's a composite image. Other products composite images in different ways, including compositing the longwave clouds with the Blue Marble land image to produce an image with no night time.

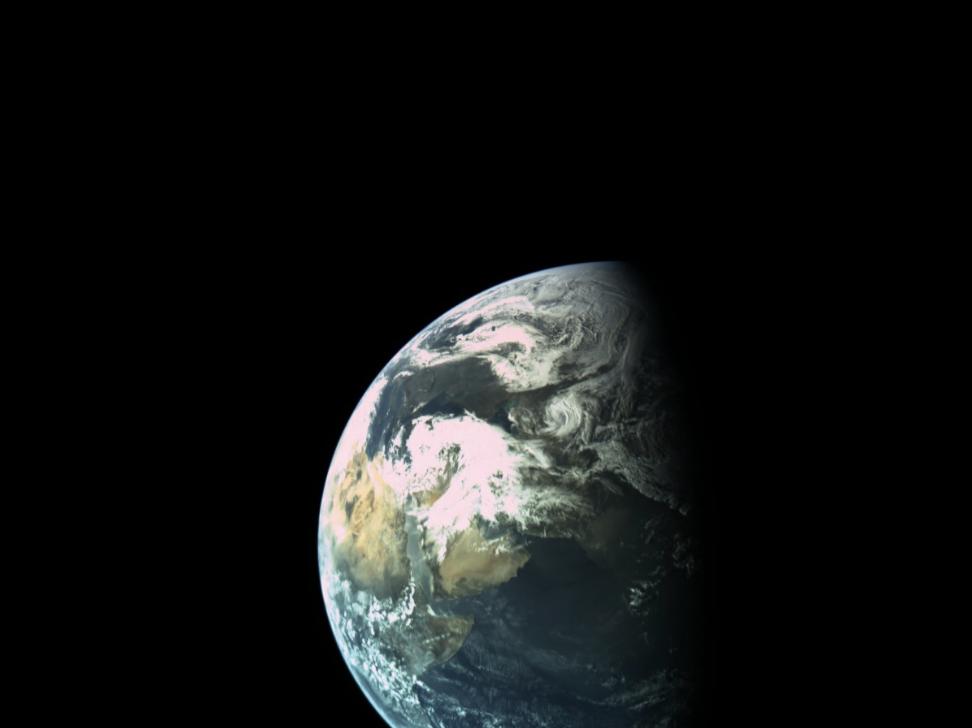
And if you really want a non-scanned, non-stitched, and certainly non-composite image, the best place is the DSCOVR, with the EPIC (Earth Polychromatic Imaging Camera), which has a more conventional 2048x2048 pixel CCD, although it uses a filter wheel to get red, green, and blue bands. But a single band from the EPIC is, in fact, a photo of the earth from space by even the strictest definition (unless you only accept actual chemical film photos).
Metabunk 2019-04-24 10-09-05.jpg
 
Look at the size of earth. Look at the height Of orbit of the car around 100 miles up in space we are told . it’s miles lower than the ISS ...how come the earth is way smaller than any ISS image of earth . Total fake watch the glitch of earth at 42 sec s

Source: https://youtu.be/elkh38u5gow


The orbit of the SpaceX Starman was elliptical going from 180km to 6951km (111 to 4319 miles) so it was only lower than the ISS for part of the orbit and much further out for the rest. Plus there's no reason to think that the cameras would be the same with the same lenses

A second burn executed at T+28.5 minutes fired the MVac engine for 30 seconds to accelerate the stack into an elliptical transfer orbit of 180 by 6,951 Kilometers
Content from External Source


http://spaceflight101.com/falcon-heavy-launches-on-inaugural-flight/
 
The orbit of the SpaceX Starman was elliptical going from 180km to 6951km (111 to 4319 miles) so it was only lower than the ISS for part of the orbit and much further out for the rest. Plus there's no reason to think that the cameras would be the same with the same lenses

A second burn executed at T+28.5 minutes fired the MVac engine for 30 seconds to accelerate the stack into an elliptical transfer orbit of 180 by 6,951 Kilometers
Content from External Source
http://spaceflight101.com/falcon-heavy-launches-on-inaugural-flight/
You have a full earth shot , the Earth is tiny compared to any image or footage from ISS. Trying to say it’s the camera is not going to cut it . Why don’t we have a similar size image from the ISS and it’s been up there for years .
It’s a 100 miles up that’s all at that point . You ever seen a image from a high altitude plane ! Not that much lower .
The earth looks smaller than the images taken by the Epic satellite and that’s way way out there.
So your response does not hold up in any way. Oh and can you explain the glitch , just earth not the whole image ?
 
You have a full earth shot , the Earth is tiny compared to any image or footage from ISS. Trying to say it’s the camera is not going to cut it .
Why not? Try drawing a scale diagram with the camera in the right place next to the earth, and draw a triangle representing the field of view.
 
. Why don’t we have a similar size image from the ISS and it’s been up there for years .
It’s a 100 miles up that’s all at that point .

How do you know it was "100 miles up"? It sounds as if you are assuming this figure.

As already stated, it was an elliptical orbit:

Perigee of 180 kilometers - 112 miles

Apogee of 6,951 kilometers - 4,319 miles

If we are assuming, why not assume it was 4,319 miles up when the photo was taken?

I think you should educate yourself on what an elliptical orbit is, and what perigee and apogee mean.


The earth looks smaller than the images taken by the Epic satellite and that’s way way out there.
So your response does not hold up in any way.

The Epic satellite uses a telescopic lens and the camera in the Musk photo has a wide angle lens. Things look big in a telescope and small with a wide angle lens.

Is there something fishy about these birds? Or is the photographer just using a different lens in each shot?


Last edited:
Back
Top