Debunked: Shasta Snow and Water Aluminum Tests.

I wonder how Francis Mangels can explain the result given the opposite is occuring.

Though it swiftly becomes improbable if looked at realistically, most conspiracy theorists tend to simply expand the range of the conspiracy/cover-up to include ever-greater participants. Thus, the Shasta bunch will probably have to claim that the data you show is being controlled and falsified. Dane Wigington regulary uses the theme that he has failed to advance the chemtrails meme because ten thousand atmospheric scientists are either more stupid than he and his cohorts or actively engage in a conspiracy to conduct geoengineering. Which is more probable?

Mangels, Wigington, Michael J. Murphy, and G. Edward Griffin have all been informed multiple times of the information in this thread and how their other claims on this and other topics have been debunked.

That puts the onus on them to demonstrate otherwise, but they carefully avoid putting themselves in positions where those sorts of questions could be asked, and actively avoid responding to any information which they are aware contradicts their claims. That is dishonest behavior and amounts to spreading misinformation and engaging in a cover-up, which is ironically what they accuse others of doing. Undeniably, THEY are fully aware they are engaged in the cover-up and promotion of false information.
 
It is well known not to rely purely on a single sample result when making an analysis
I agree completely on that. Somewhere I saw a communication from a Forest Service hydrologist saying they would need app. a dozen samples to get a good baseline. I'm guessing the ph of the AL2O3 is 7.0, since it is non-reactive except in acidic soil, but I haven't checked. I will do a sample on my home gardening ph tester when I get back in town. Good find on the PM10 data.
 
I agree completely on that. Somewhere I saw a communication from a Forest Service hydrologist saying they would need app. a dozen samples to get a good baseline. I'm guessing the ph of the AL2O3 is 7.0, since it is non-reactive except in acidic soil, but I haven't checked. I will do a sample on my home gardening ph tester when I get back in town. Good find on the PM10 data.
I only briefly touched on it but I remembered that aluminium oxide was available in a number of Ph values when we used it in a lab for column chromatography http://www.aacash.com/aloxide.htm I was just thinking of covering all variables within your tests. Air quality and especially PM10 is something I have been looking into especially given that most developed nations have some form of Clean Air Act. I was just looking into how the US monitored theirs.

Though it swiftly becomes improbable if looked at realistically, most conspiracy theorists tend to simply expand the range of the conspiracy/cover-up to include ever-greater participants. Thus, the Shasta bunch will probably have to claim that the data you show is being controlled and falsified. Dane Wigington regulary uses the theme that he has failed to advance the chemtrails meme because ten thousand atmospheric scientists are either more stupid than he and his cohorts or actively engage in a conspiracy to conduct geoengineering. Which is more probable?

Mangels, Wigington, Michael J. Murphy, and G. Edward Griffin have all been informed multiple times of the information in this thread and how their other claims on this and other topics have been debunked.

That puts the onus on them to demonstrate otherwise, but they carefully avoid putting themselves in positions where those sorts of questions could be asked, and actively avoid responding to any information which they are aware contradicts their claims. That is dishonest behavior and amounts to spreading misinformation and engaging in a cover-up, which is ironically what they accuse others of doing. Undeniably, THEY are fully aware they are engaged in the cover-up and promotion of false information.

I totally agree Jay. The conspiracy must be at a very local level and going on for decades and I am certain that it must now involve all environmental groups that may campaign for better air quality. I have changed my tack recently and try to focus discussions on air quality especially as it is a focus of the press and environmental groups in the UK after the government was found by the Supreme Court to be failing to meet its target under EU legislation http://www.guardian.co.uk/environment/2013/may/01/government-pollution-supreme-court However the UK crowd like Max Bliss seem to gloss over the issue as it does not fit into their theory, after all the data that was used in court was provided by DEFRA, so why did they not just fiddle the figures so to speak to avoid possible EU court action??
 
Biggerdave said:
I only briefly touched on it but I remembered that aluminium oxide was available in a number of Ph values when we used it in a lab for column chromatography

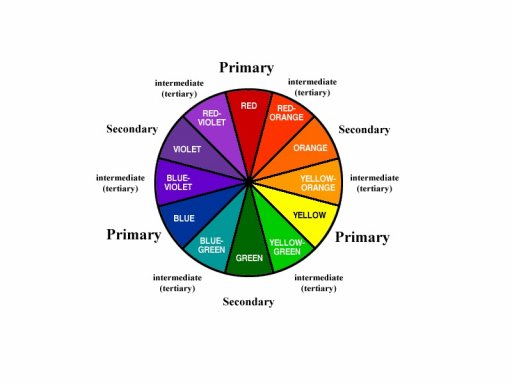
It looks like this is a basic formulation, although there is nothing on the label. The blue color is not on the chart on this home ph test, but blue is beyond green on the color wheel, and dark green is slightly basic, 7.5. This ph test is only accurate to 0.5, but I did measure as accurately as I could, and used distilled water.
AlpH.JPG color wheel.jpg Al oxide.JPG
 
What about this quack site bothers you?
If there is a common ownership between everythinghcg and the chemtrails site, then they are spreading a bunk conspiracy theory to help sell their supplements. Also, I can't find any information as to the ingredients in some of these products. One would have to have a lot of blind faith to buy them.
 
Not only that, but some herbal medicines can have negative side effects. My best friend is an excellent herbalist and she has read and researched herbal medicine for about 50 years. She would never use or recommend herbal products that do not disclose their ingredients.

Herbal medicines have no oversight and little real research. My friend's teas did help to lower my hubby's blood pressure, however, once he had insurance the prescription medicines reduce it even more.
 
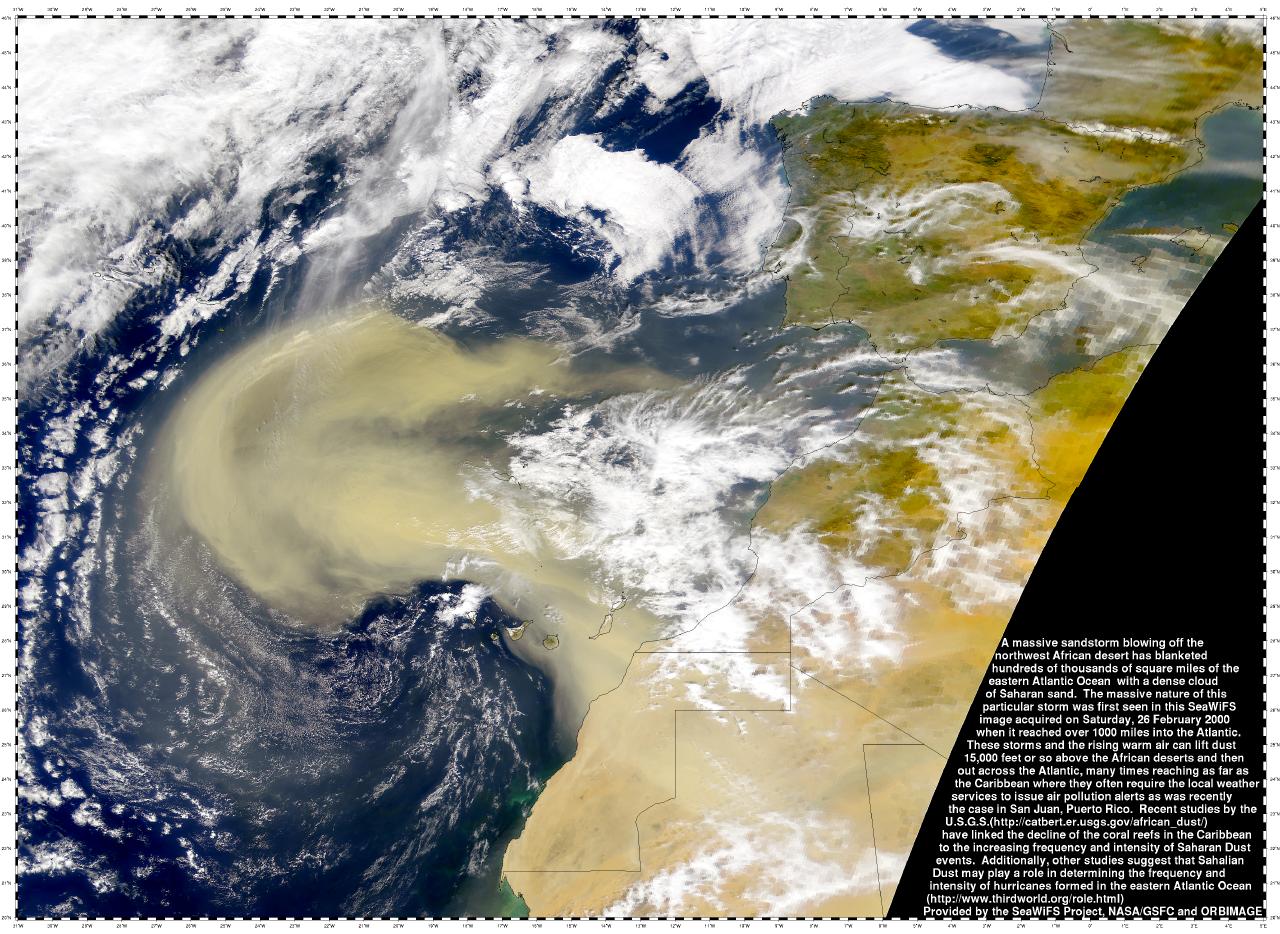
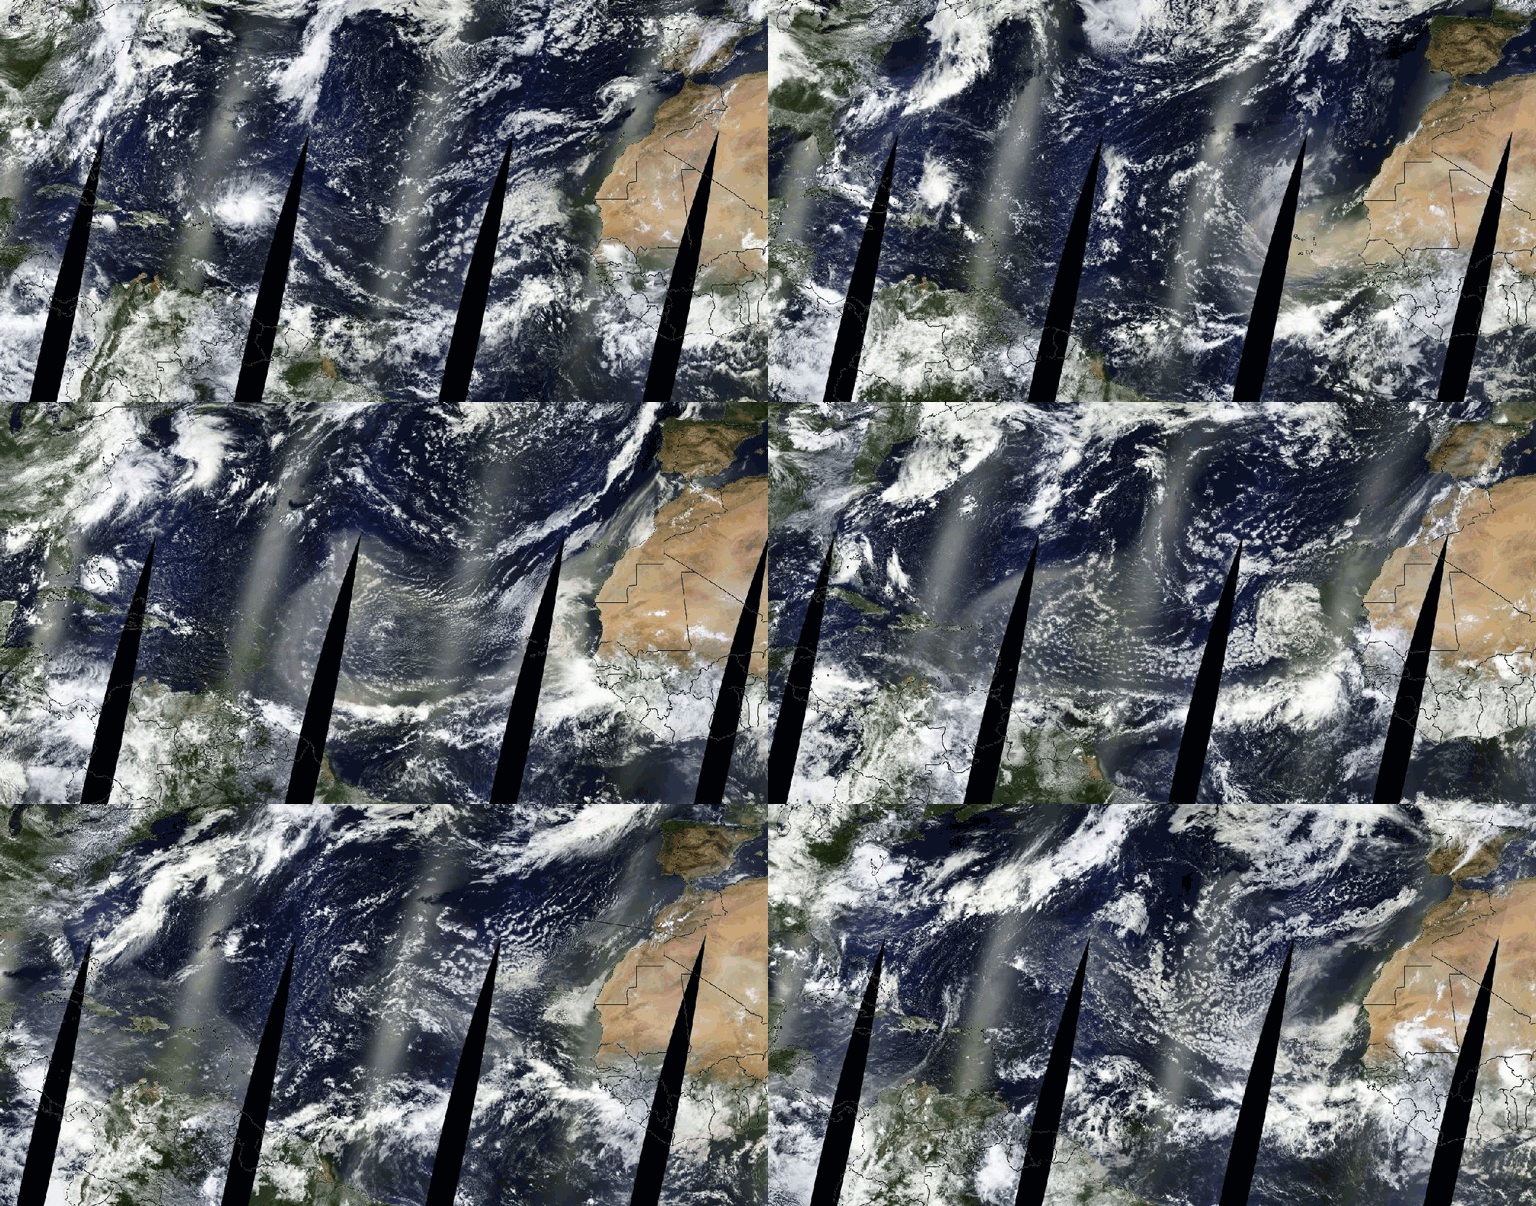
Interesting about the Sahara dust. I'm just listening to Dane Wigington tell someone that only mercury vapor is able to travel across oceans, he says that particles cannot.

The facts are that ice cores thousands of years old contain identifable dust particulates from both asia and saharan dust episodes. Yes, strontium is in there.
http://www.hindawi.com/journals/amet/2012/674385/fig3/
 
One of the conditions killing Caribbean coral reefs, is a bacteria that infects them that comes in on dust from the Sahara. Dane needs to expand his reading list it seems.
 
http://en.wikipedia.org/wiki/Mineral_dust
Mineral dust is a term used to indicate atmospheric aerosols originated from the suspension of minerals constituting thesoil, being composed of various oxides and carbonates. Human activities lead to 30% of the dust load in the atmosphere. The Sahara is the major source of mineral dust, which subsequently spreads across the Mediterranean (where is the origin of rain dust) and Caribbean seas into northern South America, Central America, North America, and Europe. Additionally, it plays a significant role in the nutrient inflow to the Amazon rainforest.[1] The Gobi Desert is another source of dust in the atmosphere, which affects eastern Asia and western North America.
Content from External Source
 
Last edited:
I am forwarding this to David Lim, a chemtrails advocate in the UK. It should be of particular use to him since the research originates at Reading University where he is studying for his PhD. In her 300 page 2009 doctoral thesis, Claire Louise McConnell of Reading University sampled saharan dust and examined it's properties.

Here are some excerpts:

dust mineralogy.jpg ratios.jpg

This agrees closely with known ratios of global crustal composition. In the pie chart, you can see that globally, about 2-3 times more silicon exists compared to aluminum:

crustalabundance.jpg

This closely agrees with Steve Funk's rain water sample result taken at Mt. Shasta, CA:

Funk silicon.jpg

which found:
Silicon (Si)----0.14 mg/L or 140.0 ug/L
Aluminum (Al)-----54.2 ug/L
Ratio of silicon/aluminum:
Si/Al= 140/54.2= 2.583

So, Steve Funk's lab analysis agrees with scientifically known and published ratios of silicon to aluminum in mineral dust and opposed to claims that the aluminum being found in rain water shows a signature of alleged geoengineering, the ratio conforms to the signature of Mother Earth's crust.
 
Last edited:
Tap Water and Dust.jpg

Here is another sample of dry deposition--that is, how does it affect your water sample results if you leave your collector outside for seven weeks before it rains. Sample 1 is 20 oz. of Mt. Shasta tap water. No aluminum was detected. Sample two was 20 oz of tap water mixed into a bucket that had been kept outside from June 4 to July 30. The bucket was brought under a covered porch for the rain we had between June 16 and June 26, and the thundershowers between July 25-27. Otherwise, it was on a post above ground, not under direct tree canopy. Sample two has 3,670 micrograms/liter of Al, and 20,800 micrograms/liter of Silicon, for an Si/Al ratio of 5.67. The average Si/Al ratio for four samples is now 3.8. The average for the earth's crust is 3.4. (See posts 64, 67, and 73.
 
As I live on the island of Tenerife, one of seven islands in the Canary Islands, let me tell you I'm the first to get this dust. We call it "The Calima".

We have had it our daily air for the past six weeks, with occasional 'breaks'. It reduces the blue of the sky, sometimes to pure white. The sun loses its yellowness. Quite strange at sunrise and sunset.

Nights become hotter, as the airborne sand reflects back radiation which would have been lost to space.

The temperature right now at 9.30 am is 35 deg C, and the RH is 40, and today's insolation has only just begun. These figures are for El Medano, which is cooled by its proximity to the sea. A couple of thousand feet up the hill, the temperature can rise to 45 deg C.

Mud bogeys, small hardened sand dunes in the corners of one's eyes, cracked soles to one's feet. It's all great fun.

A positive consequence is a great slaughter of flying insects. They are forced to take cover. But the cover is already occupied by countless millions of starving lizards.

So once the calima passes, there are absolutely no flies for at least a month. But there are always roaches...
 
When looking at people's claims, it is useful to see how they change over time. Dane Wigington wrote his first article in 2007:

“Diminished Solar Charge Capacities Due to Persistent Contrails”

During our first two winters here, there was considerable difficulty maintaining adequate battery charges due to the lengthy storms. This was further worsened by the long aircraft trails that would cover the skies during the occasional breaks in the weather fronts. These trails alone would at times drop my charging potential to less than half.......

Still more than enough to hamper severely my potential to pump adequate water from my well for dryer season needs. I also began to take notice of surprising accumulations of dust on my panels. This also diminishes charging potential. Knowing the ingredients mentioned in the patents, I decided to take a few dust samples to a lab in our area that performs all of the state’s testing in the region. This was to be the beginning of a chain of alarming data and tests. The dust was full of aluminum and barium.

I believe that most likely Wigington had a full elemental analysis done on the dry deposition, an analysis which would include silicon.
For that reason, I checked his site looking for the lab reports for these samples he claimed to have. I could not find them.

So, on 10/11/11 I requested that these specific samples be released for examination:


While there could be more tests available, at a minimum I need the following, which you have publicly cited, to complete my review:
1. All 45 lab tests cited by Mauro Oliviera on 5/27/2009 before the California Energy Commission.

2. All pond and spring lab tests taken at the property of Lynn Dorrah showing 375,000 ugl aluminum, also cited by Mauro Oliviera on 5/27/2009 before the California Energy Commission.

3. Dust lab tests from solar panels mentioned by Dane Wigington in his article, “Diminished Solar Charge Capacities Due to Persistent Contrails”

4. Soil lab tests taken by Francis Mangels showing 1% aluminum cited in his
“Statement on Aerosols and Drought for DOE 5/27/09 in Sacramento”

I suggest that it would be very helpful if these could be made available to anyone within the current geoengineeringwatch.com library, along with the ones currently displayed. I will appreciate your cooperation in getting these tests available online soon.

Sincerely,

John B. (Jay) Reynolds

The response from Wigington was:
"All testing done by me is, and has always been, available on line."
 
Last edited by a moderator:
Ice cores from 1832 show aluminosilicate dust, even in the relatively pristine environment of Antarctica(James Ross Island)Mcconnell et.al. 2007.jpg .


McConnell.jpg
 

Reply
francis mangels says:
December 4, 2013 at 1:11 am
latest rainfall in Mt shasta, CA has 13,100 ug/l aluminum, 283 ug/l of barium, 382 ug/l Strontium. And the national contest a few years ago said our water was pure and #2 in the nation. yeh, sure. Frankly, chris edwards is a toady for the 1%. Buy smart locally and stop playing their game. Go organic. Grow a garden. Back to the small farm.
Content from External Source
I suspect that Francis left his rain gauge unwashed most of the summer to get these numbers. I got 3670 ug/l al at the end of July by mixing clean tap water in a dusty bucket. I'll have to ask him next time I see him.
 

Reply
francis mangels says:
December 4, 2013 at 1:11 am
latest rainfall in Mt shasta, CA has 13,100 ug/l aluminum, 283 ug/l of barium, 382 ug/l Strontium. And the national contest a few years ago said our water was pure and #2 in the nation. yeh, sure. Frankly, chris edwards is a toady for the 1%. Buy smart locally and stop playing their game. Go organic. Grow a garden. Back to the small farm.
Content from External Source
I suspect that Francis left his rain gauge unwashed most of the summer to get these numbers. I got 3670 ug/l al at the end of July
by mixing clean tap water in a dusty bucket. I'll have to ask him next time I see him.

I apologise as I can't do external quotes. This is an interesting article about the UKs' Rural Heavy Metal Monitoring Network.

http://www.aweimagazine.com/article.php?article_id=216

I would take note of the Sample Collection section for precipitation and the pains they go to ensure no contamination of the collectors. Essentially a 24hr soak in hydrochloric acid, a rinse in ultra pure water, a 24hr soak in nitric acid, a rinse in ultra pure water and dried in a filtered air cupboard. Everything is then assembled in the lab but I think the preparation alone shows how many vectors there could be for contamination.
 
cropped Feb2014 rain samples.jpg

Samples one and two are from the rain Feb 6-8, the first rain after a very dry Jan and Dec. Sample three was from the next storm about five days later. All three samples had relatively low aluminum levels, and relatively high si/al ratios. The average silicon/aluminum ratio for the three samples is 9 to 1.
I could have introduced a little error in handling the samples. When I collect in mason jars, I can't get the minimum 350 ml sample with less than an inch of rain. When I collect in two gallon buckets, as I did this time, I got more than the one liter maximum, and had to stir it, then take only a portion of the sample to send to the lab.
Sample four was because my wife smelled sulfur from the kitchen tap. None was detected, so it must have been in the drain.
 
Last edited:
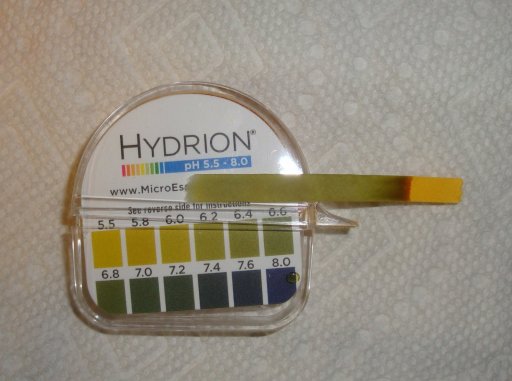
I had problems entering text with the above photo. Anyway, I got the same type of ph paper that Francis Mangels uses. This is Mount Shasta water from the tap. I would call it 6.4 to 6.5. A value this high would help explain why irrigated gardens in town tend to increase in ph. The water in the city spring was deposited as snow on the mountain about 50 years ago, and no detectable al has been found in city tap water, so the ph of the water could not have been affected by geoengineering.
 
Mount Shasta Got 2.6 inches of rain last night, Sept 23-24. The ph looks pretty normal. First one is app. 6.0. Second is app. 5.8. I may or may not get this sample to the lab for more analysis.
DSC09322.JPG DSC09321.JPG
 
More on this....


https://www.climate.gov/news-features/featured-images/dust-snow-reduces-colorado-river-flow
This is not a new study - (2010)
http://www.pnas.org/content/107/40/17125.full
Ensemble backtrajectories, geostationary remote sensing, and isotopic analysis show that the dust loading in the UCRB comes from the disturbed soils in the Colorado Plateau and Great Basin (5).
Content from External Source


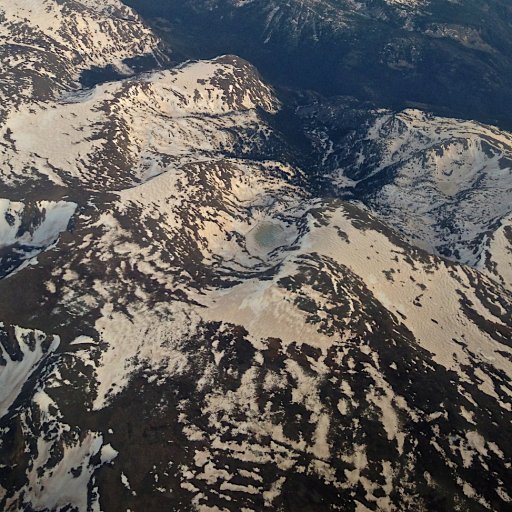
The Shasta area produces it's own source of windblown dirt (esp. at about an 80% snowmelt progress in July).....just as any mountain would at that time, including dirt blown-in from from the surrounding valleys.
 
Last edited:
Back
Top