Coronavirus Statistics: Cases, Mortality, vs. Flu

Sweden and Denmark are breaking away from Italy's trend. France and Germany may be starting to do the same. Spain is catching up with Italy.
This is tracking the number of reported cases, which depends on testing. It's not the death toll.

1584934117604.png
https://www.algebris.com/policy-research-forum/blog/covid-19-facts/

France and Germany are back to following Italy. Denmark has the same number of confirmed cases per capita as France, but has a more linear trend.
1585029421165.png
 
The Diamond Princess mortality rate increased to 10/712=1.4%, and 15 patients are still critical.
When John Ioannidis mapped the previous 1% mortality rate onto U.S. age demographics, it was 0.125%, so the updated rate is 0.175%
 
Last edited:
The bad news is that COVID-19 is causing a spike in influenza-like illness (ILI), tracked by the CDC
You are over-interpreting the data. Covid-19 is causing a spike in visits. The CDC page that you cite has this notice at the top:
Note: The COVID-19 outbreak unfolding in the United States may affect healthcare seeking behavior which in turn would impact data from ILINet.
Content from External Source
Looking deeper at the methodology, here:
2. Outpatient Illness Surveillance
Information on outpatient visits to health care providers for influenza-like illness is collected through the U.S. Outpatient Influenza-like Illness Surveillance Network (ILINet). ILINet consists of outpatient healthcare providers in all 50 states, Puerto Rico, the District of Columbia and the U.S. Virgin Islands reporting approximately 60 million patient visits during the 2018-19 season. Each week, approximately 2,600 outpatient healthcare providers around the country report data to CDC on the total number of patients seen for any reason and the number of those patients with influenza-like illness (ILI) by age group (0-4 years, 5-24 years, 25-49 years, 50-64 years, and ≥65 years). For this system, ILI is defined as fever (temperature of 100°F [37.8°C] or greater) and a cough and/or a sore throat without a known cause other than influenza. Sites with electronic health records use an equivalent definition as determined by public health authorities.
Content from External Source
If people who wouldn't normally see a doctor for a temperature and a sore throat are now scared of Covid-19 and do, this causes a rise in the "visits" statistic even if there isn't a rise in ILI numbers.

P.S. You can tell it's not the flu because ILI is defined to not be the flu.
 
I returned to the US from Singapore on March 3. Walked right through customs and boarder patrol without a single mention of Caronavirus, not even a posted sign. Going through passport control, the agent wasn't wearing a mask, or even gloves that I recall, and I stood about two foot away as he took my passport. The saving grace was there wasn't very many people on the flight, and the airport didn't seam as busy as it could have been. This also might be anecdotal evidence the virus doesn't spread that easily through casual contact, else many more passport control agents would have come down with it by now.
 
more passport control agents would have come down with it by now.
march 23


The alarming anecdotes came as the Transportation Security Administration said eight of its agents in the New York area have tested positive for the coronavirus — five at JFK, two at Newark and one at La Guardia.

Some were at work as recently as last week, according to an online database. All but one — a baggage handler at Newark — are screening officers.
Content from External Source
https://nypost.com/2020/03/23/travelers-shocked-by-barebones-coronavirus-screening-at-us-airports/
 
The good news is that the social distancing measures quickly caused a huge drop in fevers, according to this creepy smart thermometer company.

https://www.kinsahealth.co/social-distancing-and-its-effect-on-reducing-the-spread-of-illness/
https://healthweather.us/
1585206144647.png

I think I just found the "Coronavirus is a hoax" motherlode, https://swprs.org/a-swiss-doctor-on-covid-19/ apparently collects every scientific (science-adjacent?) argument in favor of the hypothesis that nothing out of the ordinary is happening. Debunking all of the claims on that page seems quite the task!

They do have your graph above, but it's labeled as "influenza trend" (I can't access healthweather, is that their label?), and they state that it has nothing to do with the government restrictions; but the kinsahealth article you link shows a clear state-specific correlation for that, contradicting this:
The following section compares roughly four weeks of influenza-like illness levels for three states — Florida, Washington and California — that first reported COVID-19 infections. These states provide a useful case study. Washington state and California have aggressively instituted social distancing measures and have shown declines in influenza-like illness in the subsequent days and weeks. In Florida, the limited implementation of social distancing measures are associated with a prolonged and sustained increase in illness levels.
Content from External Source
 
NYC is a current hot spot. Did the agents catch the bug from screening passengers, from a family member at home, or going out to the bar with their buddies after work? The problem is with anecdotal evidence we're all just speculating, including the policy makers.

march 23

The alarming anecdotes came as the Transportation Security Administration said eight of its agents in the New York area have tested positive for the coronavirus — five at JFK, two at Newark and one at La Guardia.
Content from External Source
 
NYC is a current hot spot. Did the agents catch the bug from screening passengers, from a family member at home, or going out to the bar with their buddies after work? The problem is with anecdotal evidence we're all just speculating, including the policy makers.
The NY Post quote states that 7 of the 8 cases were screening officers. Compare that to
In the past 14 days across the nation, there are 28 TSA screening officers who have tested positive for COVID-19. In addition, 10 non-screening employees who have relatively limited interaction with the traveling public, have tested positive for the virus over the same period.
Content from External Source
https://www.tsa.gov/coronavirus, "Updated March 26, 2020"

Why is the diagnosed infection rate higher for screening officers in NY than the nationwide average? What is the proportion of screening officers compared to other TSA employees?

The fact that the infection rate in NY was higher for this specific job type suggests prima facie that in NY, this job is more dangerous than elsewhere. From that, it follows that the job itself carries the risk of infection. If they tested screeners more thoroughly than baggage handlers (or the general population), there'd be another explanation.

Edit:
The US has 70 000 cases and 320 million inhabitants, that makes 21 diagnosed cases per 100 000. The TSA has 38 cases and 50000 employees, that makes 76 diagnosed cases per 100 000.
NYC had 20000 cases as of yesterday here, with 9 million inhabitants, for 222 cases per 100 000. If the TSA has 3800 employees in NYC, then the 8 cases are average. This assumption seems reasonable, because that'd be ~8% of the workforce, and JFK has somehat less than 10% of total passenger emplanements in the US.
So, yeah, use this data with caution. My guess is:
* NYC has ramped up testing, and TSA employees test positive at an average rate
* Other states may be behind on testing, testing a greater than average proportion of TSA agents because they are perceived to be at a greater risk of exposure
 
Last edited:
NYC had 20000 cases as of yesterday here, with 9 million inhabitants, for 222 cases per 100 000. If the TSA has 3800 employees in NYC, then the 8 cases are average.
technically JFK workers aren't necessarily from NYC. New Jersey and Connecticut (tri-state) , Long island...work in NY. my dad worked at JFK and we were in Connecticut.

pinpointing numbers is complicated. :)
 
If people who wouldn't normally see a doctor for a temperature and a sore throat are now scared of Covid-19 and do, this causes a rise in the "visits" statistic even if there isn't a rise in ILI numbers.
P.S. You can tell it's not the flu because ILI is defined to not be the flu.

I was going by this: "The new coronavirus has caused unprecedented flu-like activity in the US"
https://www.accuweather.com/en/heal...recedented-flu-like-activity-in-the-us/708101

Another thing that might cause a rise in percentage of doctor visits for ILI is if people are postponing doctor visits for other things like routine wellness exams.
ILI does include the flu: "ILI is defined as fever and a cough and/or a sore throat without a known cause other than influenza." It's a double negative. If the cause is known to be influenza, then the caveat "without a known cause" does not apply. It would be ridiculous to exclude the flu from one of the main flu activity trackers.
 
Last edited:
I think I just found the "Coronavirus is a hoax" motherlode, https://swprs.org/a-swiss-doctor-on-covid-19/ apparently collects every scientific (science-adjacent?) argument in favor of the hypothesis that nothing out of the ordinary is happening. Debunking all of the claims on that page seems quite the task!

They do have your graph above, but it's labeled as "influenza trend" (I can't access healthweather, is that their label?), and they state that it has nothing to do with the government restrictions; but the kinsahealth article you link shows a clear state-specific correlation for that, contradicting this:
The following section compares roughly four weeks of influenza-like illness levels for three states — Florida, Washington and California — that first reported COVID-19 infections. These states provide a useful case study. Washington state and California have aggressively instituted social distancing measures and have shown declines in influenza-like illness in the subsequent days and weeks. In Florida, the limited implementation of social distancing measures are associated with a prolonged and sustained increase in illness levels.
Content from External Source

The US Health Weather Map is "Powered by kinsa insights" and has this note: "Due to widespread social distancing, school closures, stay-at-home orders, etc. feverish illness levels are dropping in many regions. This does not mean that COVID-19 cases are declining. In fact, we expect to see reported cases continue to surge in the near term, but it may indicate these measures are starting to slow the spread."
1585277009244.png

Their article says that what they're seeing is a decrease in cold and flu rather than COVID-19.
https://www.kinsahealth.co/social-distancing-and-its-effect-on-reducing-the-spread-of-illness/
Before looking at individual state results, it’s important to include a caveat in regards to the findings presented here. In particular, what we are seeing here is likely an overwhelming decrease in seasonal cold and flu transmission rather than any effect specific to COVID-19. This conclusion is driven by two factors:
  1. We assume that the incidence of seasonal cold and flu viruses driving infections currently is significantly higher than COVID-19.
  2. The median incubation period (time between infection and symptom presentation) for the flu is 3 days, whereas for COVID-19, the current estimates for incubation are closer to 5 to 6 days. Therefore, following the introduction of social distancing measures, we would first expect flu infections to drop.
COVID-19 and the flu are both respiratory viruses that are transmitted primarily by respiratory droplets. We interpret these declines in presumed flu infections to be a promising indication that social distancing measures will be effective at slowing the spread of COVID-19.
Content from External Source
I expected social distancing to reduce the spread of both flu and COVID-19.
But Paul Offit told ZDoggMD that he thinks COVID-19 is mainly spread via the fecal-oral route because the quarantines were able to stop the spread of COVID-19 but not the flu. He didn't give a source of his data.

Source: https://youtu.be/MAeaFoSuJho?t=495

...because you can't stop a virus that is purely respiratory. We can't stop influenza. If you look at influenza sweeping across this country every year, one thing you could look at actually is to see whether these draconian quarantine or the self quarantine that we're doing has had an effect on influenza spread. It really hasn't because there is no stopping a virus that's easily spread by the respiratory, which tells me that there has to be a fecal-oral component to this.
Content from External Source
If he's right, then kinsa is showing a drop in COVID-19 and not the flu. If kinsa is right, then they're showing a drop in flu and not COVID-19. If I'm right, then they're showing a drop in both.
 
ILI does include the flu: "ILI is defined as fever and a cough and/or a sore throat without a known cause other than influenza." It's a double negative. If the cause is known to be influenza, then the caveat "without a known cause" does not apply. It would be ridiculous to exclude the flu from one of the main flu activity trackers.
I stand corrected.
As a side note, the WHO dropped the "without a known cause" requirement recently:
The criterion “absence of another diagnosis” was also omitted because its inclusion in the 1999 definition had resulted in the exclusion of ILI cases with underlying chronic conditions, e.g. asthma and congestive heart failure, that can influence influenza risk.
Content from External Source
 
If he's right, then kinsa is showing a drop in COVID-19 and not the flu. If kinsa is right, then they're showing a drop in flu and not COVID-19. If I'm right, then they're showing a drop in both.
First, I'm sorry: I had prepared a screenshot of the claim I was referencing, but apparently forgot to include it with my post:
image.jpeg
Their claim is that the lockdowns have not affected ILI, and that's refuted by the kinsa article you had cited.

For Covid-19, it depends what we are talking about: transmission must be affected if ILI is affected, since it uses the same main mechanism (droplets), but Covid-19 case numbers depend on the length of the incubation time, and so are affected later, and since their proportion is still small, would not be noticeable in the ILI statistic.

Germany has done a large amount of contact tracing starting in January, and researchers have used this to determine the methods of transmission, i.e. figuring out what people actually get it from ( I've quoted the RKI "Steckbrief" on this before). I expect they would have picked up on it if it was fecal-oral; but instead, they find a) spread correlates with prolonged close contact, b) virus load in the nose and throat is highest at the onset of symptoms, which correlates with the time when known transmissions occur, c) we're starting to see a slowing of the spread.
There may be a fecal-oral component to transmission, but I strongly doubt that it is epidemiologically significant.

Keep washing your hands carefully anyway. :cool:
 
Last edited:
Since I didn't know hardly anything about Singapore until last year when we got the project, I thought it would help to add a bit of context. Singapore is an island city state on the southern tip of Malaysia, one degree north of the equator. It's primary language is English, while it's residence also speak one of several mother languages like Chinese or Malay. The country has been given high marks for containing the Caronavirus.


I returned to the US from Singapore on March 3. Walked right through customs and boarder patrol without a single mention of Caronavirus, not even a posted sign. Going through passport control, the agent wasn't wearing a mask, or even gloves that I recall, and I stood about two foot away as he took my passport. The saving grace was there wasn't very many people on the flight, and the airport didn't seam as busy as it could have been. This also might be anecdotal evidence the virus doesn't spread that easily through casual contact, else many more passport control agents would have come down with it by now.
 
Today, I took the ECDC worlwide data download and made a graph of the per capita daily reported cases in the most affected (per capita) countries, using the 2018 population figures included in that file. The curves are smoothed with a B-spline because infections are continuous even if reporting is not.
image.png
Observations:
* Many small countries are as badly affected as the bigger ones making the headlines, e.g. Switzerland CHE parallels Germany DEU, but at a higher level
* Italy has managed to stabilize their daily new cases at a high level.
* The Faroer Islands are making progress towards containing the spread.
* While some countries appear to be successfully flattening their curves, others show little sign of bucking the trend yet.
* You can exceed Italy even if you started later

Note: I excluded Andorra and Monaco for size, and GRL does not have enough data points to compute the spline. The Y-axis is logarithmically scaled to new daily cases per 100 000 inhabitants.
 
Today, I took the ECDC worlwide data download and made a graph of the per capita daily reported cases in the most affected (per capita) countries, using the 2018 population figures included in that file. The curves are smoothed with a B-spline because infections are continuous even if reporting is not.

Along these lines - no pun intended - former FDA commissioner Scott Gottlieb tweeted a graph showing the doubling time of deaths in different states of the U.S.
Deaths are less likely to be underreported than case counts.

Source: https://twitter.com/ScottGottliebMD/status/1243331459978493953


The curves are smoothed with a B-spline because infections are continuous even if reporting is not.
Its only continuous in graphical terms if you use cumulative figures, that way the gradient is the rate of reported infection and you can read from the y axis an estimate of how many people you expect to have been diagnosed on any given date at any particular time of day. As it stands the y axis value is only meaningful at the data points so smoothing between them makes no sense.
 
On March 27th, the RKI published Epidemiological Bulletin 14/2020 (German only), entitled "Schwereeinschätzung von COVID-19 mit Vergleichsdaten zu Pneumonien aus dem Krankenhaussentinel für schwere akute Atemwegserkrankungen am RKI (ICOSARI)" (Severity estimate of COVID-19 in comparison to data for pneumonia from the RKI hospital sentinel for severe acute respiratory infections (ICOSARI)). I'd like to share the first half of the analysis section with you.

Diskussion
Wir haben in dieser Studie versucht, vergleichbare Patientenkollektive aus China und Deutschland zu betrachten, um einen Eindruck der klinischen Schwere der Erkrankungen mit dem neuartigen Coronaviren zu gewinnen. Dazu wurden Patienten mit Pneumoniediagnose im ICOSARI-Sentinel in einem Zeitraum ansteigender Influenza-Aktivität in Deutschland (jeweils 3. – 5. KW) in den Jahren 2015 – 2019 betrachtet und mit publizierten Fallserien bestätigter COVID-19-Pneumomiepatienten in China verglichen.

Ausgehend von einer vergleichbaren Grunddiagnose (Pneumonie) ergab sich jeweils ein erstaunlich ähnlicher Anteil intensivpflichtiger und verstorbener Patienten. Allerdings konnte anhand der Daten auch gezeigt werden, dass die COVID-19-Patienten jünger waren als die Pneumoniepatienten in Deutschland während der Grippewelle. Dieser Unterschied kann nicht allein durch die jüngere Bevölkerung in China erklärt werden.

Es hat sich bestätigt, dass ältere Menschen und solche mit vorbestehenden Grunderkrankungen ein höheres Risiko für einen schweren Krankheitsverlauf bei COVID-19 haben (s. www.rki.de/covid-19-steckbrief), so wie es auch bei saisonaler Influenza der Fall sein kann. Dennoch gab es bei COVID-19-Patienten mit schweren Krankheitsverläufen einen höheren Anteil jüngerer Menschen und einen höheren Anteil an Patienten ohne Vorerkrankungen als man bei Patienten mit Pneumoniediagnose während saisonaler Influenzawellen beobachtet hat.
Der Anteil an COVID-19-Patienten mit ARDS und Beatmungspflichtigkeit in China scheint deutlich höher zu sein als bei Pneumoniepatienten zu Beginn der jährlichen Grippewelle in Deutschland. Nach Daten einer Studie aus China muss zudem mit vergleichsweise deutlich längeren Beatmungszeiten gerechnet werden. Während der Influenzapandemie 2009 wurden allerdings im ARDS-Netzwerk in Deutschland ähnlich lange Beatmungszeiten berichtet.

Content from External Source
Analysis
In this study, we attempted to look at comparable groups of patients from China and Germany, to get an idea of the clinical severity of the cases with the new coronavirus. To that end, we looked at patients from the ICOSARI-sentinel diagnosed with pneumonia at a time of increasing influenza activity in Germany (3rd-5th week of the year) from the years 2015-2019, and compared them to published case groups of confirmed COVID-19 pneumonia patients from China.

Based on a comparable core diagnosis (pneumonia), we saw a remarkably similar proportion of ICU patients and deaths. But the data also showed that COVID-19 patients were [on average] younger than the German pneumonia patients during influenza season. This difference can't be explained by the younger [average age of the] population in China alone.

We could confirm that older people and those with existing preconditions have an elevated risk for a severe course of the illness with COVID-19 (see www.rki.de/covid-19-steckbrief), similar to seasonal influenza. Nonetheless, among COVID-19 patients with severe courses, we saw a higher proportion of younger people and a higher proportion of patients without preconditions than we're used to seeing with pneumonia patients during seasonal influenza.

The proportion of COVID-19 patients with ARDS [acute respiratory deficiency syndrome] and artificial respiration needs in China appears to be substantially greater, compared to pneumonia patients at the start of the yearly flu season in Germany. According to the data from one Chinese study, the time spent on the respirator is significantly longer by comparison, although the ARDS network in Germany observed similarly long respiration durations during the 2009 influenza pandemic.
 
EDIT: I replaced the graphic with an updated version that now also includes the UK

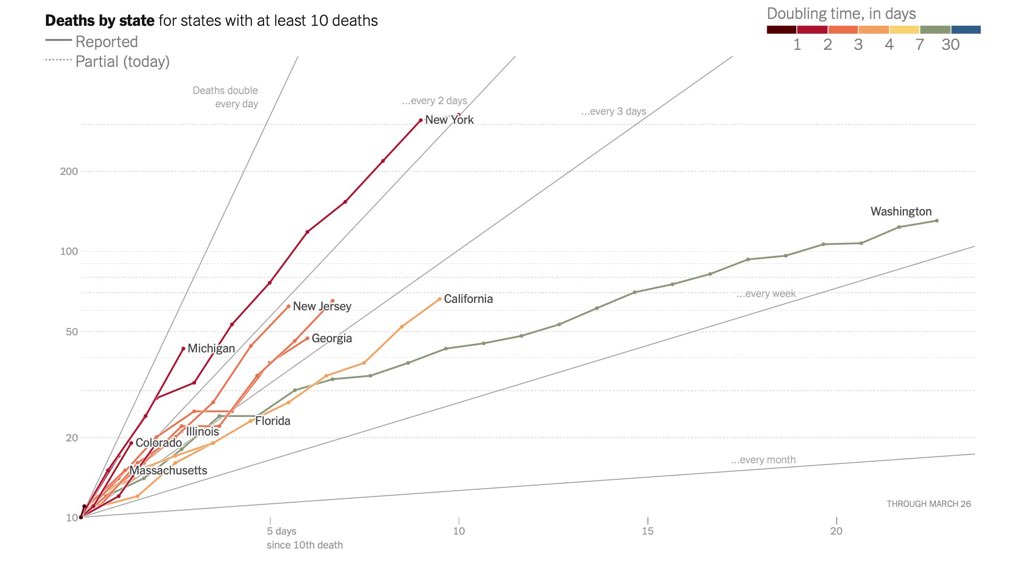
I did the same just now, and came up with my own plot.

The following algorith applies:
  1. I compute the total number of cases per 1 million people population since the day when a sustained outbreak became visible - i.e. I exclude individual cases caused by people returning early from China that were immediately contained and did not spread. This goes on my x-axis
  2. I compute the number of new cases in the last 7 days per 1 million people population - that goes on my y-axis
  3. Both axes are logarithmic.
  4. For each country, I start plotting on the day it first exceeded 5 cases per 1 million population
  5. Note that my last data point for each country represent the 29th of March - i.e. today - for which data of course is incomplete
I chose Italy and USA because of prominence, Germany because that's where I live, South Korea as a reliable country known to have gotten a handle on the situation, Iceland because I think I read that they are testing more thoroughly than anyone, Switzerland because I notice they have as many cases as Italy per 1 mio but no one talks about it, Austria just so, Australia because it's in the southern hemisphere.

CoronaDoubleLog_20200329.png

You see the trend you are all probably familiar with: All countries follow the same trajectory more or less, with only SK having escaped from it decisively. Italy and perhaps Switzerland seem on the verge of escaping the trend (no more exponential growth).

And then there is an item I label "HS", What is that??

It's the "Kreis Heinsberg" (car license plates here start with "HS-", hence the label), Germany's westernmost district (or county) and home to both the largest sustained Covid outbreak in Germany and to - me :p

We had our first reported cases (a married couple, both hospitalized, one on ventilator for a while) on February 25th (Italy had recorded its first cases just four days earlier). That was the last day of the carnival season, and the couple had participated in several large carnival event; the wife also works in a kindergarten. This jump-started the epidemic here.

I have taken data from the Covid-19 Dashboard of the Robert Koch Institut: https://corona.rki.de/
On top, select "Landkreise" (districts) instead of "Bundesländer" (states). Then select "Kreis Heinsberg" from the list on the left. I took the daily new cases from the graphic on the bottom right, augmented by my knowledge that the first 2 cases were on February 2nd.

It seems HS has escaped the exponential growth at approximately the point where Iceland is now - and they, too, seem on the verge of escaping.
This might be a model for non-urban regions in developed countries: Grow exponentially to 2 cases per 1000 inhabitants before slowing down growth rates for cases.

(Iceland however has suffered only 6 deaths per million so far. HS, at about the same point (~2,800 cases per 1 million on March 16th), had 16 deaths per million - and today we already have 122 deaths per million!
I predict that Iceland will have between 20 and 80 deaths in 12 days (April 10th)!)


The next step now is to monitor resolved cases and deduct them from the number of total cases: Are open cases beginning to decline?
 
Last edited:
Here is another graph, from the same dataset. Algorithm:
  1. Again, "Day 1" is the first time the country or district exceeded 5 total cases per 1 million population
  2. For "Day 15", the first value of each line, I computed the daily growth rate between Day 1 and Day 15 (14 days) using the formula
    (n(Day 15)/n(Day1))^(1/14) - 1
  3. On all following days, I do the same, but for the last 3 days.
CoronaGrowthRates_20200329.png

In the graphic I posted in my previous post, we see that South Korea as well as my home district "HS" have decidedly left the straight line where exponential growth occurs (incremental new cases proportional to total cases), and this graph suggests that this happens when daily growth rate is pushed down near or under 10%. Total cases are still growing then, of course, but that's the point when increasing recovery rates will soon bring the number of open cases down.
This seems possible 3 to 4 weeks after "Day 1" as I defined it - >5 cases per 1 million.

The early rate however is what determines the total level.

I see that USA and UK, despite coming late into the game and thus having had a chance to learn from several other countries, do not excel in that regard! Particularly the UK is doing pretty shitty...
 
But why would that correlate with government measures?

More people staying home and taking their temperature with their smart thermometer out of boredom or anxiety. I took my temperature with my dumb thermometer while I'm healthy to record my normal baseline temperature.
 
Its only continuous in graphical terms if you use cumulative figures, that way the gradient is the rate of reported infection and you can read from the y axis an estimate of how many people you expect to have been diagnosed on any given date at any particular time of day. As it stands the y axis value is only meaningful at the data points so smoothing between them makes no sense.

What if you interpolate the cumulative figures and take the gradient to get the interpolated rates?
 
@Mendel, sorry I might have been a bit off the mark with my reading of your graph in post 104.

It finally clicked that the y value is kind of a rolling average of the rate of new diagnoses per day and therefore relates to a 24 hour period not a single point in time, I had been viewing the y axis figure as a simple quantity not a rate. That makes the gradient the rate of change of the rate of new diagnoses so I still think that smoothing was the wrong way to go, if you are trying to illustrate a general trend like;
Italy has managed to stabilize their daily new cases at a high level.
a line of best fit with a gradient approaching 0 makes the point better than a wiggly curve that implies the rate of change of the rate of change is constantly changing.
 
Did we turn a corner today? Just watching the new cases, I noticed (felt?) that it is taking longer to get from 700k new cases to 800k than it did to get from 600k to 700k. To back this up, we have.

1585604971268.png
Too early to tell of course.
 
In New York, over 98% of those who died from COVID-19 had underlying conditions. What percent of the other patients and the general population have these conditions?
https://www.nbcnews.com/health/health-news/first-minor-coronavirus-new-york-city-dies-n1172171
Of the 790 people who have died from COVID-19 in New York City, all but 13 had underlying conditions. The city department of health's definition of "underlying conditions" includes diabetes, lung disease, cancer, immunodeficiency, heart disease, hypertension, asthma, kidney disease, and GI/liver disease.
Content from External Source
 
Diabetes and hypertension (high blood pressure) are both common, in most countries, and the prevalence increases with age. In the whole adult population, the proportion is over 10% for diabetes and over 20% for hypertension, and therefore higher than this for the older age groups. (With some variation, of course, among different countries and ethnic groups. In the UK, for example, people of South Asian ancestry have higher rates of diabetes.) But both diabetes and hypertension are usually controllable with medication. I was diagnosed with severe hypertension myself abut 10 years ago, but with medication (and some lifestyle changes - more exercise, better diet), my BP is now usually within the normal range. So there is an interesting question, whether someone whose hypertension is under control still counts as having an 'underlying condition' for COVID-19 purposes. For me, the question is not just academic!
 
So there is an interesting question, whether someone whose hypertension is under control still counts as having an 'underlying condition' for COVID-19 purposes. For me, the question is not just academic!

According to "10 doctors", it still counts.
https://www.wfaa.com/article/news/h...d-19/287-d59ac730-7c48-43de-85c3-37e1c3acad1c
As the COVID-19 pandemic spreads further around the world, doctors continue to say older populations and those with an underlying health condition are most at risk.
But what exactly is considered an underlying health issue or condition in the context of the disease?
WFAA reached out to 10 doctors to find out, and they all responded the same way.
The term can be split into two categories.
The first is chronic conditions-- these are long-term medical diseases or illnesses like asthma, chronic bronchitis, diabetes, high blood pressure (even if it is controlled with medication), heart disease, lung disease, liver disease, COPD and cancer. These kinds of conditions also tend to be incurable.
...
And while smoking or vaping are considered to be habits that can cause or worsen chronic and acute diseases, they are not considered underlying health conditions.
Content from External Source
 
Did we turn a corner today?
For yesterday, the ECDC worldwide data has just 4 countries reporting a combined ~6000 cases less than the day before: France, Spain, the US, and Italy. This means this could be an artifact of how these countries are reporting; they're currently reporting 60% of the world's Covid-19 cases. They've all had momentary downturns before, just not all of them at the same time.
Downturn4countries.png
just4countries.png
 
Last edited by a moderator:
The world is still at under 1 million cases (tested positive). If this undercounts the actual infected 1:10, the world is at 10 million.
https://www.worldometers.info/coronavirus/ currently has 810,123 in the world. Only 4 countries (USA, Italy, Spain, China) account for half of that sum, 4 further countries (Germany, Iran, France, UK) account for half of the rest, and all the other 190 or so countries combine for 183,750.

But the virus also visits other large countries with huge cities: India (1,251 cases so far), Brazil (4,681 cases), Egypt (656 cases), Russia (2,337), ... Suppose these countries tested as much as the 8 leading countries, and imagine coronavirus sneaks into Delhi, Sao Paulo, Cairo or Moscow: Each of these cities could easily match the world total today when all is said and counted.
 
Back
Top