Oroville Watershed Weather Forecast, Lake Level and Inflow Calculations

Status
Not open for further replies.
Relatively low rains for these last few days. Sun-Tue looks like much heavier rain, but with all the room they made it should be fine. Monday is pretty intense looking, 4-5" in the immediate watershed, will probably rise a bit from this.

This is the one day forecast

20170217-233701-xoj4c.jpg
 
Outflow down to ~70K cfs (edit <65K for hour to 11 am local time). Inflow creeping up to 40+K cfs for the last five hours.

The water level is still dropping (854.62 @ 11am local time), but much more slowly than before.

It looks like they have got lots of headroom, so should be safe if they can start to increase the outflow rate as the water level rises.

Source: http://cdec.water.ca.gov/cgi-progs/queryF?s=ORO&d=18-Feb-2017+11:21&span=25hours
 
Last edited:
I'm pretty sure the reservoir can handle the rain that's coming as long as no other unexpected events at the dam creep up. It's certainly not the precip event that occurred in early Feb. As Mick pointed out above that event from Feb 2 to Feb 10 dumped 17.5 inches.

That being said it does look like a pretty good slug of precip is going to fall directly on that drainage basin ..

Total New Precip (in).jpg
 
From http://www.water.ca.gov/orovillerelicensing/docs/wg_study_reports_and_docs/EO/SP-E4.pdf (1)

This is what the max flood looks like and what the emergency spillway was designed for (e.g. - the PMF or Probable Maximum Flood):

upload_2017-2-18_12-54-18.png
The PMF has grown since original design. For perspective, I have plotted the early February event very approximately as red dots.

Here is the precipitation that corresponds to one of the PMF calculations:

upload_2017-2-18_12-58-10.png

The above numbers average to 18.6 inches when weighted by subbasin area.

The sobering statistic is:

upload_2017-2-18_13-1-3.png
At 3500 TAF capcity to the brim of the emergency spillway, a PMF could essentially fill the reservoir from empty in 72 hours, depending on which one you use, but the PMF is an extreme event. Yet it is what the emergency spillway was designed to handle. I don't know how they have dealt with the growth in PMF since early design.

Other interesting points are the effects of snowmelt:

upload_2017-2-18_13-7-22.png

Current snowpack seems remarkably close to this, but at least in this PMF analysis "only" contributes 4.5 inches to the inflow. That's not to say conditions could not make it more, but it seems a small contributor to the total.
 
Last edited:
I wish they would stop using the peak rainfall. It's the average over the watershed area that counts.

That said, the forecast keeps changing. I'm 70 miles from the dam (and 200 feet above the top of lake :) We are forecast 3" of rain on monday and it was forecast 1.5" a few days ago. Very strong winds too.

There will be lots of local flooding and roads washed out, separate from Oroville.
 
There will be lots of local flooding and roads washed out, separate from Oroville.

Absolutely- from Big Sur north the whole state is very water logged (not that SoCal isnt right now) and putting a pretty good strain on all infrastructure. When there is only a day and half between storms it doesnt take much to be back under the gun again. And now models are hinting that things might not be that dry next week and beyond as it looked yesterday.

In the Bay Area, in my backyard, I have had ~75 inches of rain since Oct 1st.
 
Rainfall over the last three days; for comparison with that anticipated over the next three days, now that actual inflows over the prior three days have been observed.

upload_2017-2-18_17-23-2.png


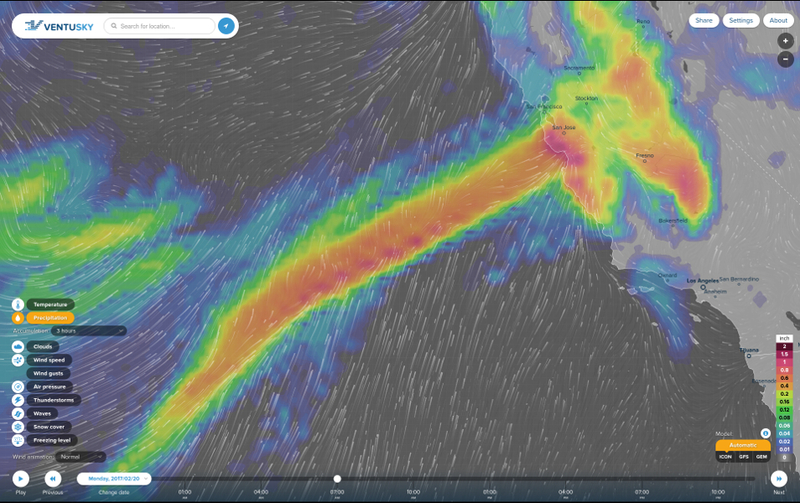
NWS AFD 3am 2/18: Main precipitation shield will then move in Sunday
evening into Monday with widespread moderate to heavy rain and snow.
PWAT values on the order of 1+ inches with return intervals in the
5-10 year range. Precipitation will continue into early Tuesday.
Latest model runs have shifted corridor of heaviest precipitation
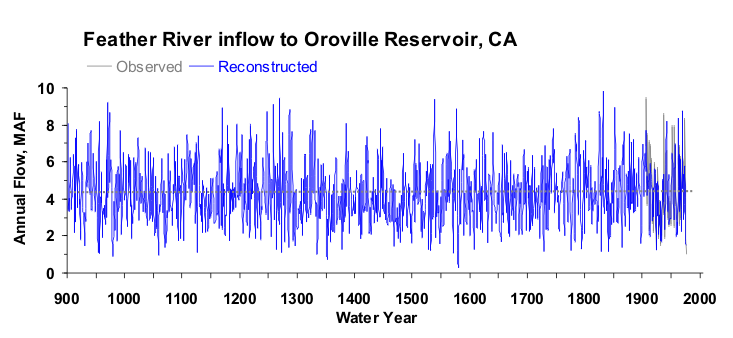
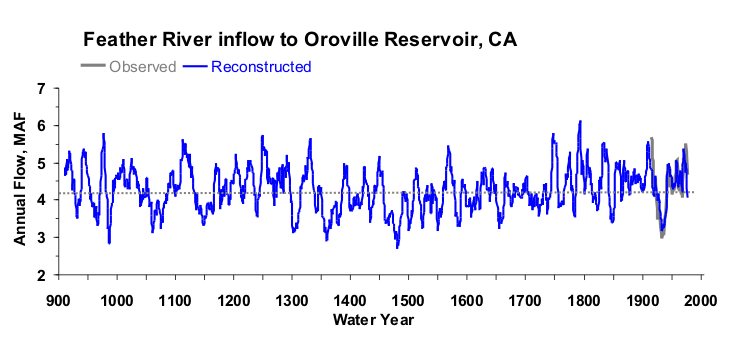
a bit south from yesterday when the highest amounts seemed focused on
the Feather River Basin. Focus now seems to be around I-80 corridor
and southward. This would further stress the Cosumnes and San Joaquin
River basins. Regardless impressive amounts across the Sierra due to
orographic nature with totals ranging between 4-8 inches.
Content from External Source
 
Last edited:
It appears they will go into tomorrow with the lake level around 850ft, or 2.8 million acre feet of water in the lake. Which is approximately where they were before the last storm hit and before the problem with the spillway developed (see Mick's post #69 above). And the peak inflow should be a couple of days after the main rain.
 
Absolutely- from Big Sur north the whole state is very water logged (not that SoCal isnt right now) and putting a pretty good strain on all infrastructure. When there is only a day and half between storms it doesnt take much to be back under the gun again. And now models are hinting that things might not be that dry next week and beyond as it looked yesterday.

In the Bay Area, in my backyard, I have had ~75 inches of rain since Oct 1st.
Looks as though the emergency spillway at Don Pedro may get used, for example:

Source: https://twitter.com/TurlockID/status/833016137948422144
https://twitter.com/TurlockID/status/833016137948422144
 
That said, the forecast keeps changing. I'm 70 miles from the dam (and 200 feet above the top of lake :) We are forecast 3" of rain on monday and it was forecast 1.5" a few days ago.

Speaking of constantly changing forecasts, we (Shingle Springs, CA) went from 3" to 3.9" forecast for monday. The other days went down though, so it looks Monday will be fun.
 
Speaking of constantly changing forecasts, we (Shingle Springs, CA) went from 3" to 3.9" forecast for monday. The other days went down though, so it looks Monday will be fun.

In another life, I used to do project estimating for a construction company. I always thought construction 'estimating' was similar to weather 'forcasting.' My bosses would sometimes ask "We want to know how much this project will cost when complete." I always told them if I knew, it wouldn't be called 'estimating,' it would be called 'knowing.'
 
Last edited:
I do understand that these 6 day QPF forecasts are what they are, forecasts.

Different weather models are going to forecast varying amounts of precipitation, but they do tend to "settle out" and provide a fairly accurate general indicator of weather events to come. The closer to the actual date of the weather event the more the models generally begin to converge and agree.

Up/down with the QPF the models will go from run to run.
I'm pretty sure the NWS is on their toes in this particular area of the country right now.

Generally all the weather models I've looked at today are pretty consistent and in agreement.

There is going to be a good whack of precip in an area that is already very saturated.
Can the Oroville Res. handle it? I'm fairly confident it can and apparently the folks at the DWR believe so too as they are continuing to lower the outflow cfs even as the inflow cfs are increasing.
http://cdec.water.ca.gov/cgi-progs/queryF?s=ORO

I have to assume (I know bad idea) that they are confident that the 47' of "headroom" that they currently have is sufficient to handle the immediate inflow from the upcoming weather event.

Map Source: LINK

02-18_6 day QPF.jpg
 
Last edited:
Given the number of reservoirs at 100% or above
Note that's 100% or more of their historical average levels - not of their respective capacities. At at time when California has seen very heavy rains, I don't think it's particularly unusual or remarkable that reservoirs are running at more than 100% of their historical average levels - that's what they're supposed to do in times like this.
 
Just looking at what happened before, it took four days of inflows averaging ~125k cfs to get the dam from 851 ft to 902. And that was with outflow of under 30,000 cfs three of the four days. Keep in mind those four days (Feb 7-10) were the tail end of an event that dumped far more rain than the current forecasts are calling for. That's the back-of-the-envelope approach; I expect the modelers will confirm it. Maybe we get to 870' or so for the lake level?
Monday looks like the main day for the precip--our forecast (E of Murphys, W of Big Trees) has precip coming in later Sunday, and less of it, than it did earlier--now more on Monday. Of course that water has to make its way down to the lake...
 
Last edited:
Note that's 100% or more of their historical average levels - not of their respective capacities. At at time when California has seen very heavy rains, I don't think it's particularly unusual or remarkable that reservoirs are running at more than 100% of their historical average levels - that's what they're supposed to do in times like this.

Good point.

The climate is dry with extremely wet years partially due to the El Nino cycle in the Pacific Ocean. Averages of years above the historical average including tree ring modeling to go back to 1000ad would be nice. I found a PDF with the Sacramento river modeled to 900ad, looking for a feather river model but may not exist.
CSD2015report-sacrivermodel900ad.jpg

I did not see it until I posted it, but look at the dip in mean flow in the Sacramento river 15 or so years before the dam was constructed. Yeesh nature did not help them understand this river at all, provided a nice deceptive low flow period. Also might have had a lot to do with the decision to build the dam.
 
Last edited:
Found the Feather River inflow to lake Oroville reconstructed historical flow web page. Gives modeled data to 900 ad.

http://www.treeflow.info/content/feather-river-inflow-oroville-reservoir-ca


Figure 3. Reconstructed annual flow for the Feather River flow (901-1977) is shown in blue. Observed flow is shown in gray and the long-term reconstructed mean is shown by the dashed line.
Content from External Source

Figure 4. The 10-year running mean (plotted on final year) of reconstructed Feather River flow, 901-1977. Reconstructed values are shown in blue and observed values are shown in gray. The long-term reconstructed mean is shown by the dashed line.
Content from External Source

hope this is of use.

edit:lag got me, multiposted same image, all fixed now
 
Last edited:
Latest forecast tonight, is for warmer then expected rains for the first day of the storm. Snow levels staying higher. This will cause higher then originally estimated run off in the foothills. Per Fox40 a few moments ago.

Screen Shot 2017-02-18 at 11_47_55 PM.png
 
Last edited by a moderator:
Snow levels are forecast by the NWS to go as high as 7000 feet on Monday but fortunately, colder air will start moving in Monday night and it will continue cooling off through mid week. The whole pattern is shifting to jet stream flow dropping from northwest out of the Gulf of Alaska to southeast in the basin and range region. This means that precipitation that hits California will be colder and will come in lower amounts if the American and European models verify. I think that there's enough storage available now to cover the inflows over the next 10 days. The key is the cold weather in California and the western states.

Here's an upstream NWS forecast for Westwood CA above the 6000 ft level. (not the home of UCLA).
http://forecast.weather.gov/MapClick.php?lon=-120.94419238281252&lat=40.315908860384695#.WKnMXRB6Z3k

The GFS model keeps the west cool for 10 + days following the warm rains on Monday. This forecast of prolonged cool weather in the west and warmth in the southeast reflects long wave atmospheric ridge/trough patterns that can be surprisingly persistent. Credit to Levi Cowan's TropicalTidbits for the map.
19Feb17gfs_T2ma_us_53.png
 
Please try to quote or show images from primary sources - i.e. actual weather forecast models. Avoid linking to articles or tweets that are simple repeating things from other sites.
 
CIMSS Water Vapor imagery shows that the moisture feed for the storm developing offshore of central California. It extends from west of the big island of Hawaii to the California coast. Note that a warm front with an WNW to ESE orientation, appears to be developing from 130ºW to just offshore of central California. That warm front will bring heavy rains up to perhaps the 7,000 foot elevation level. NWS Sacramento warns of wind gusts up to around 60 mph Monday night near Oroville. Monday night will not be a good time to be out.


19Feb23zTPWEPacConus.png
 
I have done a very rough and ready calculations based on most recent inflows and outflows and the statement from William Connelly (source: https://m.facebook.com/story.php?story_fbid=1683579861668957&id=100000508772678 )

He says outflows currently 55K cfs, but could be increased and inflows expected to rise to over 100K CFS.

Conneley comments.PNG

So, the question arises, how long would it take to refill to 900' with 100K cfs inflow and outflows at 60K cfs?

The average net outflow over the past 25 hours has been 17,490 cfs. This has resulted in a reduction in water height from 854.23' to 851.56', or a net reduction of 2.67'.

http://cdec.water.ca.gov/cgi-progs/queryF?s=ORO&d=19-Feb-2017+15:52&span=25hours

If the flow was to reverse to a net inflow of 40,000 cfs, then we might expect the reservoir to rise at just over 6' per 25 hours. It would take just less than 8 days to refill the reservoir to 900' at that rate of net inflow. So, apparently quite safe for now. This calculation doesn't take into account the lower rate of rise that might be expected for the same net inflow as the level rises.

Calcs in the image below.

Oroville Waterflow calculations.png
 
Latest forecast tonight, is for warmer then expected rains for the first day of the storm. Snow levels staying higher. This will cause higher then originally estimated run off in the foothills.

The warm precip, high snow levels, and high levels of warming winds, are conditions leading to accelerated snow melt. Much of the present focus has been on the inches of water to fall as rain. My concern is with the several feet of water held in the form of aged snow on water saturated slopes.
The problem is that it is not possible to fully tease out all of the relevant factors and make an accurate forecast. But the conditions appear to be ripe for a significant release of melt-water.

There may be a very good reason for the amount of work being done to armor the area below the auxiliary spillway. We will likely not be able to get a sense of that until Monday + 2.
 
For reference here are the Oroville Dam design flows of 1980.

Oroville Probable Maximum Flood (PMF) (1980)

The Standard Project Flood at Oroville The standard project flood (SPF) has a peak flow of 440,000 cubic feet per second (cfs) and a 3-day run-off volume of 1,520 thousand acre-feet (taf) and is estimated to inundate close to 292,000 acres. This SPF results from the standard project rainstorm of 96-hour duration depositing 14.3 inches of precipitation on wet ground in the drainage basin above the dam.
1-3 Oroville Facilities Relicensing Team November 29, 2004 fr...................FERC\Final SP-E4.doc
The Probable Maximum Flood for Oroville Dam
The probable maximum flood (PMF) is based on the probable maximum precipitation (PMP), considering both rain and snow, and is used for spillway design purposes. USACE estimated the PMF in 1970 to have a peak flow of 720,000 cfs and a 3-day runoff volume of 2,510 taf and results from a 72-hour storm depositing 21.1 inches of precipitation. The PMF study was updated by USACE in 1980. It showed that the PMF has a peak inflow of 960,000 cfs and an 8-day run-off volume of 5,217 taf (thousand acre-feet).
Content from External Source
Page 1-2; 1-3

The Peak PMF inflow to Lake Oroville is 960,000 cfs.
Table 12.7-1 Summary of the PMF Study by USACE 1980
Drainage Area 3607 square miles.
Sub-basins 18
PMP 28.9 inches.
Month of Storm: January-February
Basis for PMP: HydroMeterological Report No, 36
Butt Valley Dam: Failed
Snowmelt: 4.5 inches
Peak Inflow: 960,000 cfs
Total 8-day Volume 5,217,300 acre-feet.
Content from External Source
SP-E4: FLOOD MANAGEMENT STUDY FINAL REPORT Oroville Facilities Relicensing FERC Project No. 2100
http://www.water.ca.gov/orovillerelicensing/docs/wg_study_reports_and_docs/EO/SP-E4.pdf

PS Drainage area of 3607 square miles = 2308480 acres
Total 8-day Vol of 5,217,300 acre feet over 2,308,480 acres
=> 2.26 ft depth = 27.1" average depth over drainage area.
=> 4.5" snowmelt + 22.6" rainfall average.
(= 5,217,300 acre ft = 2.2726525e+11 cubic ft.)
 
Last edited:
For reference, here are the Oroville Dam design peak inflow and peak outflow from 1983.

The peak inflow into Lake Oroville, including the flow from Butt Valley Dam failure computed in this study was 1,167,000 cfs and occurs at hour 40.

12.8.2 Lake Oroville Storage Routing
The inflow Hydrograph, natural PMF plus Butt Valley Dam-break Flood, was routed through Lake Oroville. The results of routing are shown in Figure 12.8-1 and listed below:
Table 12.8-1 Oroville Dam PMF with Dynamic Routing (1983)
PMP: 28.9 inches
Snowmelt: 4.5 inches
Peak Inflow: 1,167,000 cfs (Occurs at hour 40)
Eight day Inflow Volume: 5,217,300 acre-feet

Initial Elevation: 855 feet
Maximum Reservoir Elevation: 921.4 feet (Occurs at hour 58-59)
Peak Outflow 798,000 cfs
(Occurs at Hour 58-59)
Content from External Source
SP-E4: FLOOD MANAGEMENT STUDY FINAL REPORT Oroville Facilities Relicensing FERC Project No. 2100
http://www.water.ca.gov/orovillerelicensing/docs/wg_study_reports_and_docs/EO/SP-E4.pdf
Page 12-13
 
According to the NOAA California Nevada River Forecast Center, there do not appear to me to be any subfreezing areas within the entire Feather River Basin during the day on either Monday or Tuesday. This is a result of the atmospheric river entraining tropical moisture from the south as it slams into California.
LINK
 
Meteorologist Ryan Maue ‏@RyanMaue Feb 17 tweeted
Source: https://twitter.com/RyanMaue/status/832664845250027520

"Assuming catchment area into Lake Oroville roughly 3000-4000 sq miles represented by circle: 6" rain = 0.5 Trillion gallon rainfall input."
Content from External Source
6" Rain on 3607 mi2 #Oroville #Dam catchment = 1650000 Acre Ft
= 22%
of 8 day design inflow volume of 5217300 acre-feet
Simply scaling to 22% of Peak Outflow of 798000 cfs suggests
Spillway flows of 177,000 CFS? bit.ly/2m24ZAA

That suggests 177% of the 100,000 CFS flow over the damaged spillway!


(Please check conversions & calculations)


No. Not all of that will run off. See:

https://www.reddit.com/r/orovilledam/comments/5v1foe/the_upcoming_storm_may_be_a_nailbiter/

This estimate says they could keep outflows at the current level and end up filling to 890 feet. The peak of the storm dissipates in storage and doesnt have to flow through the spillway as a peak value.
 
Some random redditor with back of the napkin calculations is hardly a good source.
Right. Anyone can do the basic math in 2 minutes:

3600 sq mi, 2.3 million acres
Say 7 inches rain, 66% yield
= 885,000 ac-ft

Say that comes in in 4 days, then outflow = 60000 cfs (they raised today) = 480000 ac ft out

= net 400,000 ac ft gain

==> bump up to 3.2 million ac ft from here

==> 880 feet, not too far off. [Edit: The reddit version used 55000 cfs out flow. If we use that here, theres a net 440,000 ac ft gain in storage, which means about 885 feet - darn close]
 
Say 7 inches rain, 66% yield

You're getting 66% where? From some random redditor.

Bottom line is I assume about 66% of the precipitation will run off to the reservoir in the near term. This factor is a poor man's way of accounting for snow, evapotranspiration and other factors. In other words, I estimate about 4.6 of the total 7 inches will run off in the coming week.
Content from External Source

There are multiple posts in this thread discussing that. Its reasonable.
 
There are multiple posts in this thread discussing that. Its reasonable.

It varies
https://water.usgs.gov/edu/watercyclerunoff.html
As with all aspects of the water cycle, the interaction between precipitation and surface runoff varies according to time and geography. Similar storms occurring in the Amazon jungle and in the desert Southwest of the United States will produce different surface-runoff effects. Surface runoff is affected by both meteorological factors and the physical geology and topography of the land. Only about a third of the precipitation that falls over land runs off into streams and rivers and is returned to the oceans. The other two-thirds is evaporated, transpired, or soaks (infiltrates) into groundwater. Surface runoff can also be diverted by humans for their own uses.
Content from External Source

Thats a generalized number, there's a link to a USGS report on the first page of this thread that says it's 60% on average during the year, including the dry season for the Feather River Basin. There is a discussion that follows that indicates it could be a bit more. For a big rain, it typically is more.

Edit: On page 3 I posted details of the Oroville Dam PMF. Yield goes up to 86 % for that storm.
 
Last edited:
It varies
https://water.usgs.gov/edu/watercyclerunoff.html
As with all aspects of the water cycle, the interaction between precipitation and surface runoff varies according to time and geography. Similar storms occurring in the Amazon jungle and in the desert Southwest of the United States will produce different surface-runoff effects. Surface runoff is affected by both meteorological factors and the physical geology and topography of the land. Only about a third of the precipitation that falls over land runs off into streams and rivers and is returned to the oceans. The other two-thirds is evaporated, transpired, or soaks (infiltrates) into groundwater. Surface runoff can also be diverted by humans for their own uses.
Content from External Source

The storm will result in high ambient humidity. This will reduce rainfall evaporation.
In February, with cold temperatures and restricted sunlight (due to the storms), the transpiration of forest growth will be reduced.
The ground is presently saturated with the effects of prior rainfall. This will result in increased runoff, and a more rapid runoff.
There is significant snow pack. This will be aged snow largely devoid of the 90% air found in new snow. It will have acted as a sponge and absorbed the prior rainfall. This will result in the snow readily converting to liquid water under additional precipitation and warm temperatures.
Winds are forecast to be both high speed, with gusts to 60 mph, and warm. The wind effects will accelerate snow melt.

It will be interesting to watch the reservoir inflows starting tomorrow night.
 
Status
Not open for further replies.
Back
Top