Oroville Watershed Weather Forecast, Lake Level and Inflow Calculations

Status
Not open for further replies.
CRM 114 this what your looking for?

Snow pack vs water content for Feather Valley Region

Station Name ID Elev. Date/Time Value
BUCKS LAKE BKL 5750' 02/16/2017 11:00 37.44"
FOUR TREES FOR 5150' 02/16/2017 11:00 21.48"
GOLD LAKE GOL 6750' 02/16/2017 11:00 42.84"
GRIZZLY RIDGE GRZ 6900' 02/16/2017 11:00 31.08"
HARKNESS FLAT HRK 6200' 02/16/2017 11:00 27.76"
HUMBUG HMB 6500' 02/16/2017 11:00 35.28"
KETTLE ROCK KTL 7300' 02/16/2017 11:00 34.20"
PILOT PEAK (DWR) PLP 6800' 02/16/2017 11:00 48.39"
RATTLESNAKE RTL

Source: http://cdec.water.ca.gov/cgi-progs/getAll?sens_num=3


Yes, that is great, thank you. Looks by eyeball to be about 30 inches average, but somewhere, some agency has probably taken this data and computed an average snowpack for the basin, taking into account elevation, etc in a fairly complex model.
 
Absolutely. Not only does it show that the majority of the watershed is below the 5500ft. snow line (my visual est.), but it reveals the presence of Nine!! upstream (N. fork Feather River) powerhouses (with reservoirs). Boy, I didn't see *that* coming.

That said, the document reveals an extensive network monitoring and modelling capacity for the Oroville reservoir inflow, which I trust is calibrated and functional.

Yes, they mentioned CA DWR has their own model too, but I am not sure if they are using two different models. I am sure either is an impressive modeler myself, I know they have their limitations.
 
At least it looks like they're catching a break at the construction site weather wise today. The choppers are still flying and the trucks are still hauling in fill material.
Live webcam_02-16-17_1.30 pm CST.jpg
Live webcam_02-16-17_1.30 pm CST

It does look like there is going to be a pretty good rain event in the direct vicinity of the reservoir.
How much as direct rain runoff and how much as snow is YTBD ...

6 day QPF from CNRFC initiated 02-16 @ 4 am.jpg
6 day QPF from CNRFC initiated 02-16 @ 4 am
 
Yes, that is great, thank you. Looks by eyeball to be about 30 inches average, but somewhere, some agency has probably taken this data and computed an average snowpack for the basin, taking into account elevation, etc in a fairly complex model.

upload_2017-2-16_15-57-0.png
 
https://earth.nullschool.net/#current/wind/isobaric/250hPa/orthographic=-158.78,26.36,1075

20170216-140544-0oe9g.jpg

You-all were talking about the jet stream and atmospheric rivers, and I really like the visualization at the above link for that. I've found that it really helps me in interpreting the weather forecast for northern California where we really do have drastic differences in weather in fairly small geographic areas. I'm usually looking to see if the storm is likely to be pushed north, and in this case, I'd say that no, the storm is not getting pushed north.

Enjoy the tool.

That is a nice site, but understand that 250mb winds (Jet Stream) are/is completely unrelated to available moisture. As you noted, it is very useful for depicting the "steering winds" which push around the weather producing systems below it.
In case you missed the link to Atmospheric River data, it's http://mead.ucsd.edu/?page_id=676
Currently forecast to be impactful on the 20th.
 
Updated at press conference to be 5,000cfs increments at 2hr intervals until 80,000cfs target hold.

Posted in other thread but will add here...

I'm sure after monitoring lower flow rates next 2-3 days and not see any back erosion/or new issues arise was mentioned by Sunday they may try to go down to around 60,000 cfs.

"Incident plans from the DWR, Cal Fire and Butte County Sheriff's Department call for water releases to begin to taper on Saturday, settling Sunday to around 60,000 cubic feet per second."

Source http://www.latimes.com/local/lanow/la-me-ln-oroville-weather-forecast-20170216-story.html
 
Outflows fallen to around 80K cfs, as they said it would. Interestingly, inflows still low, despite rain. Lake level still falling quite rapidly.

[GALLERY=media, 58]Oroville Water Flow 20170216 by David T posted Feb 17, 2017 at 12:30 AM[/GALLERY]
 
I'm no weather expert, but it seems to me that if this QPF forecast image for the next 6 days is remotely accurate this is the worst possible geographic location and at the worst possible time.

02-16-17_QPF.jpg

That's a lot of water (in whatever form it takes) directly in an area that doesn't need anymore at this particular time.

The runoff liquid in that basin is going to have to pass through the "damaged" Oroville dam orifices at some point in the future on it's way to the Pacific.

I think the residents of the area could use a break and the people managing and working the situation at Oroville Reservoir could also use a few days to fully assess the situation and take a few deep breaths.

Unfortunately Mother Nature does not respect feeble human attempts at containing her capabilities.

Edit to add:

The forecast 10.42" 'balloon' in the image above is in the terrain directly above Oroville Reservoir, it is well below 4,000 ft elev.
 
Last edited:
Outflows fallen to around 80K cfs, as they said it would. Interestingly, inflows still low, despite rain. Lake level still falling quite rapidly.

[GALLERY=media, 58]Oroville Water Flow 20170216 by David T posted Feb 17, 2017 at 12:30 AM[/GALLERY]

It takes awhile for inflow to ramp up, as there is a traveltime. There is some fairly impressive accumulation so far, but depending on the basin, the first inch or two can be mostly absorbed in soils and depressions and slowly released.

https://cdec.water.ca.gov/precip_maps/nca_24HRprecip.html
 
Not sure there will be much snow since NWS Reno is saying Truckee will get torrential rain:

On monday, that's when the storm is supposed to be warmer. Still snow at Mammoth though (7880 ft)

Of course that higher rain will melt some of the earlier snow, causing more water. But by then the lake level should be plenty low enough.
 
I'm no weather expert, but it seems to me that if this QPF forecast image for the next 6 days is remotely accurate this is the worst possible geographic location and at the worst possible time.
That's a lot of water (in whatever form it takes) directly in an area that doesn't need anymore at this particular time.

Here's what the NWS had to say about it this afternoon:

Extended models continue to show the strongest system in the
forecast period moving in by early Monday and continuing into
Tuesday. While there have been some variations in the exact track
of the storm, confidence is high for moderate to heavy
precipitation for the northern Sierra/southern Cascades. What is
trickier is which area will be the focus of heaviest
precipitation, whether it will be over the Feather River basin or
over the American River basin. It looks like the most favorable
area will be over the Feather River Basin, with 4 to 8 inches of
rain/water equivalent for Monday and Tuesday.
Content from External Source

In addition to the forecast 4 to 8 inches of rain there is also existing snowpack of around 30" in the watershed.

Mick reports the following:

On monday, that's when the storm is supposed to be warmer.
Content from External Source
Temperatures above freezing are forecast through to Wednesday. Overnight lows remain above freezing. I am not sure how to model the effect but rain and above freezing temps will melt the existing snowpack. The implication of this is that the drainage throughout the watershed will result in significant inflows to the Oroville reservoir.
 
whoosh, that is a good positive statement by the NWS.

I think the Feather Yuba drainage into the Oroville Res. can handle that in the near term.

Fingers crossed for all those below, I really mean that.

They (being those on the ground) really could use a break.
 
whoosh, that is a good positive statement by the NWS.

I think the Feather Yuba drainage into the Oroville Res. can handle that in the near term.

Fingers crossed for all those below, I really mean that.

They (being those on the ground) really could use a break.

Yes they could. There's nothing on the GFS after Wed. for a week.
At least the equipment operators will get a rain day or two before then :)
 
In addition to the forecast 4 to 8 inches of rain there is also existing snowpack of around 30" in the watershed.

Temperatures above freezing are forecast through to Wednesday. Overnight lows remain above freezing. I am not sure how to model the effect but rain and above freezing temps will melt the existing snowpack. The implication of this is that the drainage throughout the watershed will result in significant inflows to the Oroville reservoir.

We'll see. I'm sure that the process of snowpack conversion to surface water is more complicated. It's a 30" snowpack. Think about how rain falls through that, and how it's top surface melts when exposed to 40F air temps, while noting that the lower 28" of snow are increasingly colder and more dense from packing. Water doesn't move through it all so easily. Rainfall may even freeze within the snowpack and not run off for weeks.

The bigger contributor to snowmelt is direct sunlight radiation, so cloud cover and forest shade need to be taken into account. There should be both local and professional knowledge about how long it takes each spring to melt the pack, though I understand there hasn't been much experience with that in recent years.

Here's a site we can monitor it by.

upload_2017-2-16_22-59-54.png
 
I found the snowpack data at:

http://www.cnrfc.noaa.gov/ol.php?pr...e=precipValues&dataTable=false&mapBG=esriTopo

You can download KML files in Google Earth to get this:

upload_2017-2-16_21-34-18.png

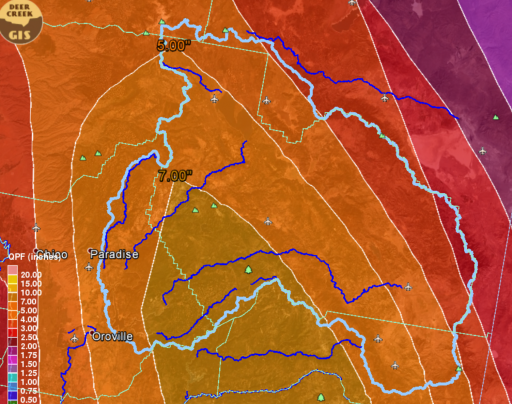
Light blue line is Oroville basin; numbers are snowpack in water equivalent inches. Text labels are SWE (Snow Water Equivalent) at various stations.

Here's a color key:

upload_2017-2-16_21-36-41.png

Very roughly, fwiw:
~ 50% snow cover, 30 inches water average
- assume 80% yield
- 3600 sq mi drainage

= 1.1 2.3 million acre-feet (for reference the drawdown from 901 to date has been about 0.5 million ac-ft)
= about 7 14 days to run through spillway at current discharge rate of 80,000 cfs

But there is significant groundwater storage in this basin that is depleting, so lets say the current "base inflow" is close to that at ~20,000 cfs for the next few weeks. So that leaves about 60,000 cfs net discharge capacity for incoming rains and snowmelt. Per earlier discussion, about 1.2 inches of rain in a day will net maybe the equivalent of a a day of discharge at 90,000 cfs.

For perspective:
Assuming a net 60,000 cfs they can use to deplete storage or pass rain / snowmelt, and a seven day planning period, you have 0.5 million acre feet of flood storage, which would require about 70,000 cfs 35,000 cfs inflow to fill up in seven days for a total of 130,000 95,000 cfs net rain/snowmelt (above baseflow) over 7 days. This is 1.7 1.2 inches per day or 12 8.4 inches total rain / snowmelt average over the basin to refill to the brim of the emergency spillway.

I could make a case there is no issue for the upcoming storm, if something like 5 inches of rain occurs over the next 7 days and there isn't much snowmelt. In that case, maybe the reservoir level never even rises.

Or I could pay attention to some of the wilder weather models I am seeing (and perhaps misinterpreting), especially the ones with 10+ inches in the next 7 days with very warm heavy rains on Monday and say there could be a serious risk of overtopping the emergency spillway again. Rain on snow can be very bad, but I am not a California person and cannot say if that's a risk at this stage of the season.

Please don't read much into this - I am an amateur in hydrology, and have zero experience in California, and these are back of the envelope calcs with errors at best.

Another possibility is this storm just succeeds in building the snowpack and you get yet another wave in another week.
 
Last edited:
Please don't read much into this - I am an amateur in hydrology, and have zero experience in California, and these are back of the envelope calcs with errors at best.
Content from External Source
I am an amateur in almost everything. o_O

But this is a fascinating topic. SWE stands for Snow Water Equivalent. For Bucks Lake within the Oroville watershed the current SWE is 36 inches. That is a lot of water once it turns to runoff.

- having problems inserting image of Bucks Lake data here.


http://portal.chmi.cz/files/portal/docs/poboc/CB/snowmelt/print.htm#page_5.0.0

The snow-to-liquid ratio, or SLR, is the SWE expressed as a ratio of the height of the snowpack compared to the height of the liquid produced when it is melted.
Both SLR and SWE are gauges of the density of a snowpack. SLR values typically range from around 20:1 for fresh snow that fell in temperatures well below freezing, to 2:1 for snow that has been windblown, aged and is near 0°C.

Content from External Source
30 inches fresh snow = 1.5 inches meltwater [ 20 to 1 ratio ]

30 inches aged snow = 15 inches meltwater [ 2 to 1 ratio ]


There are two types of snow metamorphism: dry and wet.
During dry metamorphism, no liquid water is present and temperatures are usually well below freezing. SWE may be increased or decreased, depending on circumstances.

During wet metamorphism, the temperature is near the freezing point and liquid water is present. Melting and refreezing results in significantly higher SWEs.
Content from External Source

The snowpack in the Oroville drainage has already been subjected to warm rain. Liquid water is therefore likely to be present. It is likely this liquid water has undergone melting and refreezing in the weeks since the end of January precipitation. Overnight temperatures are forecast to be above freezing until Wednesday February 22nd. These factors all suggest a higher SWE.

There are a huge number of variables in play here with most of them unknown. Based on past history, I would expect Monday's forecast of warm rain to not arrive as reservoir inflow until towards the end of next week. That gives lots of time to armor the emergency spillway and shutdown and inspect the flood control spillway.
 

Content from External Source
But this is a fascinating topic. SWE stands for Snow Water Equivalent. For Bucks Lake within the Oroville watershed the current SWE is 36 inches. That is a lot of water once it turns to runoff.

- having problems inserting image of Bucks Lake data here.

You can just use SWE. Take all the snow, melt it, and the SWE is equivalent to the amount of runoff if it were all rain. So at Buck's Lake, there is 3 feet of water sitting on the ground bound up as snow. It's mind-boggling.
 
Hi guys just found this site and it's great for information, makes me want to leave town again but still good to have. I've been paranoid with the thought of the dam reaching 901 again to the point I've built an excel I've been updating to have an idea when we will reach our 50 foot goal(I understand that it's not 100% clear at 50 feet). Here is the file for others if you would like. Link: https://drive.google.com/open?id=0B2aLFCgkLH9bQVNwVHpFd0tWLUk

I am a tinker and have built a script to turn my Raspberry Pi into a warning system, I had an LED board that I designed for a cpu monitor that I show on my YouTube (Kicker22004) for it and am using it to let me know the level of the dam just by led lights, The script, flashes all LED's at 898 feet and sounds an alarm,send text(s), and email man and family at 899 Feet. I'm preying I don't need this Pi to ever sound. But it's just in case.
 
The real question becomes ..who has the old school slide rule up above.

There are a lot of gauges and measurements ?
 
Hi guys just found this site and it's great for information, makes me want to leave town again but still good to have. I've been paranoid with the thought of the dam reaching 901 again to the point I've built an excel I've been updating
...
I am a tinker and have built a script to turn my Raspberry Pi into a warning system, I had an LED board that I designed for a cpu monitor that I show on my YouTube (Kicker22004) for it and am using it to let me know the level of the dam just by led lights, The script, flashes all LED's at 898 feet and sounds an alarm,send text(s), and email man and family at 899 Feet. I'm preying I don't need this Pi to ever sound. But it's just in case.

Welcome, Kicker. I take it that you live in the evac. zone. (curious what percentage of this group does)
I can relate to the tinkering, and the concern. If I were in that situation, I'd monitor res. el. at a much lower level, say 580, or half way from whenever I adjust it; and another alert for spillway release rate <40,000; and maybe another for inflow >50,000 ..... and script these triggers to phone and SMS me. (cron curls and shell scripts)
I like the local LED/alarm setup though.
 
The real question becomes ..who has the old school slide rule up above.

There are a lot of gauges and measurements ?

I couldn't find the slide rule "up above", but I do have a collection of them; wooden 12"+ with magnifier; wood and plastic pocket sizes; even a metal circular. In some box around here with ancient drafting tool sets; maybe even an abacus :)

CDWR links for precipitation gauges and upstream reservoirs. These are tabular data, with links to time plots.

For planimetric plots, play with the CNRFC site.
 
Welcome, Kicker. I take it that you live in the evac. zone. (curious what percentage of this group does)
I'm a half mile from the dam to the east. Not in the evac zone as I'm on the ridge above the dam/lake. We've had steady rain for the last hour and the helicopters are still dropping bags.
 
The Lake Oroville rain sensor seems not to be working, I clicked around to find one that is:
http://cdec.water.ca.gov/cdecstation2/
20170217-094316-sd3go.jpg
There's the Bucks Creek Powerhouse (BUP) sensor which gives daily rainfall totals.
http://cdec.water.ca.gov/cgi-progs/queryDaily?s=BUP

Here's the last 30 days:
upload_2017-2-17_9-30-58.png

With the rainfall, inflow, and outflow, the peaks (even one day peaks) are not incredibly important to the level of the lake. The important thing is the AREA under the graph. The early february storm had a peak of 3.55 inches, but the total area under the line (i.e. the sum of the days feb 2 to feb 10 is 17.5 inches (1.35+1.0+0.93+1.30+2.87+2.45+3.55+3.37+0.68 interpolating a value of 1.0 for Feb 3)

30 Days of Oroville total inflow. Notice the peak inflow is about 2 days after the rainfall peak
upload_2017-2-17_9-31-20.png

Outflow. The vertical scale here is half the above graph. Basically they were planning to ramp up outflow to match inflow - probably up to 120K, maybe even 150K. They wanted to avoid flooding downstream. But then the problem occurred.
upload_2017-2-17_9-33-55.png

Lake level notice how before the peak inflow it's around 850-855. Then they start ramping up the outflow and are actually a bit ahead of the inflow, as the level dips. Then the problem occurs.
upload_2017-2-17_9-32-52.png

So it will be interesting to view these graphs again in a week. Fingers crossed there are no more problems with the main spillway.
 
The good news is the 6 day QPF forecast is heading in the right direction, as in it's forecast to precipitate less than was forecast yesterday.

02-17-17_QPF_.jpg
 
Last edited:
The good news is the 6 day QPF forecast is heading in the right direction, as in it's forecast to precipitate less than was forecast yesterday.

Yah, BrokenLug. In part :) it's no longer counting the rain between then and now :) ..... and of course, models wobble a bit anyway. I'm sure we'll keep watching. Snow level currently projected to be above the passes.
 
Mick, it is at least incrementing; can't say that it's correct however.

upload_2017-2-17_12-29-24.png
Source: cdec.water.ca.gov/cgi-progs/queryF?s=ORO

Actually yes it does look like the accumulated sensor is working.
upload_2017-2-17_10-40-32.png
(Here the peaks are the only thing that matters)

However the Feb 2 to feb 10 difference is 27.5 to 34.5. So just 7 inches vs. 17.5 inches for Buck's Creek.
 
That is a nice site, but understand that 250mb winds (Jet Stream) are/is completely unrelated to available moisture. As you noted, it is very useful for depicting the "steering winds" which push around the weather producing systems below it.
In case you missed the link to Atmospheric River data, it's http://mead.ucsd.edu/?page_id=676
Currently forecast to be impactful on the 20th.

For a nice wide view of the incoming water vapor, try the GFS / Pacific Sector / Precipitable Water loop at http://weather.cod.edu/forecast/
Nam, Nam4k, and others, will have higher resolution maps of P.W., 6 hour, and total precip.

http://www.tropicaltidbits.com/analysis/models/ is also good. The big lake on their map is Alamanor; Oroville and its watershed are to the S/SW.
 
Last edited:
wxBell has added an Oroville area map to their presentation of the NWS NCEP WPC QPF (o_O National Weather Service National Centers for Environmental Prediction Weather Prediction Center Quantitative Precipitation Forecast):

http://weather.graphics/hpc/wpc_precip.php

The Oroville map is accessed with dedicated button on the right of the page.

This is nice because you can look at 6hr/24hr/cumulative precip at 6 hour intervals out to 4 days and 12 hour intervals out to 7 days.

They do clip the eastern part of the watershed but that's not much of the runoff missed.
 
Latest 6-day precip model:

upload_2017-2-17_17-11-29.png

upload_2017-2-17_17-13-17.png

Light blue is Oroville drainage basin. Looks like an average of about 6 inches to me.
 

Attachments

  • upload_2017-2-17_16-51-2.png
    upload_2017-2-17_16-51-2.png
    2.4 MB · Views: 390
Down to around 70 cfs now
OUTFLOW INFLOW RIV REL RAIN BAT VOL
(PST) FEET AF CFS CFS CFS INCHES VOLTS
02/17/2017 05:00 861.81 2969926 80014 29734 93210 35.36 13.5
02/17/2017 06:00 861.47 2965184 79963 23018 92987 35.36 13.4
02/17/2017 07:00 861.18 2961145 79799 26991 92771 35.48 13.5
02/17/2017 08:00 860.86 2956692 79908 28930 92958 35.60 13.4
02/17/2017 09:00 860.61 2953217 79792 31527 92821 35.72 13.4
02/17/2017 10:00 860.27 2948495 79898 31627 92531 35.80 13.4
02/17/2017 11:00 860.07 2945720 79823 35530 92287 35.84 13.4
02/17/2017 12:00 859.75 2941283 79860 34819 92498 35.88 13.4
02/17/2017 13:00 859.30 2935052 79574 14683 92531 35.96 13.4
02/17/2017 14:00 859.08 2932010 75138 24780 89174 36.08 13.4
02/17/2017 15:00 858.78 2927864 75127 33292 87481 36.16 13.4
02/17/2017 16:00 858.55 2924688 70241
 
Status
Not open for further replies.
Back
Top