Claim: Rainwater should always have zero aluminum
Source: 05:20 Francis Mangels: "Should [aluminum] be in the rain? Absolutely not!"
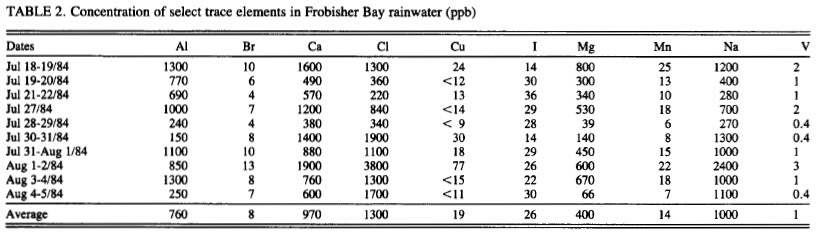
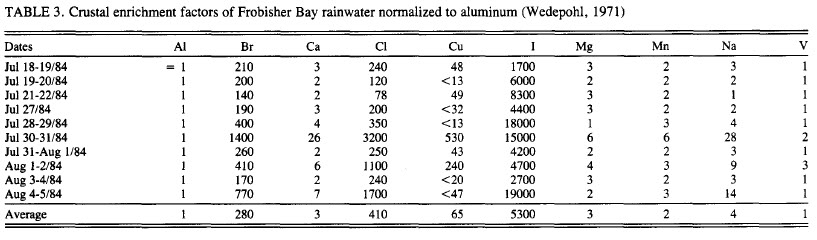
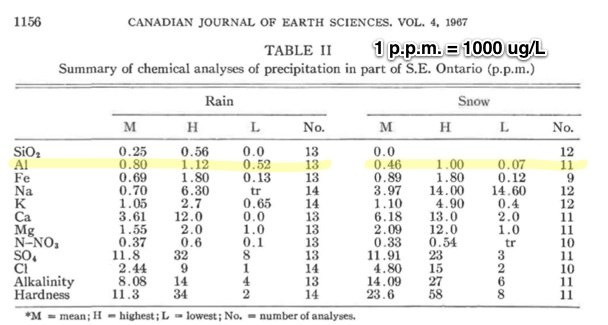
Status: False. Since the Earth's crust is 8% aluminum, and soil varies between 2 and 30% aluminum, then windblown dust from soil and the weathering of rocks (often hundreds of miles away) will naturally contain aluminum. When it rains, the rain clears the skies of dust. Hence aluminum is expected in rainwater in varying, almost random amounts:
Source: A PRELIMINARY STUDY OF THE COMPOSITION OF PRECIPITATION IN S.E. ONTARIO, Canadian Journal of Earth Sciences, Vol 4, 1967
Claim: "Respiratory Mortality in the continental US has gone from 8th on the list to 3rd in just six years"
Source: 00:09:26 Dane Wiginton:
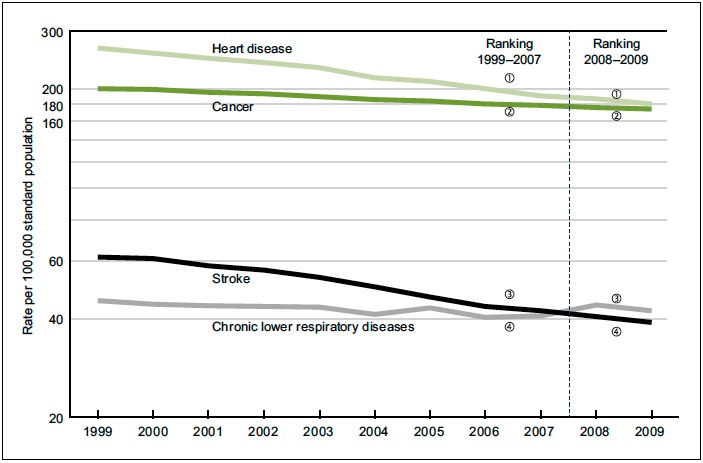
Status: False. Respiratory Mortality did move from 4th to 3rd, however the rate did not change, this was due to a decrease in the mortality from strokes.
Reference: http://www.cdc.gov/nchs/data/databriefs/db64.pdf
Source: 05:20 Francis Mangels: "Should [aluminum] be in the rain? Absolutely not!"
Status: False. Since the Earth's crust is 8% aluminum, and soil varies between 2 and 30% aluminum, then windblown dust from soil and the weathering of rocks (often hundreds of miles away) will naturally contain aluminum. When it rains, the rain clears the skies of dust. Hence aluminum is expected in rainwater in varying, almost random amounts:
Source: A PRELIMINARY STUDY OF THE COMPOSITION OF PRECIPITATION IN S.E. ONTARIO, Canadian Journal of Earth Sciences, Vol 4, 1967
The figures for aluminum in rain above are 0.52 to 1.12 ppm, which is 520 to 1120 ppb, mcg/L or ug/L
As a prelude to the study of chemical weathering of rocks and soils in S.E. Ontario, a study of the composition of precipitation waters at 12 sites within the area was initiated. Analyses of bulk precipitation of both rainfall and snowfall are presented and compared with similarly derived results in other areas.
The silica and aluminum contents are regarded as being high, although in snow silica is absent and aluminum is quite high. Areal differences in silica content appear to be connected with local differences in lithology. Iron occurs in the same concentrations as aluminum and is probably derived from atmospheric dusts. The sodium content is high, especially when compared with inland sites in other areas. Potassium is generally somewhat lower than sodium. Although the calcium content may reflect local differences in lithology, the dissolved magnesium is surprisingly uniform. Lithological differences in tne area are also reflected in the significantly higher nitrate-nitrogen concentrations in the limestone area. Snowfall is markedly high in sulfates, which is considered to be a function of climatic and industrial causes. The high chloride concentrations in such a 'non-marine' environment are not explained.
...
Reliability of the Data
The samples contained dry fall-out and dust settling on the gauges so that they were filtered before examination in order to remove the undissolved particles. The overall accuracy of the data is difficult to assess. Microbial activity in the water samples can alter chemical concentrations of nitrates, but has much less effect on other constituents. Large integrated samples of pre- cipitation can give no more than an average for the period concerned. It is realized that the figures presented give only general indications of ionic levels in precipitation, and a more accurate picture will emerge when sampling is more frequent. For reasons stated above, the comparison of these results with those
of other workers must be considered with caution. As far as possible, com- parisons will be made with analyses of bulk precipitation where this is known for certain. However, with respect to soil weathering, the analyses of rainwater should be more relevant than those of bulk precipitation, although the differ- ence may be hardly significant.
The literature has an unexpected paucity of analytical results for the con- tents of Al and Fe rainwater and snow. In fact, no data for Fe could be found and only the results of Feth et al. (1964) for Al in snow could be brought to light.
...
Aluminum
As aluminum is geochemically stable, the figures for this element in Table I must be considered high for both snow and rain. The aluminum content of rainfall is similar to silica but significantly higher for snow. The figures are of the same order of magnitude as those recorded for the St. Lawrence River (Clarke 1924), for lake and river water (Rankama and Sahama 1949), and for snow (Feth etal. 1964).
Claim: "Respiratory Mortality in the continental US has gone from 8th on the list to 3rd in just six years"
Source: 00:09:26 Dane Wiginton:
Status: False. Respiratory Mortality did move from 4th to 3rd, however the rate did not change, this was due to a decrease in the mortality from strokes.
Reference: http://www.cdc.gov/nchs/data/databriefs/db64.pdf
Do leading causes of death change rank?
Between 1980 and 2007, the three leading causes of death (heart disease, cancer, and stroke) did not change in order of ranking. In 2008, however, chronic lower respiratory diseases replaced stroke as the third leading cause of death, and stroke fell to the fourth leading cause (6ranking order remains in 2009 (3). It is worth noting that because deaths from heart disease have tended to decrease throughout the 1980–2009 period, it is likely that at some point in the near future heart disease will no longer be the leading cause of death in the United States.) (Figure 6). This
Figure 6. Age-adjusted death rates for leading causes of death: United States, 1999–2007 and preliminary 2008 and 2009
NOTES: Rates are plotted on a logarithmic scale. Leading causes of death from 1999 through 2007 were, in order: heart disease, cancer, stroke, and chronic lowerrespiratory diseases. Leading causes of death for 2008 and 2009 were, in order: heart disease, cancer, chronic lower respiratory diseases, and stroke.SOURCE: CDC/NCHS, National Vital Statistics System, Mortality.
Last edited: