Chemical Composition of Rain and Snow - Aluminum, Barium, etc.

Mick West

Administrator
Staff member
These figures of the concentration of aluminum in rain and snow match WITWATS/Mangels figures quite well, 520 ug/l to 1120 ug/L
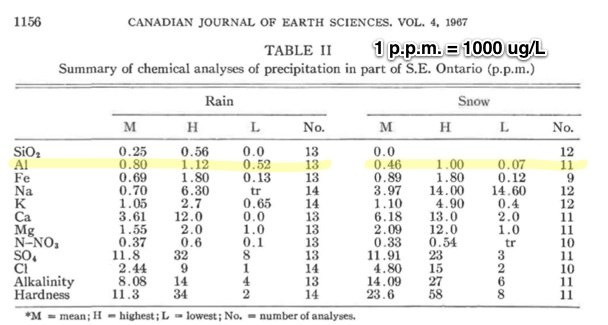


A PRELIMINARY STUDY OF THE COMPOSITION OF PRECIPITATION IN S.E. ONTARIO
G. K. RUTHERFORD
Department of Geography, Queen's University, Kingston, Ontario, Canada
Received April 14, 1967
As a prelude to the study of chemical weathering of rocks and soils in S.E. Ontario, a study of the composition of precipitation waters at 12 sites within the area was initiated. Analyses of bulk precipitation of both rainfall and snowfall are presented and compared with similarly derived results in other areas.
1 he silica and aluminum contents are regarded as being high, although in snow silica is absent and aluminum is quite high. Areal differences in silica content appear to be connected with local differences in lithology. Iron occurs in the same concentrations as aluminum and is probably derived from atmospheric dusts. The sodium content is high, especially when compared with inland sites in other areas. Potassium is generally somewhat lower than sodium. Although the calcium content may reflect local differences in lithology, the dissolved magnesium is surprisingly uniform. Lithological differences in tne area are also reflected in the significantly higher nitrate-nitrogen concentrations in the limestone area. Snowfall is markedly high in sulfates, which is considered to be a function of climatic and industrial causes. The high chloride concentrations in such a 'non-marine' environment are not explained.
...
Reliability of the Data
The samples contained dry fall-out and dust settling on the gauges so that they were filtered before examination in order to remove the undissolved particles. The overall accuracy of the data is difficult to assess. Microbial activity in the water samples can alter chemical concentrations of nitrates, but has much less effect on other constituents. Large integrated samples of pre- cipitation can give no more than an average for the period concerned. It is realized that the figures presented give only general indications of ionic levels in precipitation, and a more accurate picture will emerge when sampling is more frequent. For reasons stated above, the comparison of these results with those
of other workers must be considered with caution. As far as possible, com- parisons will be made with analyses of bulk precipitation where this is known for certain. However, with respect to soil weathering, the analyses of rainwater should be more relevant than those of bulk precipitation, although the differ- ence may be hardly significant.
The literature has an unexpected paucity of analytical results for the con- tents of Al and Fe rainwater and snow. In fact, no data for Fe could be found and only the results of Feth et al. (1964) for Al in snow could be brought to light.

...
Aluminum
As aluminum is geochemically stable, the figures for this element in Table I must be considered high for both snow and rain. The aluminum content of rainfall is similar to silica but significantly higher for snow. The figures are of the same order of magnitude as those recorded for the St. Lawrence River (Clarke 1924), for lake and river water (Rankama and Sahama 1949), and for snow (Feth etal. 1964).
 

Attachments

  • 1967 A PRELIMINARY STUDY OF THE COMPOSITION OF PRECIPITATION IN S.E. ONTARIO - G.K RUTHERFORD .pdf
    5 MB · Views: 2,018
Last edited:
A biblography of articles pertaining to the subject. Use of keyword search for words such as trace metals, aluminum, barium, strontium, etc. will get you some good references. I would like to find some of these online as historical references thouroughly debunk the present claims that something has changed in he past ten years correlating to purported geoengineering.

A bibliography : the long-range transport of air pollutants and acidic precipitation

http://www.archive.org/stream/bibliographylong00onta/ABIBLIOGRAPHY_00_SNSN_04243_djvu.txt
 
It's a problem. And one that is probably illustrated by the wildly different test results they get.

What they really need to do is take multiple samples on the same day.

These results illustrate clearly the importance of sample handling protocols in measuring
trace metals, particularly Cd, Zn and Pb, at the microgram per litre level and below.
We emphasize that the differences found in this study are not related to laboratory
procedures. A class-l00 clean-room laboratory and associated analytical methods were used
throughout the study. It is inevitable, nonetheless, that improvements in sample handling
methods developed for fieldwork will also have had some effect on contamination control
in the clean laboratory itself.
We have not reported here data for dissolved Fe and Mn, for which we have found
major contamination problems at the levels normally encountered in riverine waters.
In intercalibration exercises with other laboratories, in which sample-bottle preparation,
protection in plastic bags, and unwrapping methods were tested along with actual sample
taking protocols, we have determined that all of these aspects can lead to substantial (order
of magnitude) contamination artefacts, especially for Zn and Pb. This means that to ensure
reliable freedom from artefacts, all phases of the sampling operation, from the initial
cleaning of bottles through to their rewrapping and storage for return to the laboratory,
must be under the direct control of persons skilled in the protective measures outlined in
this paper. Under no circumstances should samples be handled by unskilled personnel.
 
Well, quite. It seems that in this context the sets of 'chemtrail believers' and 'skilled personnel' may not only fail to intersect, but turn out to be mutually exclusive.
 
http://www.cap.org/apps/docs/committees/chemistry/trace_metals_survey11.pdf

Trying to Foil Aluminum Contamination

Because aluminum is ubiquitous in the environment, it is very easy for an aluminum result to be falsely elevated due to contamination that occurs either during specimen collection or during the analytic phase of testing. Supplemental questions that were included in the R-B 2009 mailing were intended to assess current practices of Survey participants.
Approximately one third of participants who answered question #1 accept containers other than royal blue tubes for aluminum analysis. To minimize pre-analytic contamination, it is important for the laboratory to inform clients of proper collection techniques, including the use of an appropriate collection container. The ideal container is a manufacturer-certified trace element-free tube. Another option is to test each lot of sample tubes prior to providing them to clients, comparing results from a representative sample of tubes from a particular lot with those obtained using a certified container. Labs should recommend the use of royal blue tubes and, if a sample is received in another sample tube, document this on the report to indicate the possibility of contamination.

Approximately one third of participants who answered question #2 perform aluminum testing in a clean room. Because many building materials, including ceiling tiles, contain aluminum, sample contamination by dust is a serious concern. The best way to minimize contamination during the analytic phase is to perform testing in a clean area that is dedicated to aluminum testing and regularly cleaned by wet wiping flat surfaces. Another way to minimize contamination is to perform all phases of the testing process in a clean room with removal of particulate matter from the air. If a dedicated clean room is not available, the use of dust covers to protect specimen aliquots on autosamplers or bench tops should be considered. The ISO 7 standard of <10,000 particles/ft.3 was the most commonly used clean room specification by respondents to question #3.
Half of participants who answered question #4 routinely wash samples tubes, caps and/or pipet tips with nitric acid. Glassware and plastic ware should either be washed with 10% nitric acid or disposable materials verified to be contamination-free should be used. About one third of respondents to question #5 reported using dedicated pipets and nearly half use dedicated standards and/or quality control materials for aluminum testing. A variety of different responses to question #6 were reported for what other precautions were taken to minimize contamination.

In summary, although a variety of pre-analytic and analytic processes are used by Survey respondents, most recognize the importance of minimizing contamination when performing aluminum testing. We hope that this discussion will spur a review of your laboratory’s processes and procedures to further minimize the potential of contamination and provide more accurate aluminum results.
William L. Roberts, MD, PhD Chair
Chemistry Resource Committee
 
Strontium deposition comes from dust and marine sources

http://www.springerlink.com/content/17ckg7fuxb8cpgc7/

Weathering versus atmospheric sources of strontium in ecosystems on young volcanic soils
1999
Peter M. Vitousek, Martin J. Kennedy, Louis A. Derry and Oliver A. Chadwick

See preview@ above URL. The authors have done some work quantifying atmospheric strontium depostion derived from both terrestrial and marine sources

some of Vitousek's data:
http://www.stanford.edu/group/Vitousek/webfigs6.xls
 
This is an excellent overview of atmospheric deposition

http://www.geo.cornell.edu/geology/research/derry/publications/Derry-Chadwick_Elements_07.pdf
Contributions from earth's atmosphere to soil
Louis A. Derry1 and Oliver A. Chadwick2
"In this paper, we narrow the focus to additions
of inorganic elements that are transported as mineral
particles or dissolved salts derived from wind erosion of
continental surfaces, or as salts derived from the oceans."
"Since most atmospheric water vapor is derived from the
ocean, marine aerosols are a major source of solutes in the
atmosphere."
 
So...I assume one would expect to find aluminum in hail...what about barium? Barium is also found in dust isn't it??

I am guessing that hail is quite susceptible to containing all sorts of particulate matter as it is formed from strong convective up drafts in strong thunderstorms...??

Anthony Hilder's latest masterpiece is this classic interview...no real data just outlandish claim after outlandish claim...

Interview from "Conspiracy Con" - I did not know that existed...not surprised I guess:

http://aircrap.org/morgellons-carri...ke-bruneel-interviewed-anthony-hilder/331685/

Hilder has a cottage industry out of conspiracy videos.

The aircrap site is him just trying to corner the market on it, and rebrand it as "death dumps", so he can sell more videos.
 
That's a terrible technique, as it's going to have all the dust that the surface of the plastic trays collect. That will have lots of mineral dust in it, hence lots of aluminum. It's not coming from the rain though, just windborne dust.
 
In WITWATS, While standing near his home, Dane Wigington said:
Dane Wigington said:
"California Air Quality Resources Board has studied the aerosols from China, these metals are not among them."

I'm interested in seeing what study he refers to, but haven't found any references given.
While looking, I found this 2003 paper at the CARB website:
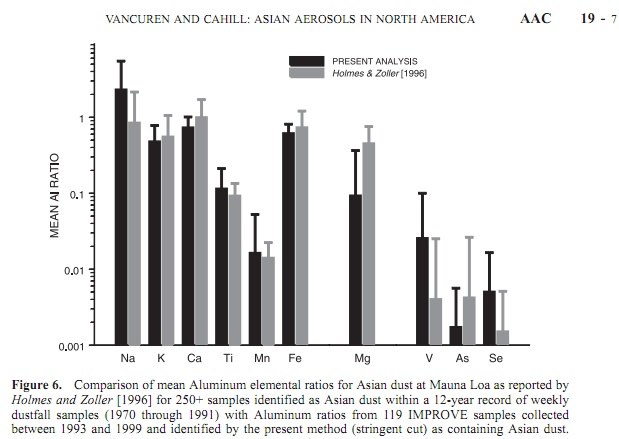
Asian aerosols in North America: Extracting the chemical composition and mass concentration of the Asian continental aerosol plume from long-term aerosol records in the western United States
http://www.arb.ca.gov/research/ict/docs/asian-aerosols03.pdf

Figure 7 in the paper shows aluminum constitutes 1.5% of the Asian dust aerosol
--------------------------------------------------------------------------------------------
This paper characterizes asian dust in British Columbia, Canada, and states:

"Filter samples in the region show a massive injection of crustal
elements (Si, Fe, Al, and Ca) with concentrations of Si approximately double those
previously recorded. Ratios of these elements to Fe are shown to be statistically similar to
ratios observed in mineral aerosol events in Hawaii and China. On the basis of the
difference between observed and expected elemental concentrations and reconstructed soil
mass in the episode, it is estimated that Asian dust contributed 38–55% to observed PM10
in the Lower Fraser Valley, the remainder being attributed to local sources."
http://www.geog.ubc.ca/~ian/Long-ra...r Fraser Valley, British Columbia, Canada.pdf

Figure 6 of the paper shows Al ranked third in abundance, below Si and S, and above Fe.
 
It's a bit of a straw man though, as nobody is claiming that China is the sole source of these metals, or even a major source.

See also in:

http://www.arb.ca.gov/research/ict/docs/asian-dust02.pdf

Aluminum is so ubiquitous in the dust that they use it as a baseline to calculate the "Aluminum elemental ratios" of the other elements (i.e. how much of that element there is relative to aluminum).


Aluminum is of course implicitly present on the graph with a value of 1. About the same as Iron.
 
Last edited:
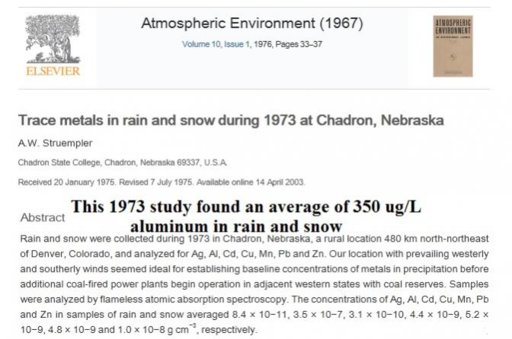
Trace metals in rain and snow during 1973 at Chadron, Nebraska

A.W. Struemplera

Chadron State College, Chadron, Nebraska 69337, U.S.A.

Received 20 January 1975; revised 7 July 1975. Available online 14 April 2003.

Abstract
Rain and snow were collected during 1973 in Chadron, Nebraska, a rural location 480 km north-northeast of Denver, Colorado, and analyzed for Ag, Al, Cd, Cu, Mn, Pb and Zn. Our location with prevailing westerly and southerly winds seemed ideal for establishing baseline concentrations of metals in precipitation before additional coal-fired power plants begin operation in adjacent western states with coal reserves. Samples were analyzed by flameless atomic absorption spectroscopy. The concentrations of Ag, Al, Cd, Cu, Mn, Pb and Zn in samples of rain and snow averaged 8.4 × 10⁻¹¹​, 3.5 × 10⁻⁷​, 3.1 × 10⁻¹⁰​, 4.4 × 10⁻⁹​, 5.2 × 10⁻⁹​, 4.8 × 10⁻⁹​ and 1.0 × 10⁻⁸​ g cm−3​, respectively. A greater concentration of the elements, except Cu, was found in rainwater from convective storm showers as compared to extended rains. Statistical analyses suggest that Al and Mn in precipitation are largely soil derived and that Ag and Cd are more associated with anthropogenic sources. From these results, the deposition of Ag, Al, Cd, Cu, Mn, Pb and Zn by precipitation to the earth's surface during 1973 was respectively: 0.34, 1400, 1.2, 18, 21, 19 and 40g hectare−1​ y−1.​
Content from External Source


http://www.sciencedirect.com/science/article/pii/0004698176902560

The average level of aluminum given above, 3.5 x 10⁻⁷​ grams/cm3​ is equal to 350 micrograms/liter.
 
It's a problem. And one that is probably illustrated by the wildly different test results they get.

What they really need to do is take multiple samples on the same day.

You are quite right.
These Long Island, NY samples were all taken at the same time:
http://geoengineeringwatch.org/library/testing/newyork/GeoengineerDataNewYork.doc

Aluminum results were 15ug/L, 82ug/L, 13 ug/L, and 20 ug/L

So, you have one result four times the other three, yet from the same rainfall.
As you can see, this went straight over Francis Mangels' head.
 
Average Aluminum Concentration from Data at coalitionagainstgeoengineering.com

These figures of the concentration of aluminum in rain and snow match WITWATS/Mangels figures quite well, 520 ug/l to 1120 ug/L


Yes, indeed, Mick. The average aluminum content of rain in the 1967 study you quote above was 800 ug/L and for snow 460 ug/L.

I went to the "Test Data" link at Michael J. Murphy's Coalition Against Geoengineering website, went through all of his samples of snow and rain,
from 2007 through 2011, then found the average.
http://geoengineeringwatch.org/library/testing/

Michael J. Murphy constantly claims that his samples show abnormally high levels of aluminum in rainwater.

An analysis of his own results proves his claim to be false. The average aluminum concentration in his samples was 484 ug/L.
His samples show that average levels of aluminum in rain & snow are currently LOWER than they were over 40 years ago.

He needs to retract that claim.


Sample Date Location Aluminum Level (µg/L)
12/27/2007 Italy 13
3/1/2007 East Lake Shasta, CA (snow) 7.2
4/14/2007 East Lake Shasta, CA 88
4/21/2007 East Lake Shasta, CA 27.2
5/4/2007 East Lake Shasta, CA 33.2
1/31/2008 East Lake Shasta, CA (snow) 368
2/23/2008 East Lake Shasta, CA 262
3/18/2008 East Lake Shasta, CA 2190
4/21/2008 East Lake Shasta, CA 650
5/22/2008 East Lake Shasta, CA 188
5/29/2008 East Lake Shasta, CA 881
10/4/2008 East Lake Shasta, CA 84
11/1/2008 East Lake Shasta, CA 815
11/11/2008 East Lake Shasta, CA (lightning storm)3450
3/21/2009 Mt. Shasta, CA 1540
3/22/2009 Mt. Shasta, CA 41
3/28/2009 Mt. Shasta, CA 853
10/14/2009 Mt. Shasta, CA 611
7/10/2010 Maui, HI 400
7/26/2010 Maui, HI 219
1/14/2011 Long Island, NY (snow) 15
1/14/2011 Long Island, NY (snow) 82
1/14/2011 Long Island, NY (snow) 13
1/14/2011 Long Island, NY (snow) 20
2/21/2011 Big Bear, CA (snow) 38.8
5/17/2011 Orinda, CA 118
5/17/2011 Orinda, CA 66.9
Average 484.2333333
 
Last edited by a moderator:
I am considering challenging the chemmies to conduct a simple science experiment, one which anyone can do fairly cheaply.
Hypothesis: Aluminum oxide will increase the pH of soil

According to the patent claimed being used by the chemmies,
Stratospheric Welsbach seeding for the reduction of global warming said:
For example, aluminum oxide Al2​O3​ is one metal oxide suitable for the purpose and which is relatively inexpensive. It is presently believed that particle sizes in the 10 to 100 range would be suitable for the seeding purposes. Larger particles would settle to the earth more quickly.
http://www.willthomas.net/Chemtrails/welsbach-seeding.pdf

Here is the aluminum oxide, 50 micron:
http://www.mwdental.com/supplies/la...materials/aluminum-oxide-50-micron-white.html

Any thoughts on this?
 
Sounds like a reasonable experiment. Technically you'd have to only add a very small amount one day at a time to match the theorized distribution. But any actual data point is good.

Who do you think might do it though? They all seem a bit resistant to science.
 
The study collected rainwater in acid washed plastic containers during 1991, which they call "wet deposition". They did not analyze for all elements, they selected a few to check for. Their results did not seek a concentration of elements in the rain, rather they sought to determine the total amount of each element which was deposited on a square meter. They found that out of the elements they checked for, the most abundant was aluminum:

ATMOSPHERIC WET DEPOSITION OF TRACE ELEMENTS TO CHESAPEAKE BAY: CBAD STUDY YEAR 1 RESULTS said:
Based on data from two sites during Year I (7/90--6/91) of the CBAD Study, the average annual atmospheric wet flux of trace elements to Chesapeake Bay is (in ug/m2/yr(micrograms per square meter per year)
AI (13,600), As (49), Cd (48), Cr (88), Cu (260), Fe (10,400), Mn (1190), Ni (251), Pb (556), Se (214) and Zn (1335).
http://www.ceoe.udel.edu/CMS/tchurch/TMCWebPage/pdfweb61-90/86.pdf
 
Trace metals in rain and snow during 1973 at Chadron, Nebraska

A.W. Struemplera

Chadron State College, Chadron, Nebraska 69337, U.S.A.

Received 20 January 1975; revised 7 July 1975. Available online 14 April 2003.

Abstract
Rain and snow were collected during 1973 in Chadron, Nebraska, a rural location 480 km north-northeast of Denver, Colorado, and analyzed for Ag, Al, Cd, Cu, Mn, Pb and Zn. Our location with prevailing westerly and southerly winds seemed ideal for establishing baseline concentrations of metals in precipitation before additional coal-fired power plants begin operation in adjacent western states with coal reserves. Samples were analyzed by flameless atomic absorption spectroscopy. The concentrations of Ag, Al, Cd, Cu, Mn, Pb and Zn in samples of rain and snow averaged 8.4 × 10⁻¹¹​, 3.5 × 10⁻⁷​, 3.1 × 10⁻¹⁰​, 4.4 × 10⁻⁹​, 5.2 × 10⁻⁹​, 4.8 × 10⁻⁹​ and 1.0 × 10⁻⁸​ g cm−3​, respectively. A greater concentration of the elements, except Cu, was found in rainwater from convective storm showers as compared to extended rains. Statistical analyses suggest that Al and Mn in precipitation are largely soil derived and that Ag and Cd are more associated with anthropogenic sources. From these results, the deposition of Ag, Al, Cd, Cu, Mn, Pb and Zn by precipitation to the earth's surface during 1973 was respectively: 0.34, 1400, 1.2, 18, 21, 19 and 40g hectare−1​ y−1.​

http://www.sciencedirect.com/science/article/pii/0004698176902560

The average level of aluminum given above, 3.5 x 10⁻⁷​ grams/cm3​ is equal to 350 micrograms/liter.
storyboard51.jpg
 
Mangels claims that the aluminum concentration at his place has increased from 1.3 to 1.6%. A liter of soil typically weighs 1,300 to 1,500 grams. 0.3% of that would be about 4 grams of aluminum, or approximately 8 grams of Al2O3. Might be interesting. Maybe I will order a container of the dental powder. I could do a preliminary test at home, and send a sample of each to the lab for confirmation.
 
That's a terrible technique, as it's going to have all the dust that the surface of the plastic trays collect. That will have lots of mineral dust in it, hence lots of aluminum. It's not coming from the rain though, just windborne dust.

its not that hard to figure out, even if the dust gets in the trays, if there is a significant amount more aluminum on chemtrailing days, it's because the atmosphere and the "dust" is full of chemtrails. It's really not that f*****g hard to tell when you have a massive pollutant being sprayed into the atmosphere... Barium isn't going to come out of lightbulbs and go into dust and magically appear in quantities that are above EPA limits on chemtrailing days. You point out imperfections in experiments done by people who have love... (the ones who usually don't have a boatload of cash) - versus the experiments done by those with greed (lots of cash and corrupt). Read the Bible, it talks about this whole thing about how greedy people and deception will destroy the world. Harold is a good man, and he does what he does because it's obvious we are being poisoned..

How exactly would one be able to tell if there were chemtrails? Because apparently nobody with millions of dollars - no it's not even that, the Illuminati, yes Illuminati control everything so tight and hell there is so much proof towards chemtrails now.... debunking... what a lame word.. You know I personally know of and have seen people get shot killed and arrested for trying to expose the EPA in certain parts of this country? Where my girlfriend grew up, a few scientists were found dead underneath their house, shortly after they had told people they were going to expose some seriously skewed EPA lab results, because the EPA told them that even if the results are above limits, you report them as being just below the limits. I understand this website aims to rationally prove things, but what is going on is NOT rational, its insanity, and it takes one to know one I guess....
 
its not that hard to figure out, even if the dust gets in the trays, if there is a significant amount more aluminum on chemtrailing days, it's because the atmosphere and the "dust" is full of chemtrails.

Is there more aluminum on "chemtrailing days"? Test done in Hawaii by Dr. Lorrin Pang show no correlation between perceived "Chemtrailing" and the levels of aluminum in rainwater.

https://www.metabunk.org/threads/337-Debunked-Geoengineering-over-Maui-Hawaii

3 May 2011 Chem trails analysis of data.

The working hypothesis is that there will be a positive correlation between observations (daily reports of visual or satellite images) and levels of aluminum in rainwater caught that day.

The Chem Trail observation diaries must be blinded to the laboratory results. We have the diary tallies of Manis but wait for the satellite image diaries of Bruce Douglas (he is having a hard time finding archives of the satellite images). The 24 hour rainfall collections were made daily at 8:00 am and their date of collection is recorded. Next to each collection is Manis’s observation on a scale of high, medium or low which he later put on a scale of 4, 3, 2, 1 , with 4 being the highest. The dairy entry is for the previous day – for example if the collection was on the 10th Nov (8:00 am) the diary represents Manis observation the 9th. Also noted are whether the container was empty, partially full or full.

If we use 40 ug/liter (40 ppb) as elevated (the California standard) one can see that only 2 of the 26 samples were elevated, despite many days of high levels observed. If one sets a “cutoff” of 20 ppb as high or low, the 3 by 2 table analyzing for chi-square trend shows no correlation (P value of .41) of Mani’s observations to aluminum levels. To get some idea of the statistical power to detect a trend the next 3 by 2 table shows that hypothetical numbers in this table would have “triggered” a finding of a positive correlation (P value of .05).

One can also imagine that heavy rains which fill the cup could dilute the aluminum levels. Perhaps we should only use data from partially filled containers. A 2 by 2 chi-square analysis of Full vs partially filled does not show it as a confounder for aluminum levels. Furthermore both high and low diary readings have full and partial collections. Thus the possibility of statistical confounding (unequal distribution and correlation to outcome) should be minimal.

I neither see elevated aluminum levels nor a more subtle correlation to observations from this data. It is possible that aluminum was not used during this period (sea water can be used to reflect sunlight). One could also adjust the data for longer lag periods (rainfall following spraying) but this would introduce other types of error.
Content from External Source
You also have to eliminate confounding factors. If the contrails are due to an incoming front, then it would not be surprising that they would be followed by higher dust levels, as the first rains will naturally have higher dust content than later rains.
 
Last edited:
How exactly would one be able to tell if there were chemtrails? Because apparently nobody with millions of dollars - no it's not even that, the Illuminati, yes Illuminati control everything so tight and hell there is so much proof towards chemtrails now.... debunking... what a lame word.. ....

Roseanne Barr is a multi-millionaire who has joined the chemtrails promotion. She could easily hire a private jet to go up and get a sample. I doubt that she ever will, by your logic, she won't because she is controlled by the Illuminati? Unregsitered, I suggest you begin a campaign to draft her into the project. Go ahead, I'll be here waiting to see the results.
 
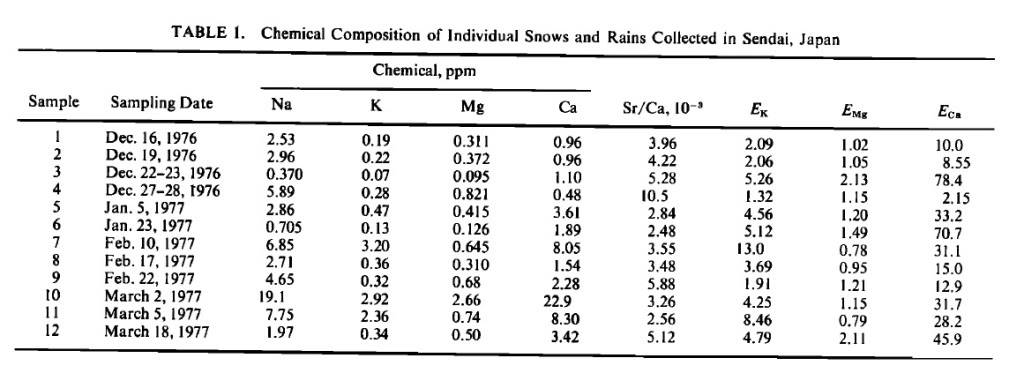
Found this 1978 paper which gives some sample results for strontium in rain and snow:

Ichikuni, M. 1978. Calcite as a Source of Excess Calcium in Rainwater. Journal of Geophysical Research 8(C12): 6249-6252.

Here is the results table:


Because they were mainly interested in the source of the calcium, the strontium is only given as a Sr/Ca ratio. However, from that one can calculate the strontium content:

Ca (ppm)Sr/Ca*10^-3Sr (ppb)
0.963.963.8016
0.964.224.0512
1.15.285.808
0.4810.55.04
3.612.8410.2524
1.892.484.6872
8.053.5528.5775
1.543.485.3592
2.285.8813.4064
22.93.2674.654
8.32.5621.248
3.425.1217.5104

I'll also paste below the data on aluminum that I posted on another thread, for those who pull this up in a search, since this is a very useful thread.

Vermette, S.J., and V.G. Bingham. 1986. Trace Elements in Frobisher Bay Rainwater. Arctic 39(2): 177-179.
Using short-decay instrumental neutron activation analysis, concentrations of the trace elements Al, Br, Ca, Cl, Cu, I, Mg, Mn, Na, and V were determined in rainfall sampled from Frobisher Bay, N.W.T., during three weeks in the summer of 1984. Detectable concentrations were reported for all ten elements. Enrichment factors revealed that concentrations generally represent either crustal or oceanic natural background levels.
Content from External Source
Here is the table of results, showing Al measurements ranging from 150 to 1300 parts per billion:


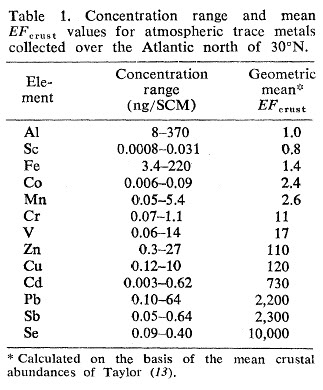
Duce, R.A., G.L. Hoffman, W.H. Zoller. 1975. Atmospheric Trace Metals at Remote Northern and Southern Hemisphere Sites: Pollution or Natural? Science 187(4171): 59-61.
Elements given (in nanograms per standard cubic meter) from air samples:
 
Last edited by a moderator:
I've seen Patrick Roddie recently make this claim:

The EPA conveniently stopped testing for airborne aluminum in 2002 as the global geoengineering program ramped up into high gear.
http://stopsprayingus-sf.com/epa-protest/
Content from External Source
Note he is speaking of airborne aluminum. He doesn't give a reference and doesn't respond to questions, so I went looking but haven't found results yet. If anyone knows whether this is true I'd like to know.

In my search I did run across an EPA paper discussing their air monitoring circa 1998.
The key term here is speciation, where the elemental or compounds found in airborne sampling is analyzed to determine the source, quantity and variability.

Guideline on Speciated Particulate Monitoring

These quotes were interesting as they pertain to geological material found airborne:
2.2 Major Chemical Components
Most of the PM2.5 or PM10 mass in urban and nonurban areas can be explained by a
combination of the following chemical components:
• Geological Material: Suspended dust consists mainly of oxides of aluminum, silicon,
calcium, titanium, iron, and other metal oxides (Chow and Watson, 1992. The precise
combination of these minerals depends on the geology of the area and industrial
processes such as steel-making, smelting, mining, and cement production. Geological
material is mostly in the coarse particle fraction (Houck et al., 1990), and typically
constitutes ~50% of PM10 while only contributing 5 to 15% of PM2.5 (Watson et al.,
1995a)

[NOTE-JR-PM2.5 are particle less than 2.5 micron and PM10 are particles 10 microns and larger]
================================

Sodium, aluminum, silicon, potassium, calcium, iron, and zinc are abundant only in the
coarse particle fraction (PM10 minus PM2.5), consistent with expected contributions from marine
aerosol (e.g., sodium) and suspended dust (e.g., aluminum, silicon, calcium, iron). The
proportion of geological material in PM10 varies from site to site, with over 80% of PM10
attributable to geological material in Las Vegas, NV (Chow et al., 1995a; Chow and Watson,
1997a) and less than 20% in San Jose, CA (Chow et al., 1995b).
==============================================


2.3 Properties that Quantify Source Contributions
The relative abundance of chemical components in an ambient PM2.5 sample reflects the
chemical composition of the source emissions in the monitored environment. Chemical source
profiles are the fractional mass abundances of measured chemical species relative to primary PM2.5
mass in source emissions.
Figures 2-4 through 2-7 show source profile examples for the common PM2.5 emitters of:
(1) geological material, (2) motor vehicle exhaust, (3) wood and coal burning, and (4) coal-fired
power generators (Watson et al., 1996a). In each of these illustrations the height of each bar
indicates the average fractional abundance for the indicated chemical, while the dot shows the
standard deviation of the average. When the height of the bar exceeds the position of the dot, and
when the height of the bar is much higher than it is in other profiles, the corresponding species
is considered as a good marker for that source type.
==================================

Figure 2-4 shows the similarities and differences among chemical abundances in three
sub-types of PM2.5 geological emitters: (1) paved road dust, (2) unpaved road dust, and (3)
natural soils. Aluminum (Al), silicon (Si), potassium (K), calcium (Ca), and iron (Fe) have large
abundances with low variabilities. The total potassium (K) abundance is 15 to 30 times the
abundance of soluble potassium (K+). Aluminum (Al), potassium (K), calcium (Ca), and iron (Fe)
abundances are similar among the profiles, but the silicon (Si) abundances range from 14% in
unpaved road dust to 20% in paved road dust.

This Figure 2-4 is very interesting since it shows details of ordinary soil found in Colorado, not nationally representative but you can get the idea of how atmospheric scientists typify soil by the elements usually found and use certain more abundant soil elements and compounds as a "marker" for the type of elemental profile found in a sample:
In this case aluminum, silicon, calcium and iron definitely would be markers!

natural soil speciation profile.jpg


I found a 2014 example of EPA testing of HVAC filters in Chicago. Aluminum was included in the test results.


I found this on the EPA website. It addresses amendments to air toxicity standards in aluminum production.

http://www.epa.gov/ttnatw01/alum2nd/alum2pg.html


It seems that the EPA is more interested in industrial byproducts of aluminum production than actual aluminum particulate levels in the atmosphere.

http://www.epa.gov/highgwp/aluminum-pfc/index.html
 

Attachments

  • lab-analysis-furnace-filters-and-blanks-for-metals-201407.pdf
    3.8 MB · Views: 945
Back
Top