scombrid
Senior Member.
http://www.youtube.com/watch?v=yslwwu_qtxU&feature=related
Youtuber HatrickPenry is viewing an Intellicast regional radar loop and claiming that it depicts HAARP creating weather. What is visible on the radar is low level light precipitation in the wake of a departing low pressure. He points to the circular returns and calls them "anomalies" and marvels that the areas of precip are stationary. It appears that he believes that he is viewing satellite imagery and is unaware that the loop comprises a mosaic of images from individual ground based radar stations (Pittsburg, State College, and Buffalo are three in this video) that use radio waves to detect particles in the air around the station.
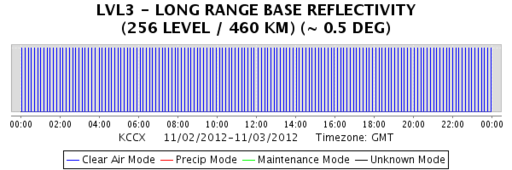
The precipitation is light and maybe not reaching the ground so that the precipitation isn't visible to the radar at all tilt angles or throughout the entire radar sweep radius. That means there will be a circle of precip showing on the image surrounding each radar station with gaps in coverage at the edges of the radars' sweep radii. The fact that only precip near the radars is showing on the composite tells you that the precipitation is low and once you are over 100 miles from the radar all tilt angles are aiming over top of the precipitation. The precipitation is not stationary but is moving from NW to SE but is only visible to the radars when it is near them so it appears to be anchored around the radar if you ignore actual motion. The "rings" that he points to are due to the fact that each radar scans the sky in a circular pattern (weather radar is a rotating dish that scans slices of the sky at multiple angles). In a composite image mulitple scans from different elevations are used from each radar. If precip is only detectable at a specific elevation there will be a ring around the radar at the elevation at which the radar signal intercepts the precipitation. This is very common with "virga", precipitation that is light and not reaching the ground, as well as with drizzle. Virga will show up in rings on composite imagery that merges all scan elevations but will not be visible on the base (0.5 degree) scan. More than likely this precip was from a low/mid stratiform deck around 10k to 15k and was visible on base reflectivity but only intermittantly at other tilt angles.
Also, Intellicast is a private weather company that obtains radar data from the National Weather Service and then uses it's own proprietary filters to create a display for public consumption. The filters often switch between composite and base reflectivity images in an effort to display what is actually happening at the ground but Intellicast's filters are not very good. At 0:28 HatrickPenry makes a big deal about the state college radar going from "ring to snow". The snow was already there. When the "ring" was showing, Intellicast was not consistently using the same input data from frame to frame. Base reflectivity was absent from the frames with the rings and then suddenly kicked in. That made the precipitation that was near the radar appear to suddenly occur though it was there the entire time.
He says at one point (starting at 1:05 or so) that he felt that the goal of this "manufactured snow" was to snow people out, "pound them with some snow". There was very little measurable precipitation at the time of this video.
Climate report from State College PA (center of one of his "rings") as an example:
3rd November:
PRECIPITATION (IN)
YESTERDAY T 1.16 1962 0.10 -0.10 0.00
MONTH TO DATE T 0.31 -0.31 0.00
SINCE SEP 1 11.05 7.65 3.40 22.58
SINCE JAN 1 40.38 34.59 5.79 65.97
SNOWFALL (IN)
YESTERDAY 0.0
MONTH TO DATE 0.0
SINCE SEP 1 0.0
SINCE JUL 1 0.0
SNOW DEPTH 0
2nd November:
PRECIPITATION (IN)
YESTERDAY T 1.95 1958 0.11 -0.11 0.00
MONTH TO DATE T 0.21 -0.21 0.00
SINCE SEP 1 11.05 7.55 3.50 22.58
SINCE JAN 1 40.38 34.49 5.89 65.97
SNOWFALL (IN)
YESTERDAY 0.0
MONTH TO DATE 0.0
SINCE SEP 1 0.0
SINCE JUL 1 0.0
SNOW DEPTH 0
1st November:
PRECIPITATION (IN)
YESTERDAY T 1.86 1932 0.10 -0.10 0.00
MONTH TO DATE T 0.10 -0.10 0.00
SINCE SEP 1 11.05 7.44 3.61 22.58
SINCE JAN 1 40.38 34.38 6.00 65.97
SNOWFALL (IN)
YESTERDAY 0.0
MONTH TO DATE 0.0
SINCE SEP 1 0.0
SINCE JUL 1 0.0
SNOW DEPTH 0
31 October:
PRECIPITATION (IN)
YESTERDAY 0.02 1.33 1939 0.09 -0.07 0.00
MONTH TO DATE 6.58 3.27 3.31 4.15
SINCE SEP 1 11.05 7.34 3.71 22.58
SINCE JAN 1 40.38 34.28 6.10 65.97
SNOWFALL (IN)
YESTERDAY 0.0
MONTH TO DATE 0.0
SINCE SEP 1 0.0
SINCE JUL 1 0.0
SNOW DEPTH 0
Youtuber HatrickPenry is viewing an Intellicast regional radar loop and claiming that it depicts HAARP creating weather. What is visible on the radar is low level light precipitation in the wake of a departing low pressure. He points to the circular returns and calls them "anomalies" and marvels that the areas of precip are stationary. It appears that he believes that he is viewing satellite imagery and is unaware that the loop comprises a mosaic of images from individual ground based radar stations (Pittsburg, State College, and Buffalo are three in this video) that use radio waves to detect particles in the air around the station.
The precipitation is light and maybe not reaching the ground so that the precipitation isn't visible to the radar at all tilt angles or throughout the entire radar sweep radius. That means there will be a circle of precip showing on the image surrounding each radar station with gaps in coverage at the edges of the radars' sweep radii. The fact that only precip near the radars is showing on the composite tells you that the precipitation is low and once you are over 100 miles from the radar all tilt angles are aiming over top of the precipitation. The precipitation is not stationary but is moving from NW to SE but is only visible to the radars when it is near them so it appears to be anchored around the radar if you ignore actual motion. The "rings" that he points to are due to the fact that each radar scans the sky in a circular pattern (weather radar is a rotating dish that scans slices of the sky at multiple angles). In a composite image mulitple scans from different elevations are used from each radar. If precip is only detectable at a specific elevation there will be a ring around the radar at the elevation at which the radar signal intercepts the precipitation. This is very common with "virga", precipitation that is light and not reaching the ground, as well as with drizzle. Virga will show up in rings on composite imagery that merges all scan elevations but will not be visible on the base (0.5 degree) scan. More than likely this precip was from a low/mid stratiform deck around 10k to 15k and was visible on base reflectivity but only intermittantly at other tilt angles.
Also, Intellicast is a private weather company that obtains radar data from the National Weather Service and then uses it's own proprietary filters to create a display for public consumption. The filters often switch between composite and base reflectivity images in an effort to display what is actually happening at the ground but Intellicast's filters are not very good. At 0:28 HatrickPenry makes a big deal about the state college radar going from "ring to snow". The snow was already there. When the "ring" was showing, Intellicast was not consistently using the same input data from frame to frame. Base reflectivity was absent from the frames with the rings and then suddenly kicked in. That made the precipitation that was near the radar appear to suddenly occur though it was there the entire time.
He says at one point (starting at 1:05 or so) that he felt that the goal of this "manufactured snow" was to snow people out, "pound them with some snow". There was very little measurable precipitation at the time of this video.
Climate report from State College PA (center of one of his "rings") as an example:
3rd November:
PRECIPITATION (IN)
YESTERDAY T 1.16 1962 0.10 -0.10 0.00
MONTH TO DATE T 0.31 -0.31 0.00
SINCE SEP 1 11.05 7.65 3.40 22.58
SINCE JAN 1 40.38 34.59 5.79 65.97
SNOWFALL (IN)
YESTERDAY 0.0
MONTH TO DATE 0.0
SINCE SEP 1 0.0
SINCE JUL 1 0.0
SNOW DEPTH 0
2nd November:
PRECIPITATION (IN)
YESTERDAY T 1.95 1958 0.11 -0.11 0.00
MONTH TO DATE T 0.21 -0.21 0.00
SINCE SEP 1 11.05 7.55 3.50 22.58
SINCE JAN 1 40.38 34.49 5.89 65.97
SNOWFALL (IN)
YESTERDAY 0.0
MONTH TO DATE 0.0
SINCE SEP 1 0.0
SINCE JUL 1 0.0
SNOW DEPTH 0
1st November:
PRECIPITATION (IN)
YESTERDAY T 1.86 1932 0.10 -0.10 0.00
MONTH TO DATE T 0.10 -0.10 0.00
SINCE SEP 1 11.05 7.44 3.61 22.58
SINCE JAN 1 40.38 34.38 6.00 65.97
SNOWFALL (IN)
YESTERDAY 0.0
MONTH TO DATE 0.0
SINCE SEP 1 0.0
SINCE JUL 1 0.0
SNOW DEPTH 0
31 October:
PRECIPITATION (IN)
YESTERDAY 0.02 1.33 1939 0.09 -0.07 0.00
MONTH TO DATE 6.58 3.27 3.31 4.15
SINCE SEP 1 11.05 7.34 3.71 22.58
SINCE JAN 1 40.38 34.28 6.10 65.97
SNOWFALL (IN)
YESTERDAY 0.0
MONTH TO DATE 0.0
SINCE SEP 1 0.0
SINCE JUL 1 0.0
SNOW DEPTH 0