Debunked: "Deadly Ultraviolet UV-C and UV-B Penetration to Earth’s Surface:" [Stray Light]

Mick West

Administrator
Staff member
Deadly UV Metabunk.jpg


In a paper titled "Deadly Ultraviolet UV-C and UV-B Penetration to Earth’s Surface:" J. Marvin Herndon, Raymond D. Hoisington, and Mark Whiteside write:

Our multifold measurements of solar irradiance spectra demonstrate conclusively that all wavelengths in the spectral range 200-400 nm reach Earth’s surface, contrary to the widespread perception that all UV-C and the majority of UV-B never reach the surface.
...
We demonstrate that satellite-based LISIRD solar spectra irradiance at the top of the atmosphere is badly flawed with some regions of the spectrum being less intense than measured at Earth’s surface. That calls into question any calculations made utilizing LISIRD data.
Content from External Source
http://www.sciencedomain.org/abstract/23870
Metabunk 2018-04-01 10-27-32.jpg
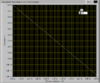
They get values for UV-C (their readings are shown in the graph above in red and black) that are much higher than found in space (the green line). The graph above is a comparison they make in their paper. I've corrected for the rather misleading log scale they used:

Their readings obviously go wrong below 280 nm.

Herndon's answer to this problem is that his cheap device is right and NASA's satellite measurements for the last couple of decades are wrong.
We demonstrate that LISIRD solar spectra irradiance at the top of the atmosphere is badly flawed with some regions of the spectrum being less intense than measured at Earth’s surface. That calls into question any calculations made utilizing LISIRD data.
Content from External Source

I asked the manufacturers of the instrumente used, International Light Technologies, about this:

MICK:

I'm interested in the use of the ILT950UV for measuring UV-C solar radiation. I see in this recent article: http://www.journalrepository.org/media/journals/JGEESI_42/2018/Mar/Herndon1422018JGEESI40245.pdf that a ILT950UV was used over the range 200-400nm. However it demonstrate an unexpected upwards curve below about 260nm (see Fig 3) where the expected UV from sunlight would be near zero. Is this result a problem with the ILT950UV at the lower range, or an issue with calibration or filtering?
Content from External Source
They responded:

ILT:

Thank you for your interest in our ILT950.

All CCD array spectrometers are prone to effects of stray light in the UVC. The CCD is made of silicon which is very insensitive in the UVC, so it has a large calibration factor multiplier which magnifies the small levels of stray light reaching the pixels used to measure UVC. Basically the error starts as stray light but then during conversion from pixel to irradiance the calibration multiplier increases the error of the stray light. I also noticed that the graph is plotted in log scale which tends to magnify smaller numbers.

Thought our new model ILT950 with a CMOS sensor has more UV sensitivity as compared to the Visible range it will still suffer the effects of stray light.

The only way to truly measure very small UV signals in the [presence] of very intense white light is with a monochromator, or possibly even a double monochromator which cost in the 15-25,000 dollar range.
Content from External Source
(emphasis mine)

So the rise in UV at the bottom of the range is due to the multiplication of noise from stray sunlight multiplied by a function that ramps up for low values of UV.

i.e. it's a graph of the correction function made visible by not filtering out all the other light.

Follow up from ILT:


MICK:
So the curve seen there is essentially stray light multiplied by calibration multiplier? i.e. the shape of the curve actually reflects the function used to calculate the calibration multiplier?

ILT:

Yes the shape is reverse of the sensitivity or a silicon CCD. As the sensitivity decreases, the calibration multiplier is larger. so the stray light effects are amplified by the cal factor. Then it is magnified by the use of a log scale
Content from External Source

ILT say the only way to measure UV-C with this instrument is monochromator. This is a type of specialized filter that blocks out all stray light outside of one narrowly defined part of the spectrum. This was not done by Herndon, et. al, which is why they have the peak in UV-C. It's simply the calibration curve added in by the software. No UV-C was detected.

It is unfortunate that the authors of the paper were seemingly unfamiliar with the problems of stray light in measuring UV-C. This is actually a well know problem in the field, and was in fact raised as an issue by of the peer-reviewers of the paper:

http://www.sdiarticle2.org/prh/JGEESI_42/2018/Rev_JGEESI_40245_Bra.pdf
Authors have measured solar irradiance spectrum in the spectral range 200- 400 nm. This study is flawed in its physical component. The UV-C measurements are not credible because they were obtained with an inappropriate instrument and they do not agree with theoretical predictions (Planck’s law - blackbody emission). I suspect these UV-C fluxes to be spurious results of instrument limitations.
Content from External Source
The problem is well known to the manufacturers and experienced users of these instruments. Here's discussion from Instrument Systems, a division of Konica Minolta:
The impact of stray light correction on the spectrum of a calibration source is particularly distinct in the UV and IR spectral range, because the detector of an array spectroradiometer has only a low sensitivity at the edges. Due to the division of the measured spectrum by the reference spectrum, errors due to stray light contaminated measurement spectra are intensified in the areas of lower sensitivity. Thus, stray light correction leads directly to a higher precision in radiometric evaluations of UV LEDs.
Content from External Source
They include this explanatory chart:
upload_2018-4-3_12-19-6.png
Notice the most accurate readings (green) with the scanning double monochromator (as suggested by ILT) are around 0.001. Basically zero.

Herndon, et. al, do mention "stray light"
This is a new line of investigation employing International Light Technologies ILT950UV Spectral Radiometer with fractional nanometer resolution in the short-wavelength portion of the ultraviolet (UV) spectrum with stray light rejection >99.7%.
Content from External Source
What they fail to realize is that 0.3% of very bright sunlight is still a lot of stray light falling on the UV-C portion of the sensor.

[Note: this is a summary post of the thread below, original discussion follows]
 
Last edited:
Metabunk 2018-04-01 11-27-48.jpg

Here's his problem in a bit more context. The larger blue graph is the actual solar radiation spectrum measured in space. Red and black are his measurements. Above 280 they are quote reasonable, being lower than the raw values above the atmosphere. The also (correctly) drop to zero at around 280. Then at around 250 down to 200 his readings ramp up to 20x times the value found in direct sunlight in space.

Solar irradiance data from:
http://lasp.colorado.edu/lisird/data/whi_ref_spectra

UV data in the 200-400 range comes from the $122 Million SORCE satellite.
http://lasp.colorado.edu/lisird/resources/whi_ref_spectra/docs/WHI_solar_irradiance_results_ver2.pdf

Metabunk 2018-04-01 11-33-10.jpg

Similar errors were early reported on Geoengineering watch.
Geoengineeringwatch are continuing to push this idea:
http://www.geoengineeringwatch.org/geoengineering-is-causing-lethal-uv-radiation-exposure/

The August 5th, 2017, UV metering graph below reveals the increasing spikes of ever more lethal UV radiation spectrums.


The ozone destruction / UV radiation increase equation is extremely non-linear, this fact must be remembered and considered.

Below is a direct quote from a World Health Organization (WHO) publication on UV radiation, the total denial of UV-C radiation reaching the surface of Earth is nothing less than a lethal lie.
Content from External Source
Again this just looks like sensor noise. They should see how the sensor responds in this range in A) darkness and B) indoor artificial bright light.
 

Attachments

  • ref_solar_irradiance_whi-2008_ver2.dat.csv
    1,020.4 KB · Views: 1,006
Last edited:
So the rise in UV at the bottom of the range is due to the multiplication of noise from stray sunlight multiplied by a function that ramps up for low values of UV.

i.e. it's a graph of the correction function made visible by not filtering out all the other light.
Very reasonable explanation. Had Herndon (or his co-author Raymond Hoisington who was responsible for the spectral measurements) consulted the manufacturer, they would have saved themselves from an embarrassing mistake.
But Herndon will never accept this.

Interestingly, this former article on Geoengineeringwatch has been removed:
"A new warning of deadly ozone layer collapse from a former NASA engineer"
http://www.geoengineeringwatch.org/...e-layer-collapse-from-a-former-nasa-engineer/
but is archived here: http://archive.is/yKgGQ

The "former NASA engineer" writes that a scientist criticized his results on the basis that the high measured values are caused by stray light:
This author has confronted a major scientist with the NASA "SORCE" program, and the subject of 270 nanometer radiation levels measured at earth surface were discussed – that scientist responded by saying “your data is a result of stray light, UVC radiation is attenuated completely by the Upper Ozone Layer and the atmosphere”. This scientist denied the data presented through emails, and all phone and internet communication was terminated with the author.
Content from External Source
 
Had Herndon (or his co-author Raymond Hoisington who was responsible for the spectral measurements) consulted the manufacturer, they would have saved themselves from an embarrassing mistake.

According to the above paper he did.

" The initial order to International Light Technologies specified that solar radiation measurements were to be performed with this unit, and that power levels to be measured in μW/cm²/nm.
International Light Technologies provided all training, and feedback analysis of initial data gathered to insure correct measurement process"

At face value, that would suggest that ILT have represented one thing to the authors, and another to Mick.

However, in this technical paper, the authors disclaim that their technical competence and the reliability of interpretation of their data is/was subject to the prior interpretative/confirming work of others. Further, the results of the authors’ work is of ground-breaking significance. In such a case, would it not have been appropriate that the authors would disclose the details of the “initial data” and the “feedback analysis” for the purposes of ensuring their work could be tested and repeated?

In the circumstances, I suggest that the onus falls on the authors, not ILT, to disclose that information.
 
Ah, handheld spectrometers are great! But not at 350nm and lower.. It is well known fact, if they would have the experience using them or any photometric device.. The authors should have asked a photonics engineer first, smh..
 
Ah, handheld spectrometers are great! But not at 350nm and lower.. It is well known fact, if they would have the experience using them or any photometric device.. The authors should have asked a photonics engineer first, smh..

Quite possibly this is true. However, the authors claim that
“The geoscience community and the United Nation’s Intergovernmental Panel on Climate Change, IPCC, has misled the public and the scientific community by not taking into account the consequences of aerial particulate spraying on climate”
Content from External Source
(Para 2 of the Introduction of their paper). So I would be very surprised if they felt that ANY other engineer could be trusted to give them impartial advice, particularly where it would have the effect of rendering their entire paper irrelevant.
 
Last edited by a moderator:
Quite possibly this is true. However, the authors claim that
“The geoscience community and the United Nation’s Intergovernmental Panel on Climate Change, IPCC, has misled the public and the scientific community by not taking into account the consequences of aerial particulate spraying on climate”
Content from External Source
(Para 2 of the Introduction of their paper). So I would be very surprised if they felt that ANY other engineer could be trusted to give them impartial advice, particularly where it would have the effect of rendering their entire paper irrelevant.


The paper explains a lot, but just not enough information is given about how the system works and if they (the operators) took care enough to prevent wrong data. The type of instrument they used is used everywhere, in labs and in the field. As I have used these type of spectrometers extensively in labs (I used OceanOptics USB4000), consists of a compact or "folded" optical design, where a small concave mirror is re-imaging the entrance slit via a small grating on a small CCD line-detector (8pix x 1064).

Example: different company, same design:
http://www.avantes.ru/en/spectrometer/opticbanch/avabanch.jpg

I am pretty confident that UV reaching our earth surface is not alarmingly increasing,
it must have been caused by the instrument and/or the way it was used. I do not read in the paper that an expert (from the company) was present during the measurements, which leads me to believe that the measurement went wrong. Possible causes that I remember are:

1-The spectrometer should have a "grating order cut off filter" inside. This is an optical filter, cutting off higher wavelengths than the range the unit measures. This is needed as the (sun) light is very much brighter around 700nm, a wavelength range that still enters the spectrometer and is diffracted by the grating. It will not directly hit the detector, but hit somewhere inside a (black) baffle of a wall. There the problem occurs: the light is scattered inside the unit and the scattering will hit the detector. When this is not taken in account observing the results, it gives a false result.

2-Operation of the software might be wrong. The software has different settings for acquiring data: Absolute or Relative. When the Relative tab is used, the measured data is continuously referenced the the REF data taken earlier. This ratio is a tricky thing: if an angle is changed or the sun has moved somewhat it will immediately result in curves. The UV detectivity of Silicon also is very very low, and therefore a lot of "tricks" are needed to still spectrally observe UV light. Another fact is that the CCD arrays will not give you a larger dynamic range than ±12 bits.

My money is on 1.
 
I am pretty confident that UV reaching our earth surface is not alarmingly increasing

It think this is perhaps a case where we need to be careful not to understate both the implication of their claim and and the errors in their evidence.

Obviously there is not an increase in UVC reaching the surface. Here's their graph again:
upload_2018-4-6_8-39-28.png

Red&Black is theirs, green is the reference level of incoming solar radiation in space.

They show what is now obvious is the calibration magnification of stray light in the range from 250 nm down to 200nm. This is increasing to 20 as the levels in space, with no filtering, direct from the sun, decrease down to less that 1.

Not only that, but the levels appear to be increasing exponentially as the wavelength gets lower, but in the atmosphere the levels will decrease as the wavelength gets lower. Especially at 200nm, which is the start of "vacuum UV", so-called because it is strongly absorbed by the air - not just by ozone (O3) but by normal atmospheric oxygen (O2). Vacuum UV is used in science in a vacuum chamber, or in a pure nitrogen atmosphere. Here's the absorption rate:
http://www.thespectroscopynet.eu/?Spectrometers:Design_concepts:Extreme_UV


And here to scale:
Metabunk 2018-04-06 08-55-19.jpg

So even if there was no ozone, as they suggest, then the UV would start going down (even more than it does in space), not up, at 200.

AND, if there was no ozone, then where is the UV between 250 and 300? If it were not being blocked by the ozone layer, and if the oxygen was unable to block the much more blockable levels of UV-C below 250, then there would be vastly more UV between 250 and 300 than between 200 and 250.

The are multiple other problems. Why are we not blind? Why has nobody noticed this unusual rise in UV. Why has nobody noticed thousands of tons of coal-fly ash being sprayed in the atmosphere. But these are almost irrelevant - the paper is fundamentally flawed and should never have been published. Let us not give it any more credence than it deserves.
 
That is probably for a metre or so, given the context, not the whole atmosphere.

Exactly, if the UV starts to get attenuated in few feet then it's not going to make it through thousands of feet of atmospheric oxygen.

And of course the ozone layer is still there. It's being observed by hundreds of scientists all around the world.
 
Why would anyone try to publish such a spectacularly weird result without first confirming it with other measurement instruments/methods. Anyway, remarkable new findings, even if published in a renowned peer reviewed journal, are most likely just noise.
Was this picked up by any mainstream media? It is unfortunate when that happens since it can undermine the public's confidence in the scientific process. Not until you have several independent teams coming to the same conclusion do you have a result.
 
It is striking the group that made the findings, does not FIRST question their data, but directly concludes that it must be the light/atmosphere and not a faulty spectrometer and/or wrong measurement method. When there is huge "database" of measured spectral solar data, originating from many places on earth, measured with all kinds of different instruments, would it not be scientifically correct to doubt your strange findings?
 
I agree that stray light is the most likely cause of their short wavelength values. I saw one comment speculating that the journal might retract the paper. As the senior author of the comment on the original D'Antoni paper (ref #28 in the Herndon paper), I naively thought that, by submitting that comment, the journal would think of retracting the paper. However, the editor was remarkably aloof and uninvolved in the controversy, and D'Antoni was permitted to publish a response to my comment (#29), and that was the end of things. The D'Antoni paper had been profiled by Nature Geosciences, and I couldn't get any response from them either. Any ideas how we should proceed with this paper?

One other criticism of this paper is the photo of the tree in NYC. Classic "southwest winter injury." Ask a plant pathologist - I did. On a clear, cold winter day there is enough sunlight (very little UV) which thaws the vascular tissue just under the bark. Sun sets, goes behind a building, etc and the temperature drops quickly, refreezing the vascular tissue. Enough times during a winter and damage as seen in the picture results. That's why orchardists and horticulturalists paint trunks white or wrap them in white paper or perforated white plastic. I do that on my own fruit trees.
 
Last edited by a moderator:
Any ideas how we should proceed with this paper?
I don't think the journal would retract it, as the publisher seems to be one of those predatory types. However, they would probably publish a commentary, like they did previously with another paper by Herndon:
http://www.sciencedomain.org/abstract/18488
Hopefully they would not charge a fee for a commentary paper.
One other criticism of this paper is the photo of the tree in NYC. Classic "southwest winter injury." Ask a plant pathologist - I did. On a clear, cold winter day there is enough sunlight (very little UV) which thaws the vascular tissue just under the bark. Sun sets, goes behind a building, etc and the temperature drops quickly, refreezing the vascular tissue. Enough times during a winter and damage as seen in the picture results. That's why orchardists and horticulturalists paint trunks white or wrap them in white paper or perforated white plastic. I do that on my own fruit trees.
Wow, that's very interesting, and useful info.
 
I agree that stray light is the most likely cause of their short wavelength values. I saw one comment speculating that the journal might retract the paper. As the senior author of the comment on the original D'Antoni paper (ref #28 in the Herndon paper), I naively thought that, by submitting that comment, the journal would think of retracting the paper. However, the editor was remarkably aloof and uninvolved in the controversy, and D'Antoni was permitted to publish a response to my comment (#29), and that was the end of things. The D'Antoni paper had been profiled by Nature Geosciences, and I couldn't get any response from them either. Any ideas how we should proceed with this paper?

One other criticism of this paper is the photo of the tree in NYC. Classic "southwest winter injury." Ask a plant pathologist - I did. On a clear, cold winter day there is enough sunlight (very little UV) which thaws the vascular tissue just under the bark. Sun sets, goes behind a building, etc and the temperature drops quickly, refreezing the vascular tissue. Enough times during a winter and damage as seen in the picture results. That's why orchardists and horticulturalists paint trunks white or wrap them in white paper or perforated white plastic. I do that on my own fruit trees.

There is a review of ozone absorption cross sections here:
http://www.wmo.int/pages/prog/arep/gaw/documents/FINAL_GAW_218.pdf
eg. figure 5 and figure 6.ozone CS.PNG
The absorption must increase towards shorter wavelengths until about 250nm. so there is no chance of the UVC at ground level increasing towards shorter wavelengths anywhere between 300nm. and 250nm. regardless of ozone concentration.
 
One other criticism of this paper is the photo of the tree in NYC. Classic "southwest winter injury."
Metabunk 2018-04-13 21-30-08.jpg

Or given that it's in New York City, perhaps it's classic "bike lock injury". There's quite a few possible causes of tree injury.
 
And here is a handy converter to atmospheric transmittance, just in case anybody thinks it is proportional.. Looks about right to me, but Mick, or others can check.Transmittance v X section.PNG
 

Attachments

  • Transmittance v X section 100DU.PNG
    Transmittance v X section 100DU.PNG
    28.1 KB · Views: 476
I found a great link explaining what I thought was indeed the case: the stray light on the ccd detector due to the compact design of the spectrometer.
The link is from a competitor spectrometer company, but the specifications are the same: the Czerny-Turner Spectrograph.
I used a similar one from OceanOptics, they are really great! But, when not aware of the limitations, it can cause errors.
What happens is that the light from the grating, because it is a folded design, cannot be properly "baffled" to prevent stray light from hitting the detector.
This is why compact spectrometers are more suitable for 400-1000nm. UV is tough.

http://bwtek.com/spectrometer-part-4-the-optical-bench/

Another way to skin a cat. Don't know if, or how, they got it wrong as I can't see enough details.Capture.PNG
https://books.google.co.uk/books?id...gUQ6AEIUDAI#v=onepage&q=KCl EU2+ UV-C&f=false
 
One other criticism of this paper is the photo of the tree in NYC. Classic "southwest winter injury." Ask a plant pathologist - I did. On a clear, cold winter day there is enough sunlight (very little UV) which thaws the vascular tissue just under the bark. Sun sets, goes behind a building, etc and the temperature drops quickly, refreezing the vascular tissue. Enough times during a winter and damage as seen in the picture results. That's why orchardists and horticulturalists paint trunks white or wrap them in white paper or perforated white plastic. I do that on my own fruit trees.

I have oak trees, and this morning it looked like one of them was on fire, with smoke pouring out of it.
IMG_2555.gif

From the other side of the tree the "smoke" was invisible:
Metabunk 2018-04-17 08-29-25.jpg

Of course it was just condensation, steam evaporating off the warming tree in the sunlight, and then condensing in the cold air, then evaporating again as it mixed more. We had a slight frost last night. You can quite easily understand how this cycle of freezing and sunlight can lead to injury on the sunward side.
 
Metabunk 2018-04-13 21-30-08.jpg

Or given that it's in New York City, perhaps it's classic "bike lock injury". There's quite a few possible causes of tree injury.
yup. wilt disease kinda looks like that.
wd2.JPG wd.JPG

or woodpeckers
birds_woodpecker_gallery_2.jpg

Disbelief probably seems like the proper response to the idea that there are woodpeckers in New York City. After all, woodpeckers peck on trees, not skyscrapers. But Gotham’s many parks have some very suitable habitat for birds from the family Picidae and a birder in any borough of New York will generally find at least a couple of species during an average morning’s birding. But even birders might be surprised to learn that eight species of woodpecker have graced New York City’s five boroughs with their presence! http://www.10000birds.com/the-woodpeckers-of-new-york-city.htm
Content from External Source
 
Or given that it's in New York City, perhaps it's classic "bike lock injury". There's quite a few possible causes of tree injury.

Looks remarkably like a dead tree.

Taking a photograph of a street tree under such horrid planting conditions as some conclusive proof of anything other than tree stress (or already being dead) is ludicrous.
 
Sorry, I missed this thread when posted. I work with ground and airborne spectal radiometers all the time. I think Mick got the correct answer at the opening of the thread. Measurements outside the reliable wavelength response of a sensor are suspect. The radiometer setup is also preposterous as it should be aimed at a flatfield reflectance target, e.g. a Spectralon plate. I tend to blame instrument companies that record data outside the region of good signal to noise (SNR) of detectors. I have seen this in long wave (FTIR) instruments that are good in the 9-14 micrometer range but provide measurements down to 2 micrometers wherein the measurements are meaningless using FTIR technology and SNR is in the single digits. I also noted that "sciencedomain.org" is listed in Bealls List of Predatory Journals and Publishers as a pay to publish online journal (https://beallslist.weebly.com/). I have been asked to peer review at some of these dubious journals in fields totally outside my core scientific knowledge.
 
Marvin Herndon seems to have a new article that is along the same lines as this and recycles some of the same inaccurate claims. It touches on radiometric measurements of contrails (Chemtrails), and claims that they must be particulates (fly ash) because ice doesn’t allow wavelengths of 250-300 nm. In typical fashion it’s written like, and the diagrams look like, a middle school science project. Someone is trying to use this as evidence, seeing as its not been discussed or retracted yet. Is there anyone that knows this subject matter a little more and can refute it?

It is called “Chemtrails are not contrails: radiometric evidence”https://journaljgeesi.com/index.php/JGEESI/article/view/30199/56684

It seems like as soon as one article gets attacked, he tweaks it slightly and then re publishes it.

Yeah, indeed the exact same thing. I think they just measured the attenuation of the sun (by the contrail), as we do not see any more data above 250nm..
 
I was looking at this again recently. (Link above is broken: new link)

It touches on radiometric measurements of contrails (Chemtrails), and claims that they must be particulates (fly ash) because ice doesn’t allow wavelengths of 250-300 nm.

That's not really what his claim is. Rather, he says that contrails SHOULD allow those wavelengths to pass through, because ice doesn't absorb them:

Radiometric solar irradiance spectra data that included the transit of a typical tropospheric aerosol trail between radiometer-sensor and the solar disc showed significant absorption during the transit period. The during-transit absorption is wholly inconsistent with the almost negligible adsorption [sic] by ice, but is wholly consistent with absorption by aerosolize [sic] particulates, including coal fly ash.
Content from External Source
Leaving aside his confusion between absorption and adsorption, what he claims is that

1) Aircraft trails block UV light
2) Ice does not absorb much UV radiation
3) Therefore the trails are not contrails made of ice.

This is the graph of measurements. The red bar on the timeline indicates when a contrail passed between the sun and the detector.
1688484139363.png

He goes on to say:

The UV absorption evident in Fig. 3 during the time of radiometer-sensor transit through the aerosol trail is unambiguous radiometric evidence that the chemtrail is not an ice-crystal contrail because UV absorption by ice throughout the wavelength interval measured is negligible. The absorption coefficient of ice, kice​, at 300 nm is ≤ 0.1m-1​ and 0.665 m-1​ at 250 nm. The nearly 100% reflectivity of snow is further evidence of the extremely low spectral absorbance of ice.
Content from External Source
(The absorption coefficient is a measure of how effectively a material absorbs radiation at a given wavelength. The units are "per metre} so it is essentially the reciprocal of the distance through which the radiation can penetrate. A coefficient of 0.665 m-1​ at 250 nm means that all the 250nm radiation will be absorbed after passing through 1/0.665 = 1.5 metres of ice. The figure of ≤ 0.1m-1​ at 300nm means you would need at last 10 metres of solid ice to absorb all the 300nm radiation.

You can actually see from the diagram that there is more absorption at the lower wavelength - the rear portion of the graph. It dips from the purple (1.1-1.2) to the yellow (0.9-1). Whereas at the front end of the graph (closer to 300nm), the absorption appears fairly minimal - staying within the green (0.7-0.8) band.


But the main problem here is that Herndon is only concerning himself with absorption. The main reason that contrails (and clouds) reduce radiation to the surface is not that they absorb it, but that they reflect it. The incoming radiation will be reflected and scattered by the cloud, so it won't reach the detector.

Herndon even mentions this when he says (in the quote above) "The nearly 100% reflectivity of snow is further evidence of the extremely low spectral absorbance of ice." So if there was a layer of snow up in the sky, would he expect the light to come straight through it?!
What is the actual reflectivity of ice in contrails or cirrus clouds?

This paper quotes measurements from satellite observations. The instrument quoted here did not measure in the 250-300nm range but in the 313-380nm range:

The TOMS instrument on board the Nimbus 7 satellite measures the backscattered radiance from the earth in six 1-nm-wide spectral bands in the UV, centered at 380, 360, 340, 331, 318, and 313 nm.
Content from External Source
At these wavelengths "thin cirrus clouds" (and therefore contrails) reflect 15-25% of UV light:

A 100% cloud-filled FO¾ for a cumulonimbus cloud may have a typical TOMS reflectivity of 70-80%, while a 100% cloud-filled FO¾ of thin cirrus cloud may have a typical reflectivity of 15-25%
Content from External Source
Indeed, given the inverse correlation between absorption and reflectivity (if incoming light is not absorbed, it must be reflected!), then Herndon's own figures show that ice crystals will scatter and reflect a significant proportion of the incoming UV radiation away from the sensor.
 
Back
Top