Visualizing Flight Paths Above 30,000 Feet

Mick West

Administrator
Staff member
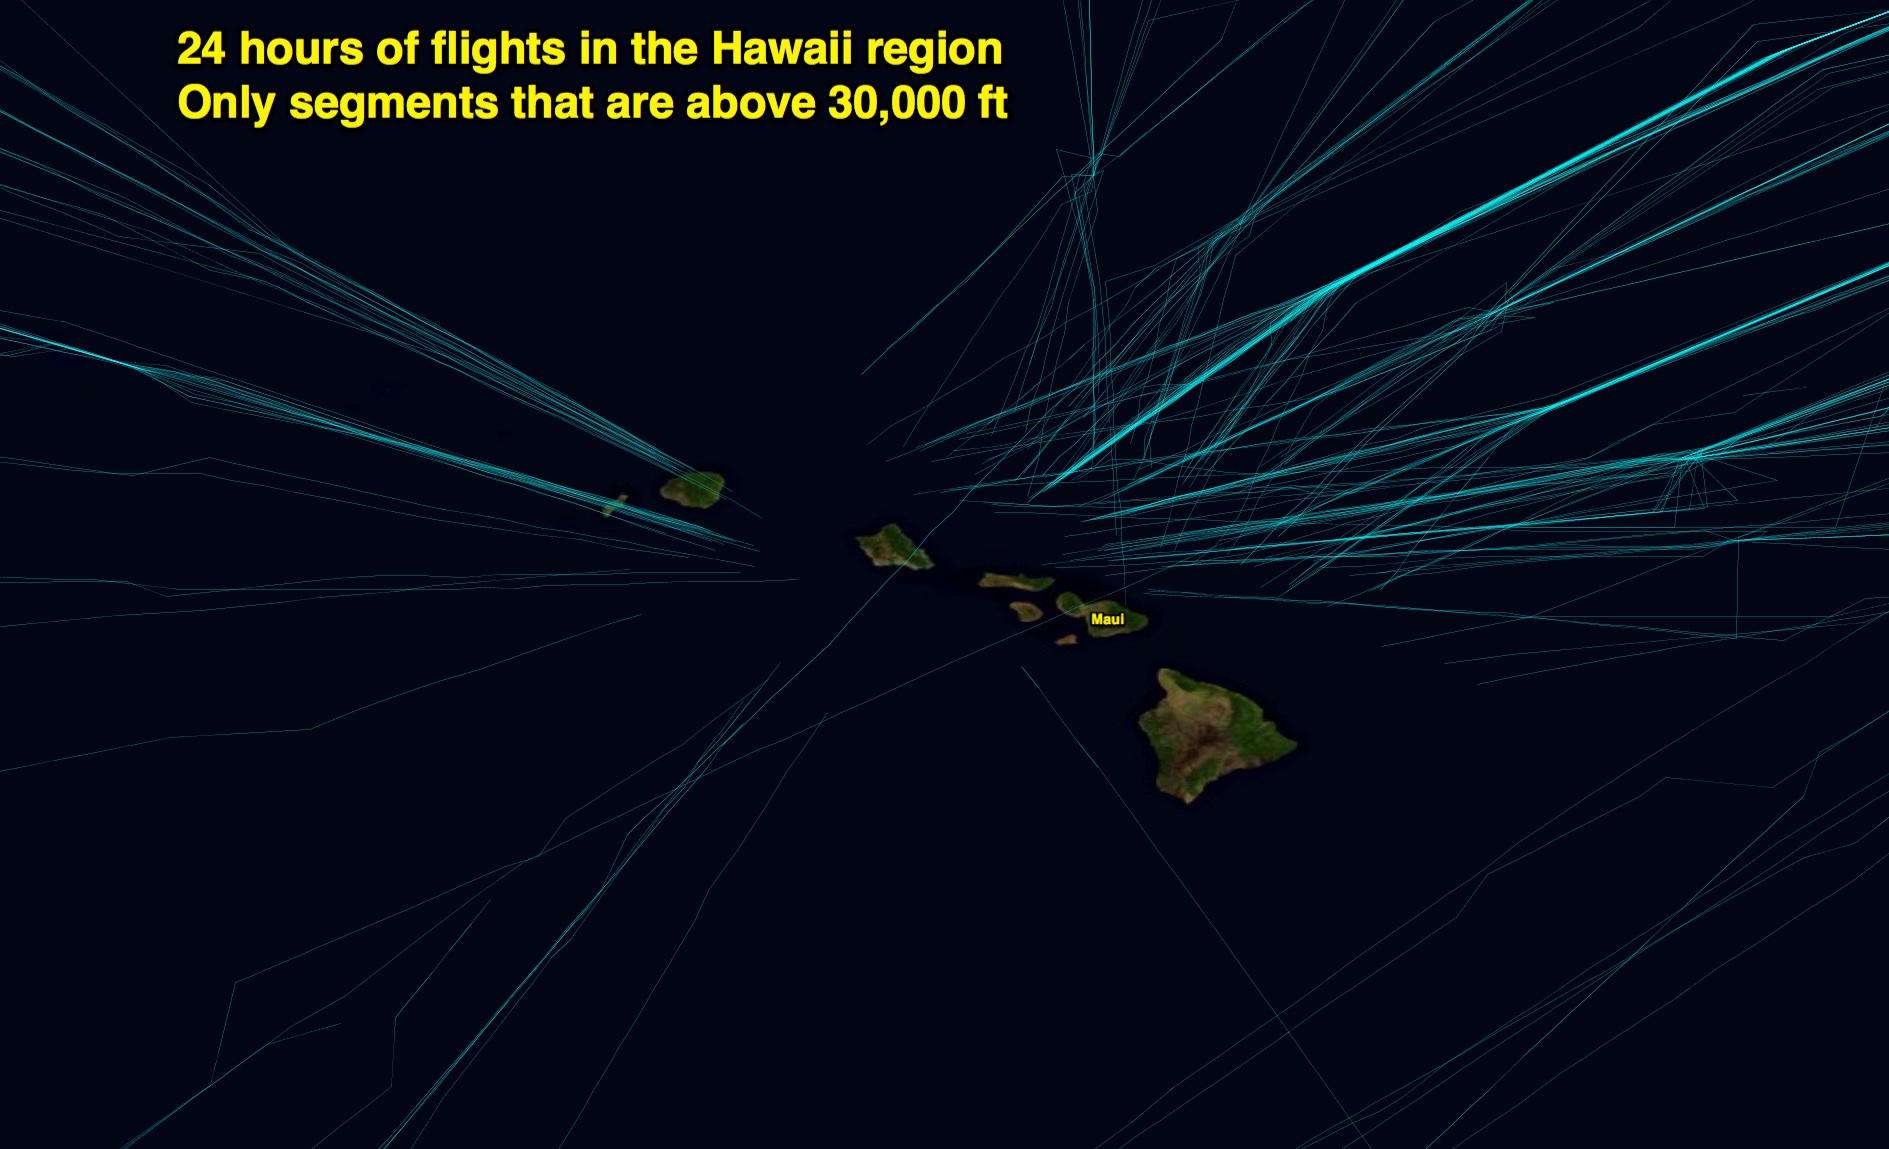
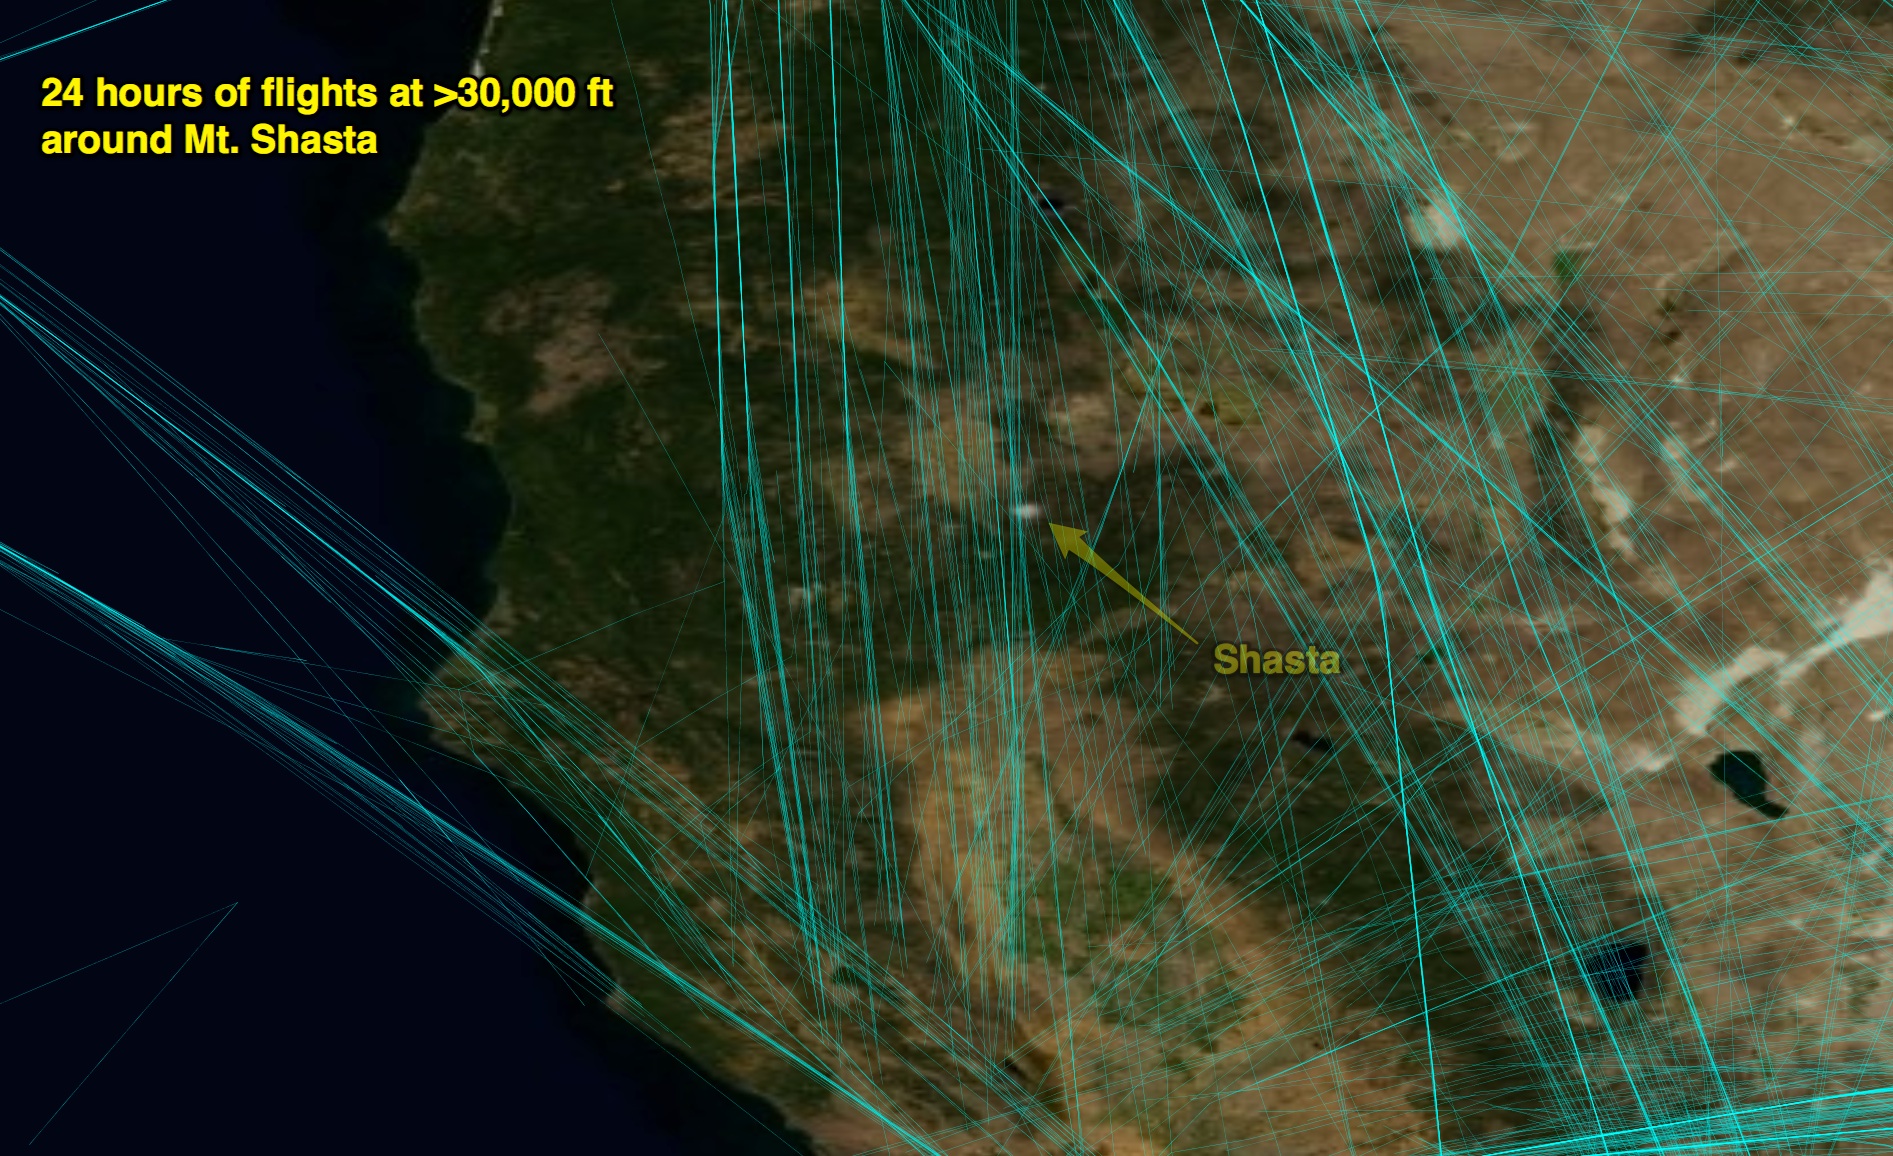
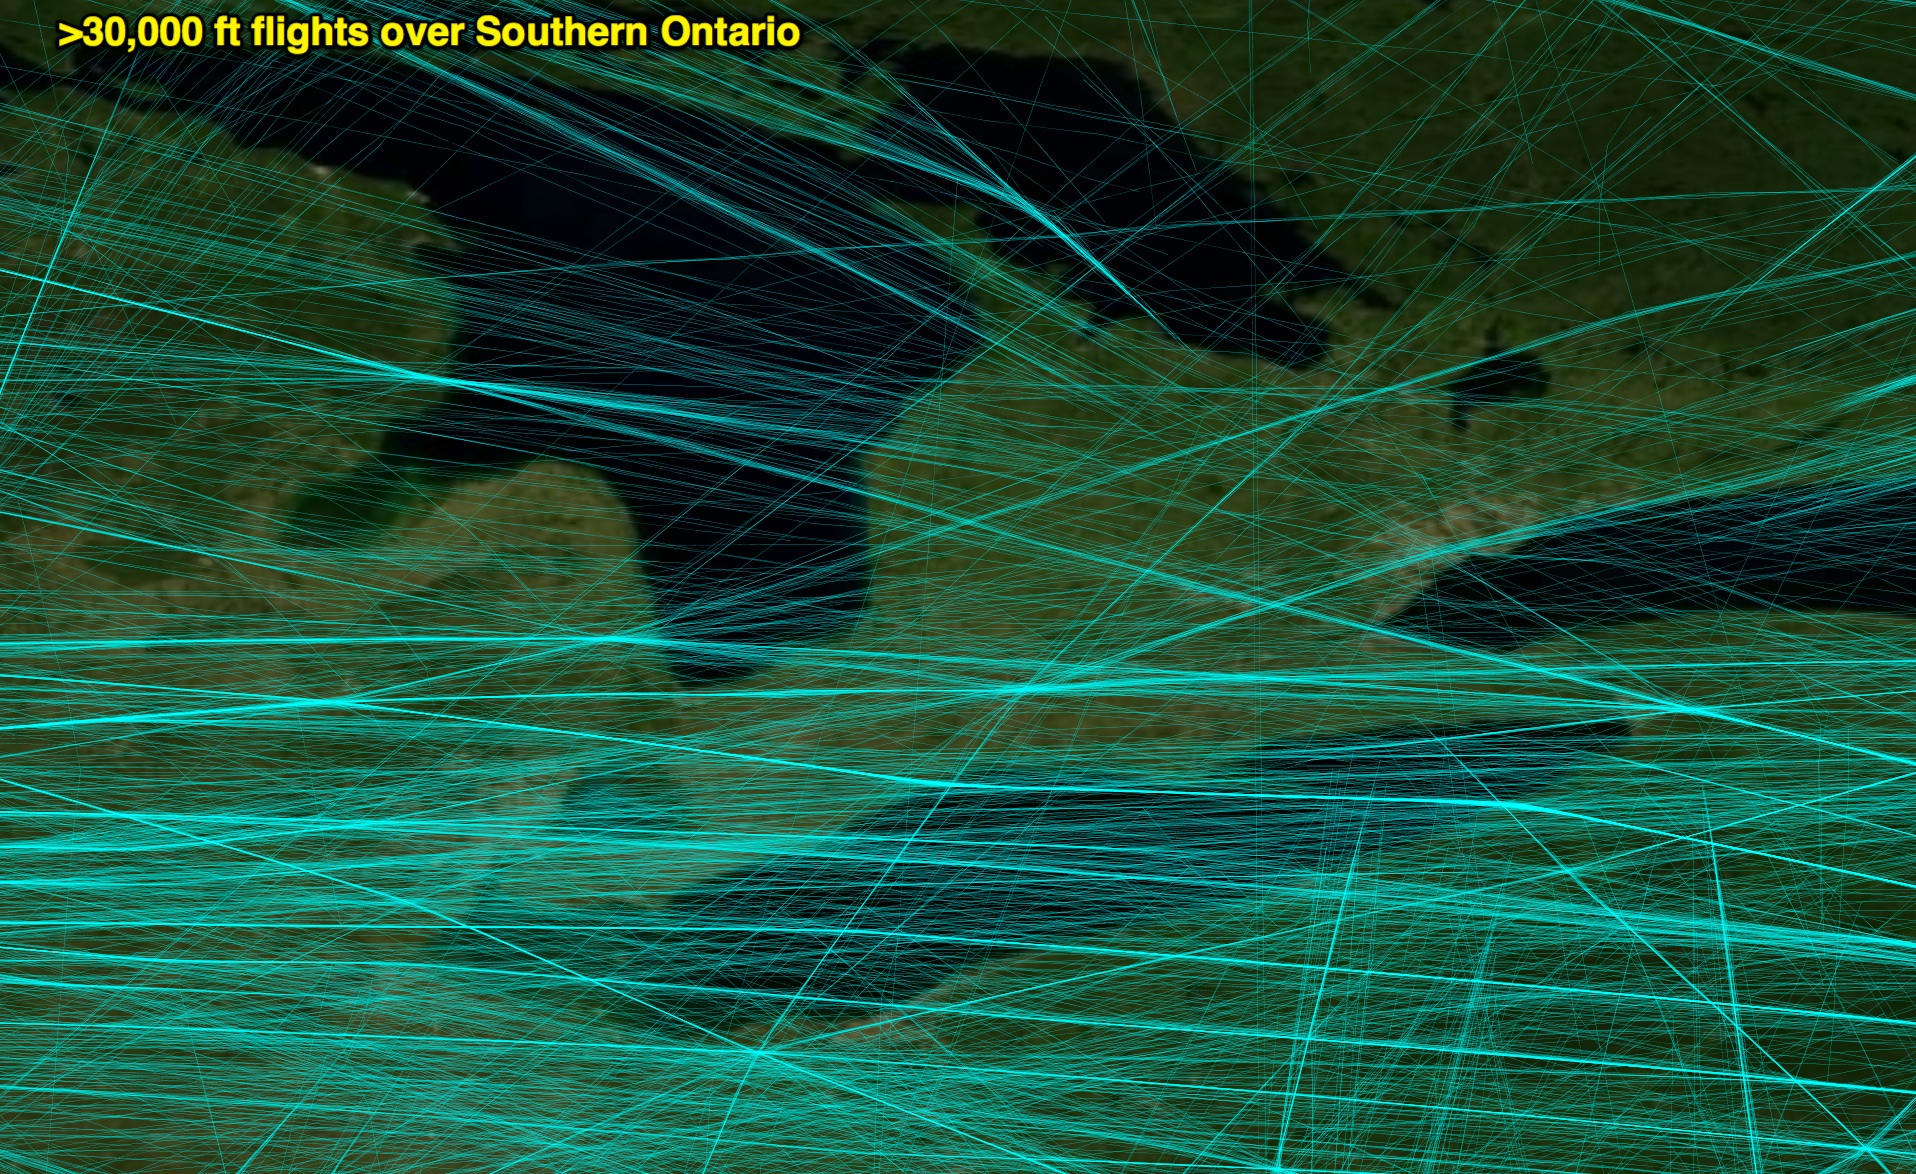
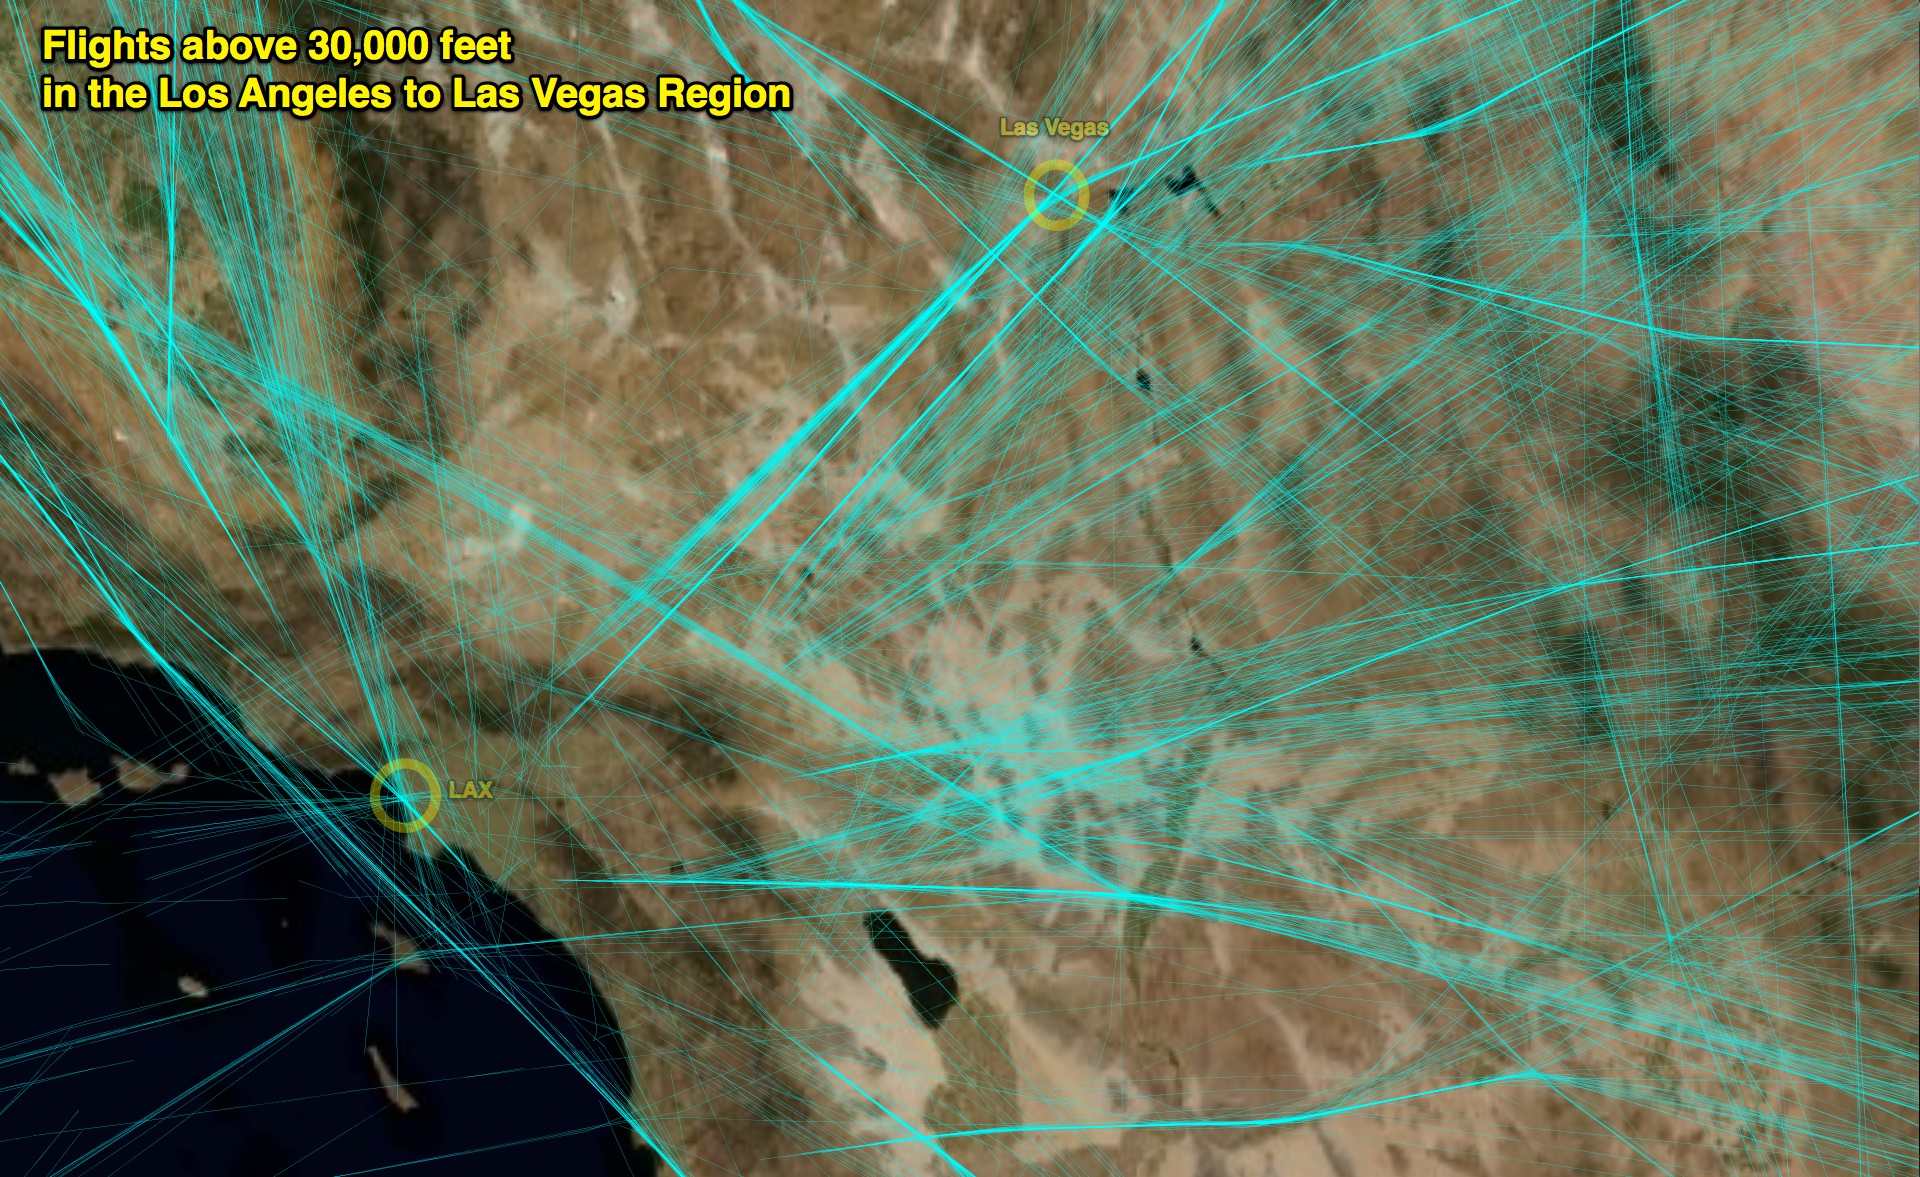
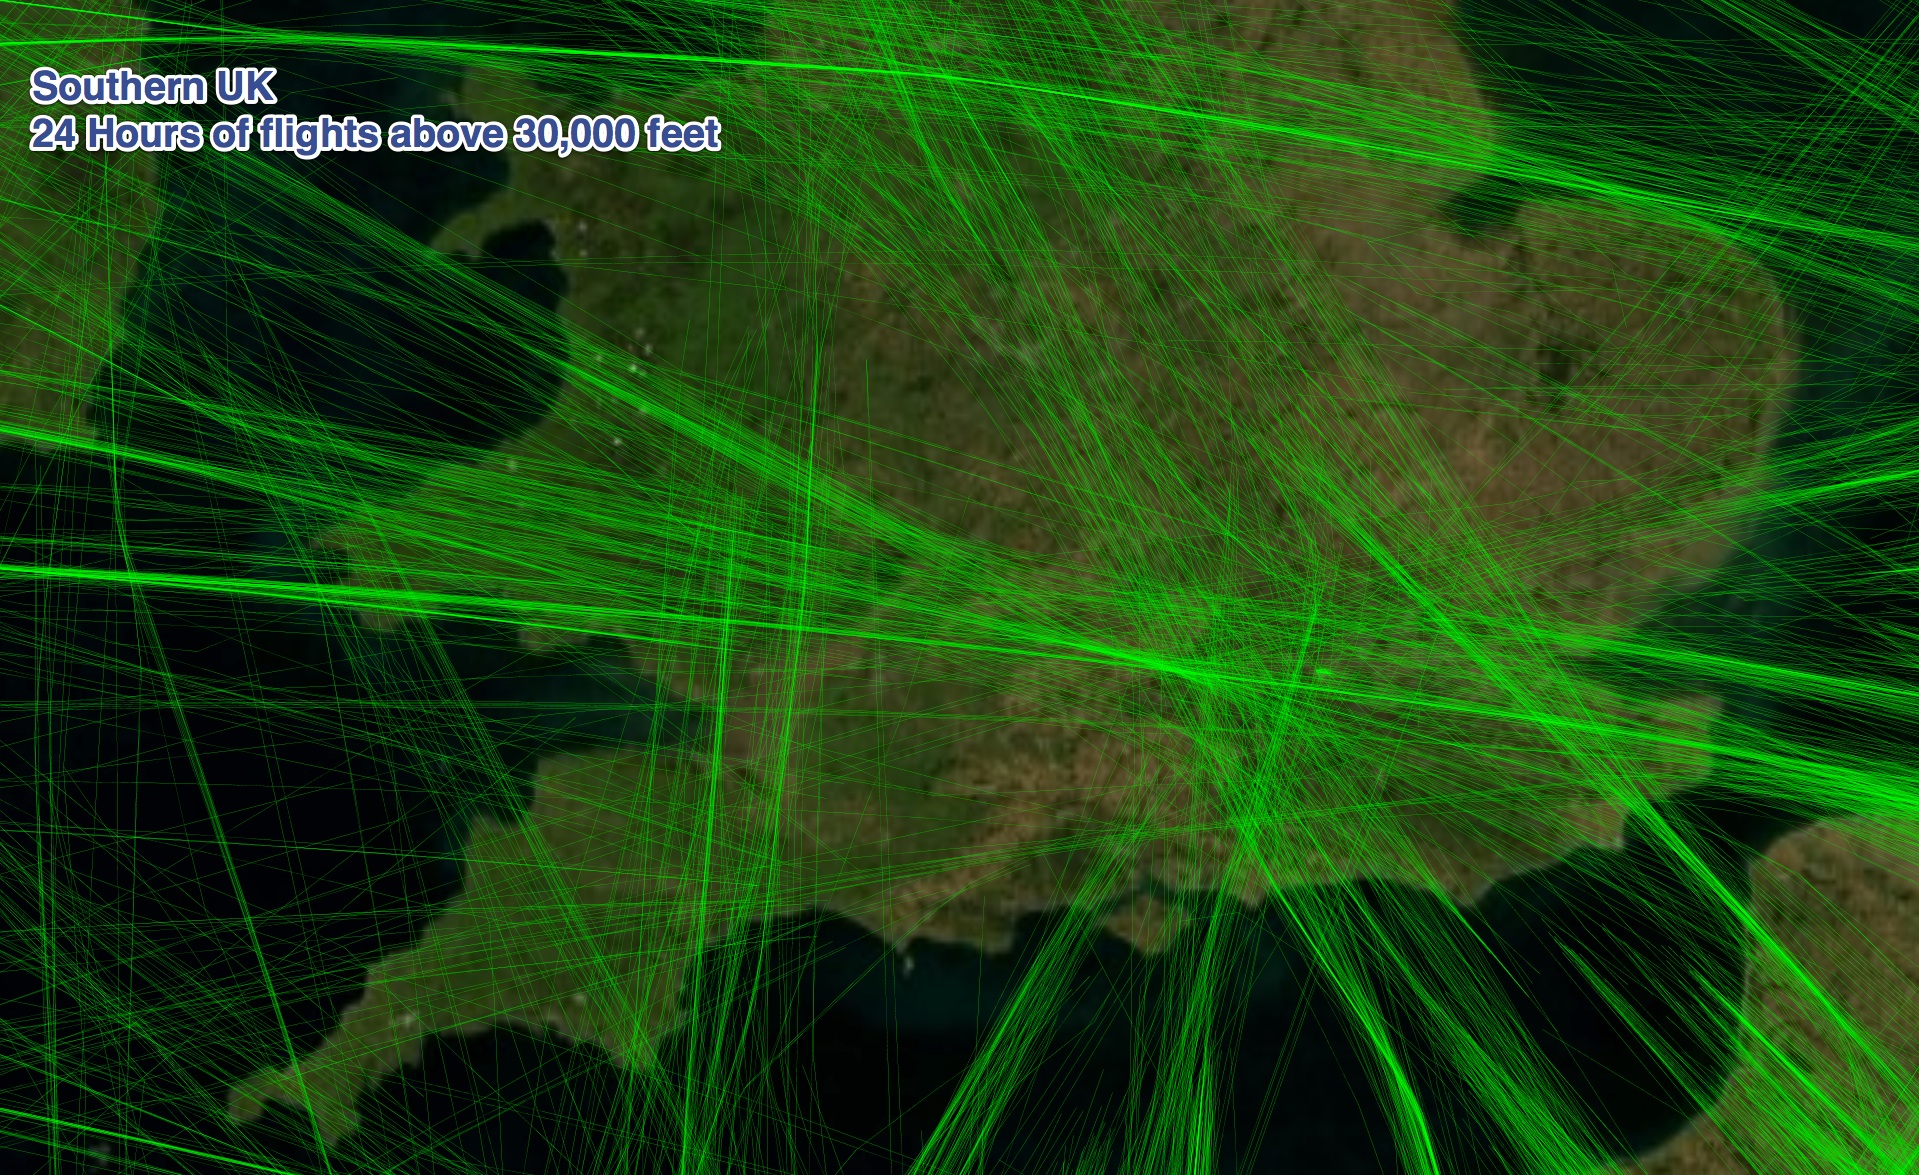
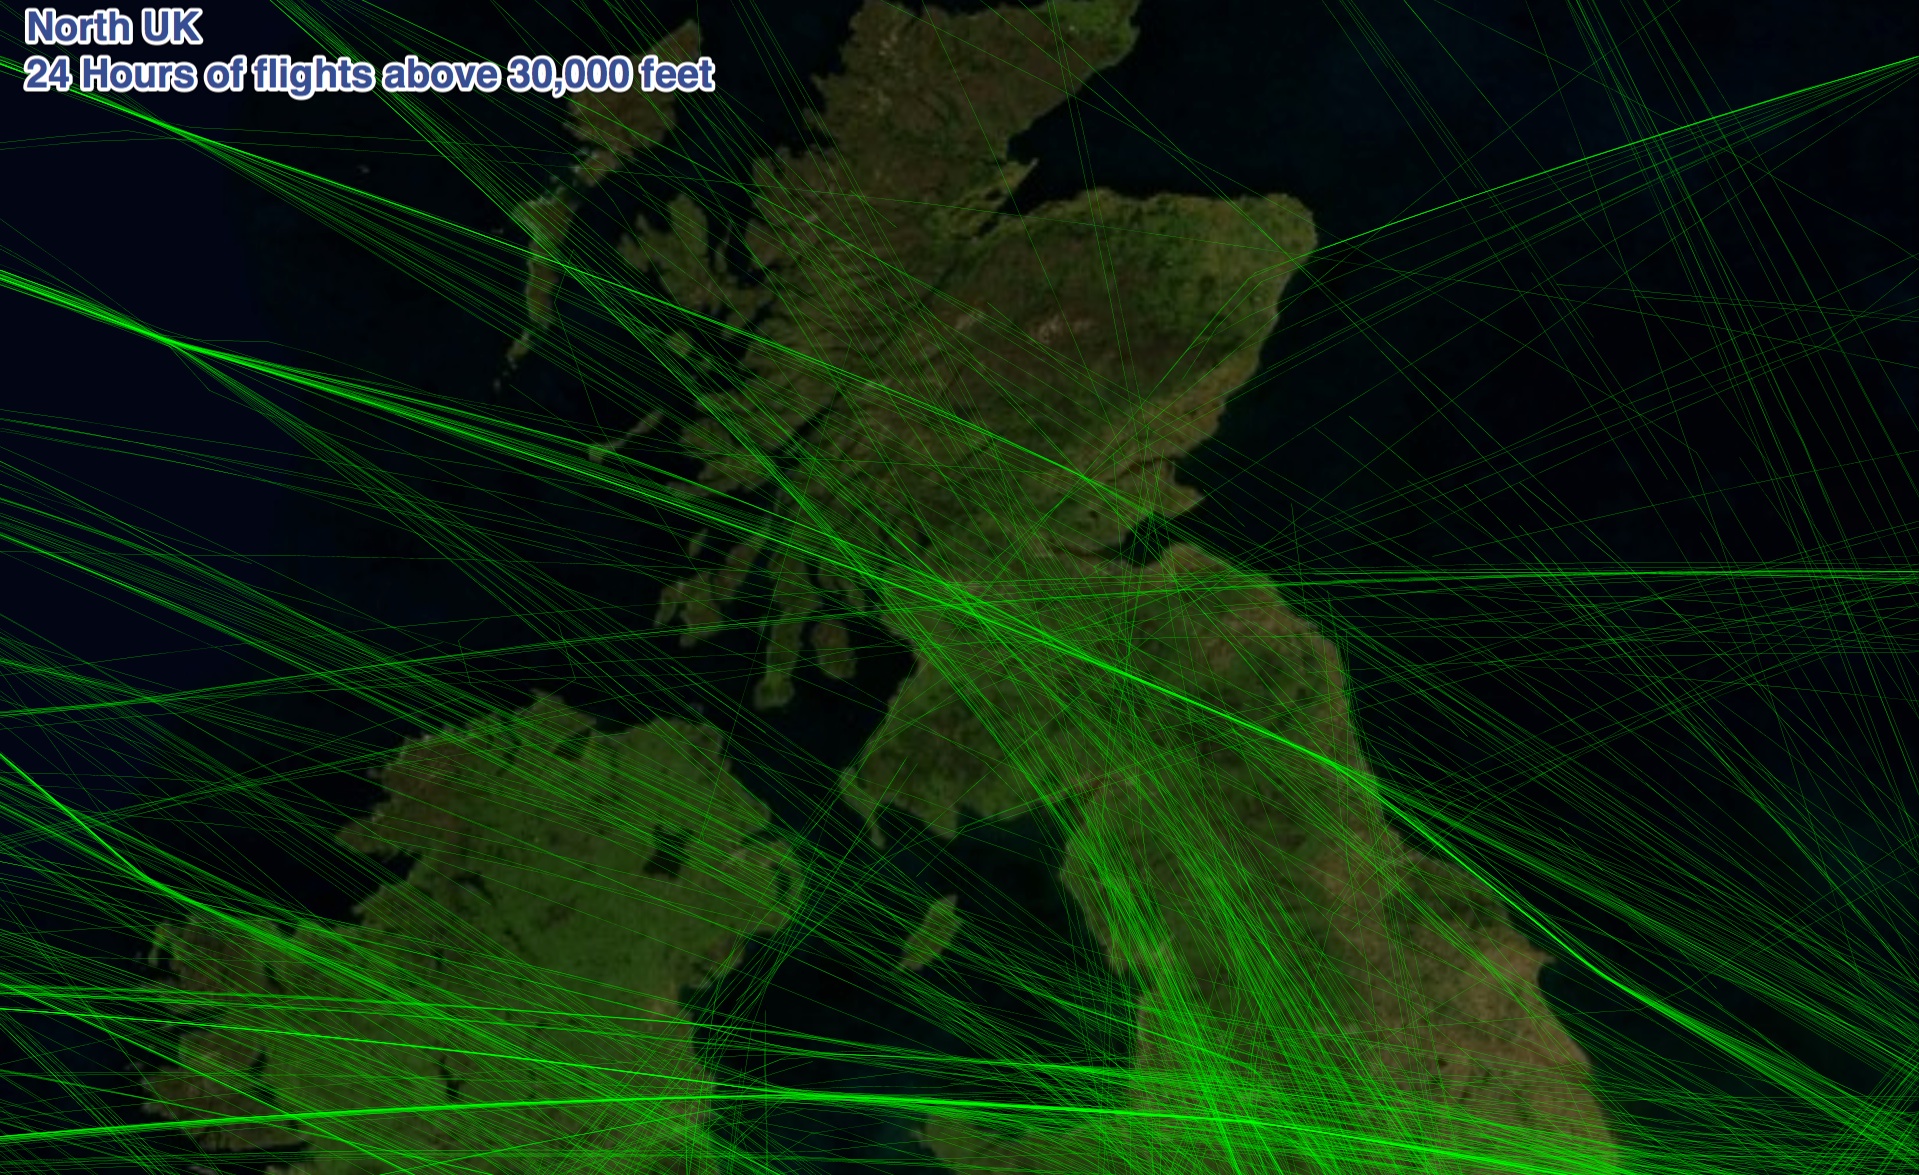
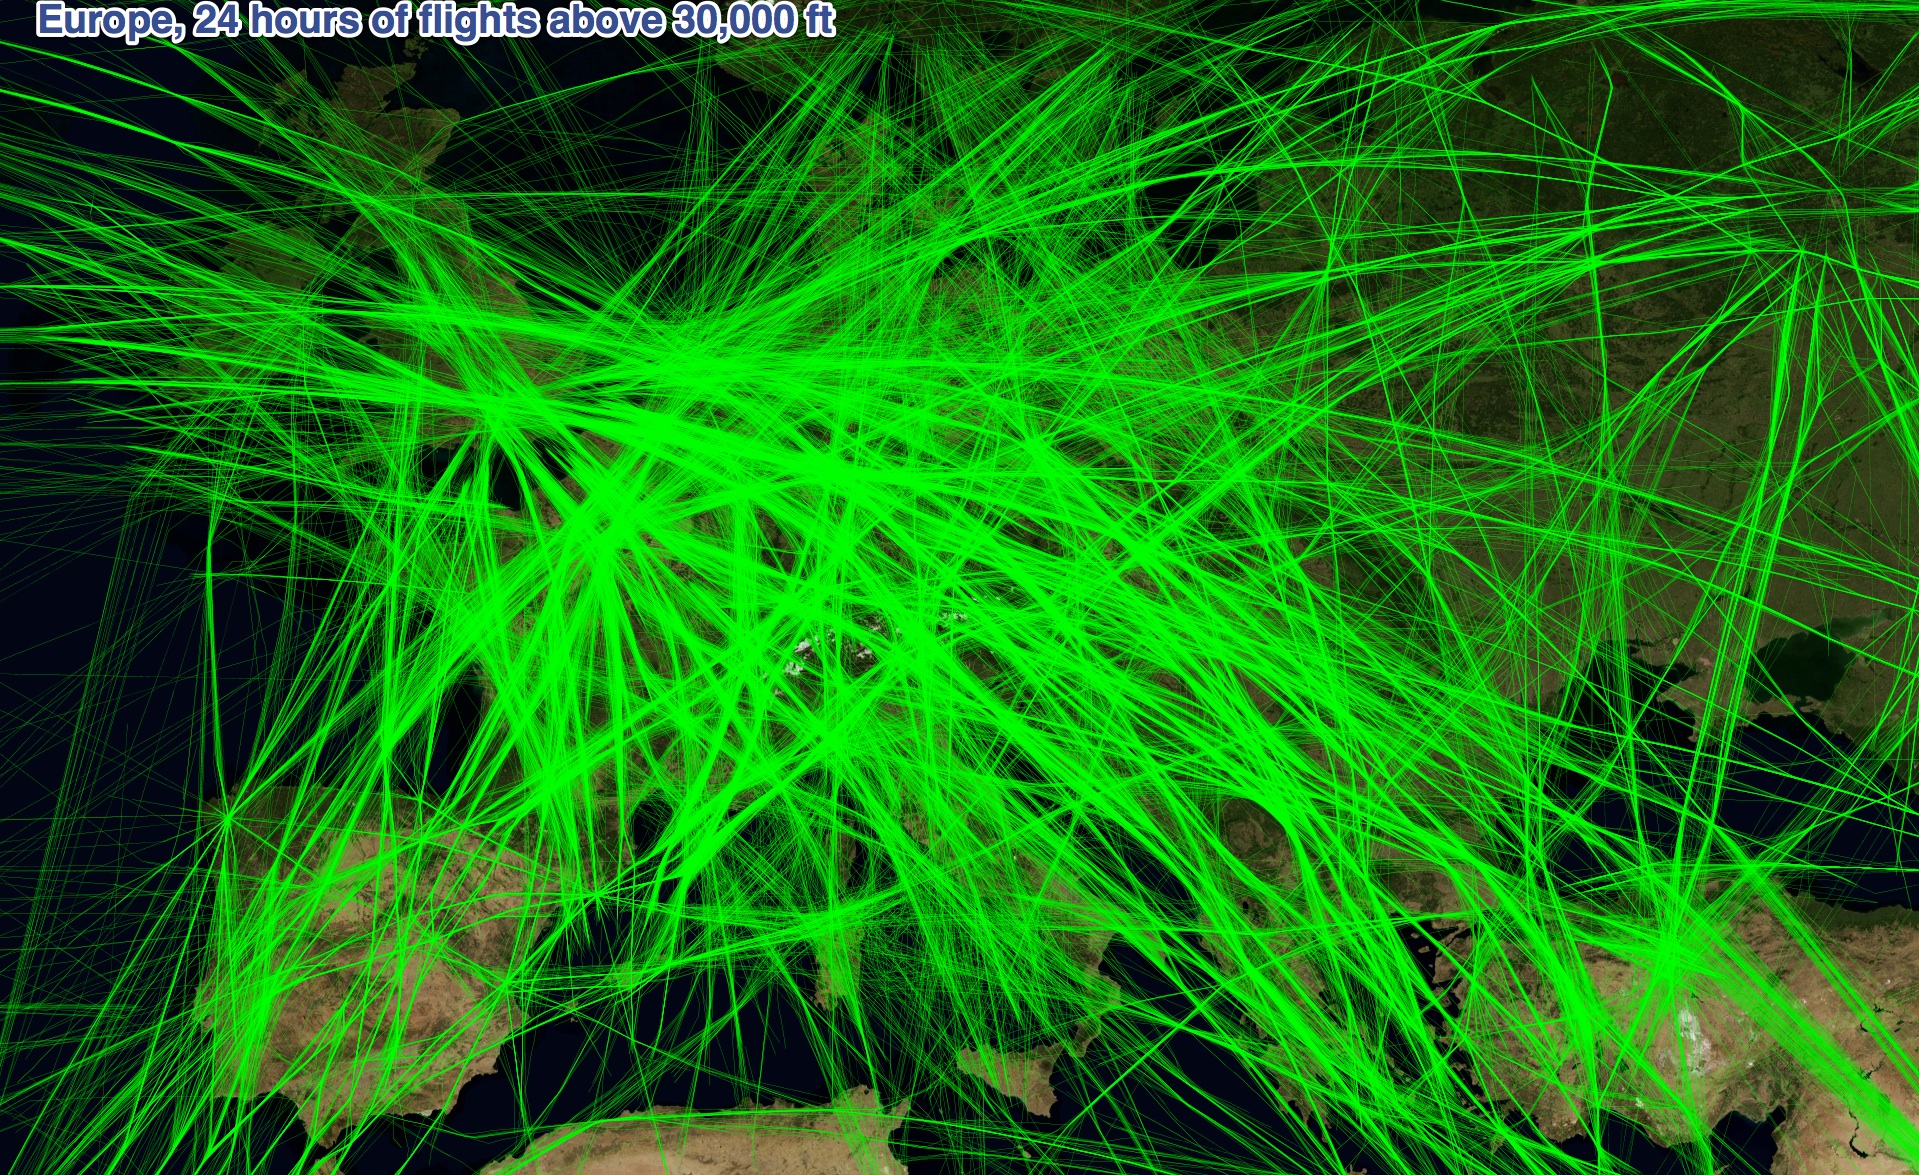
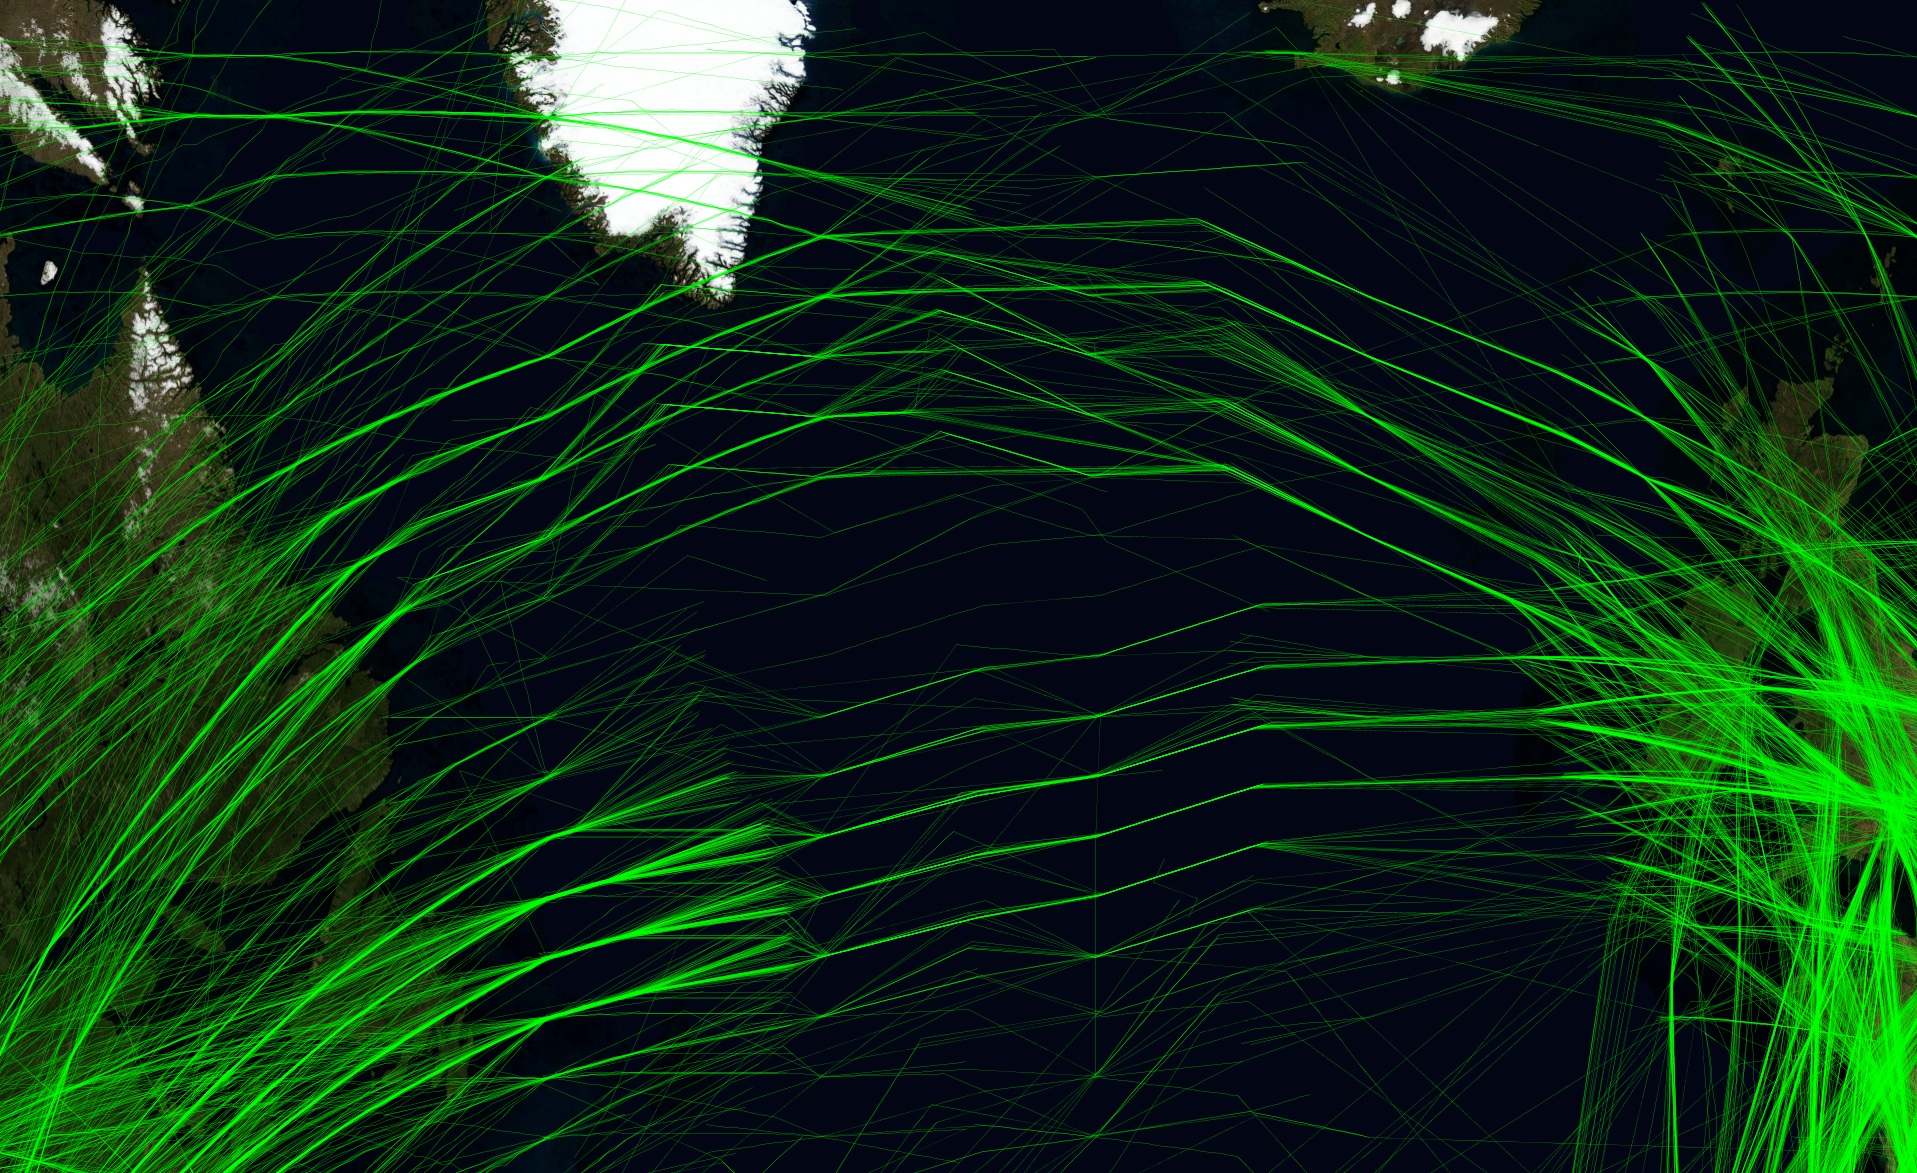
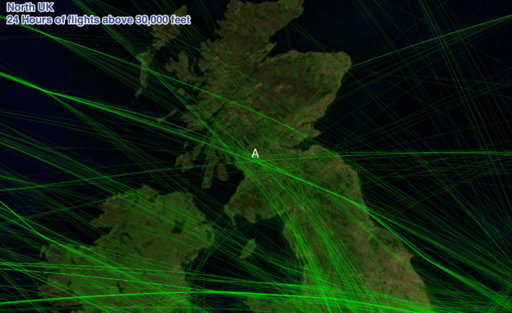
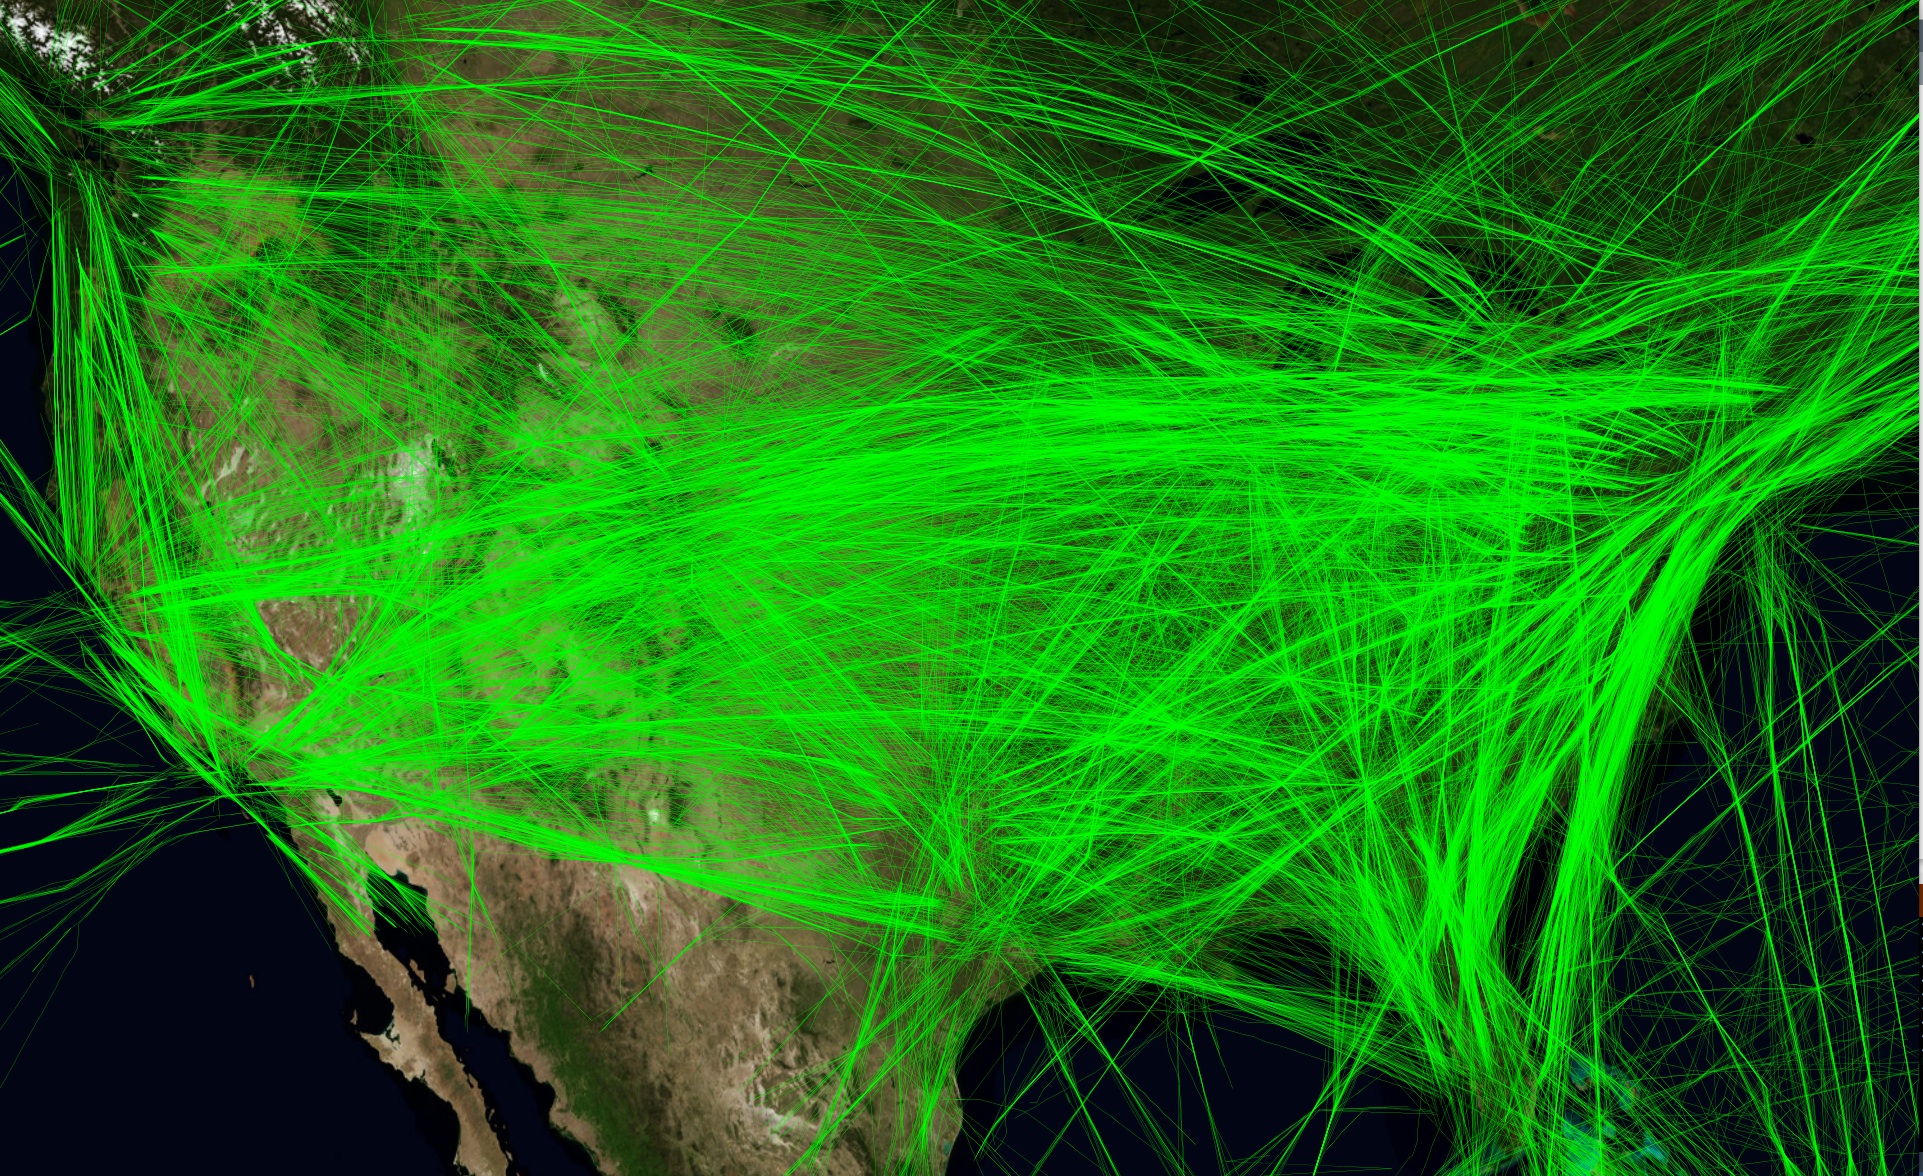
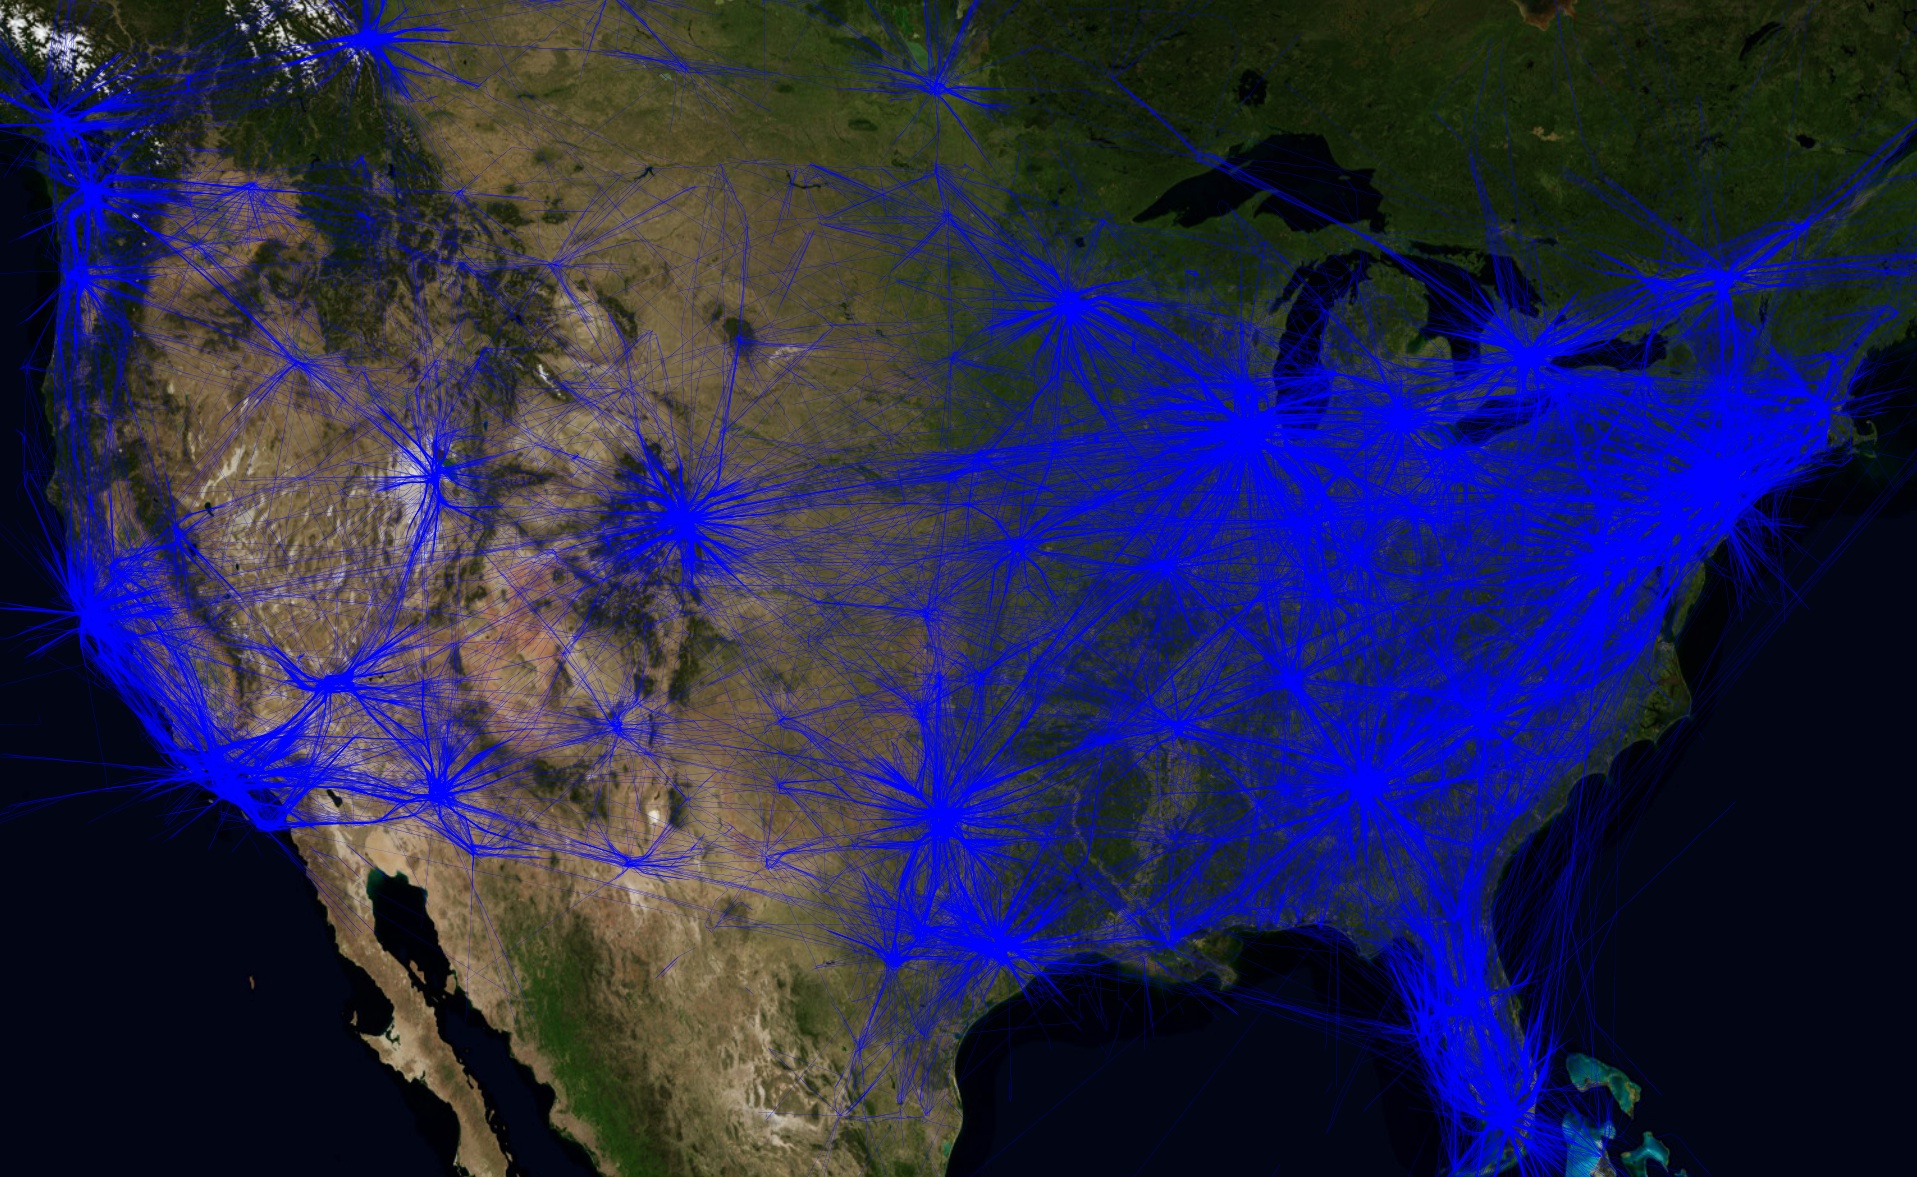
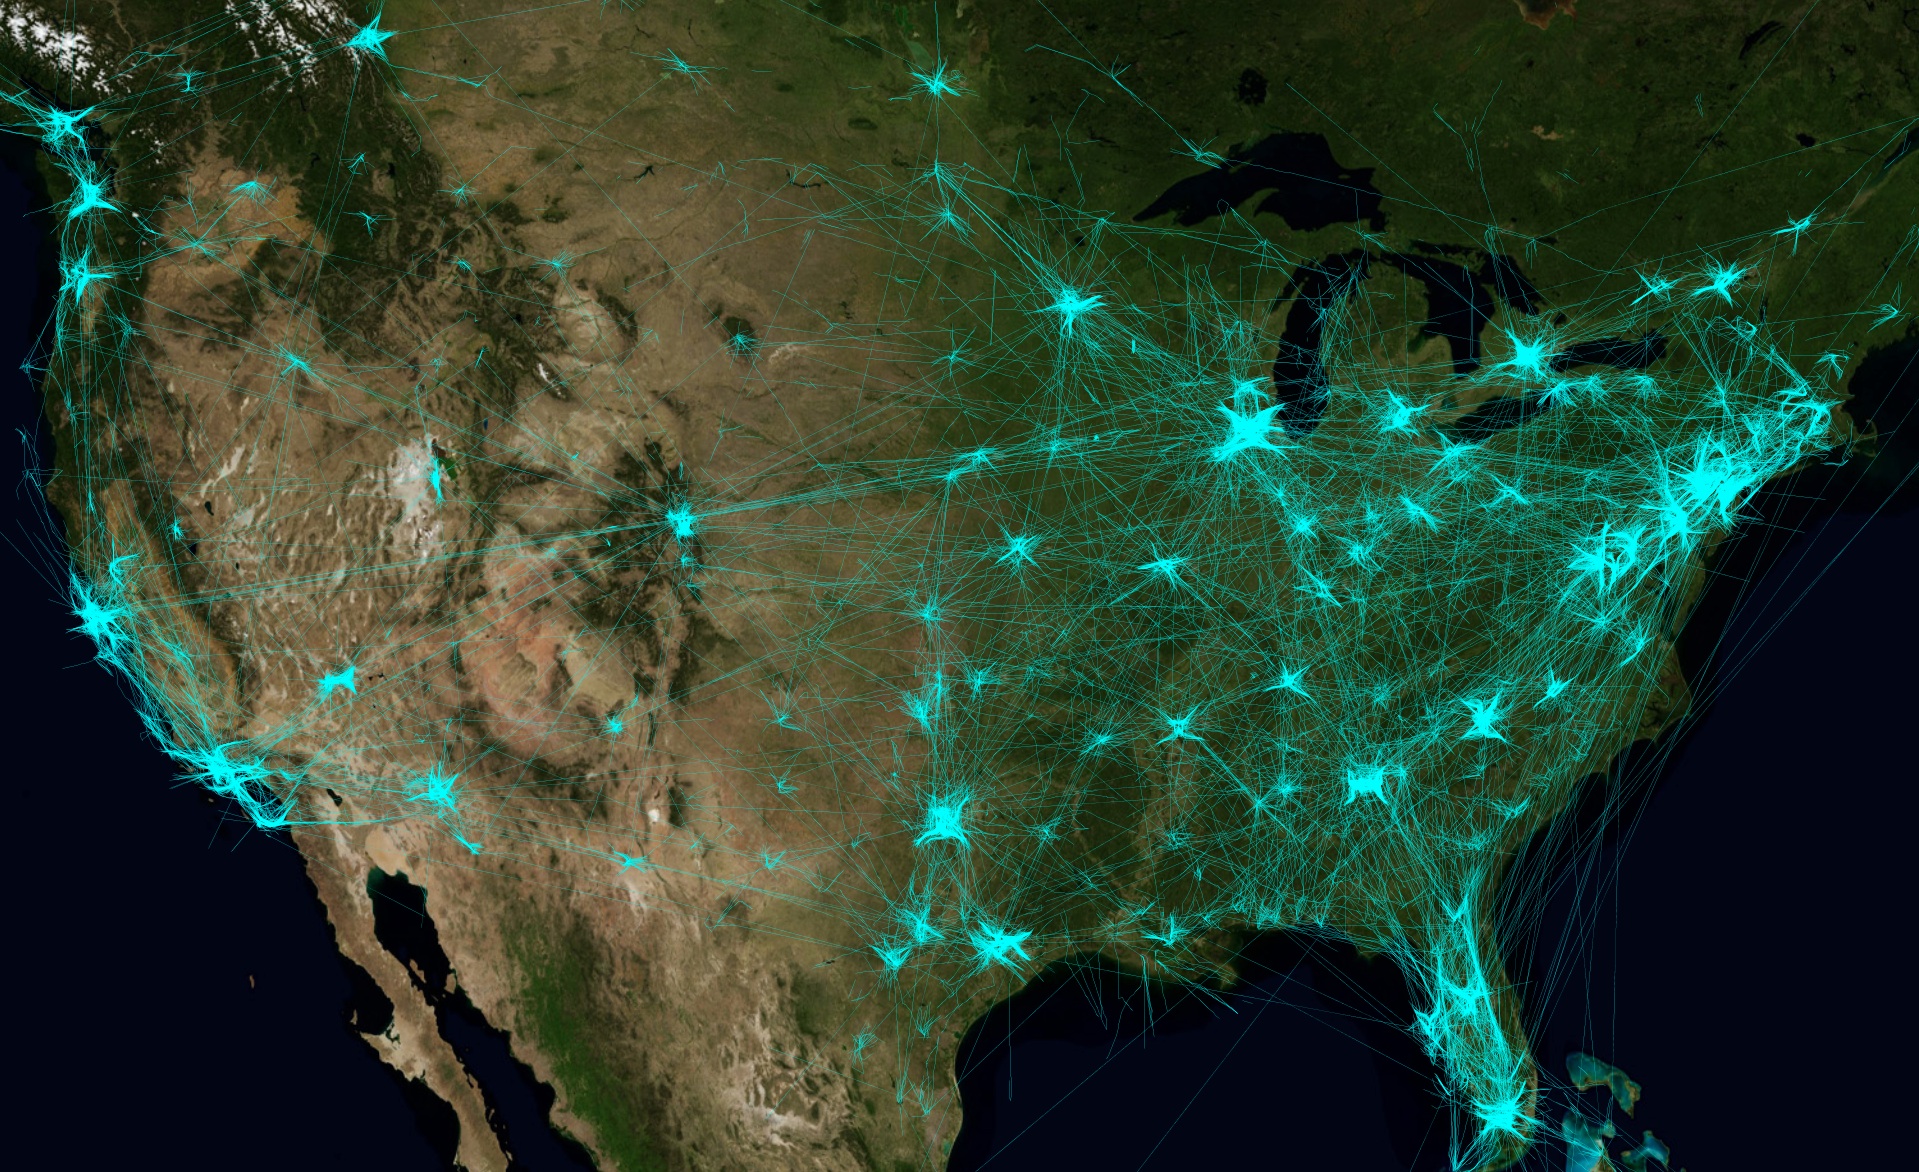
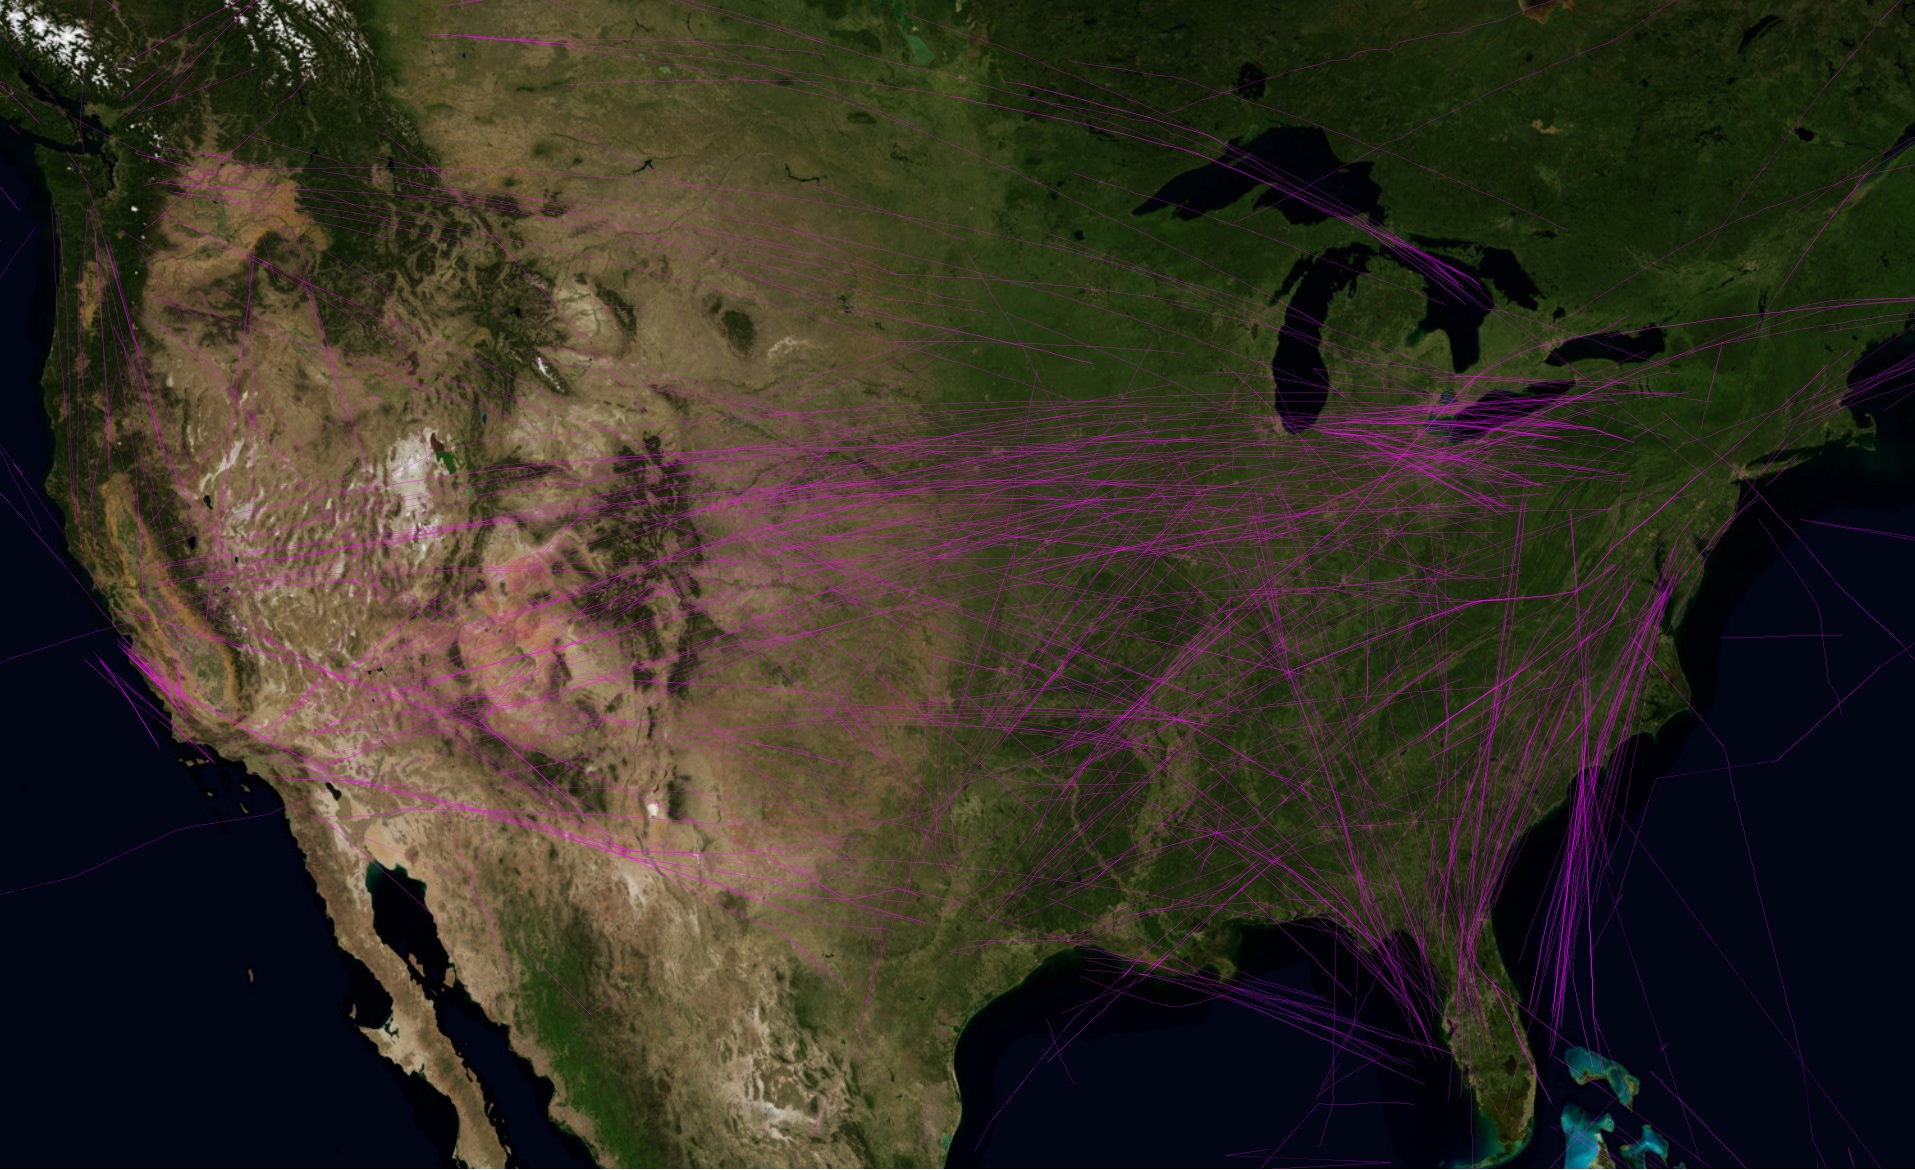
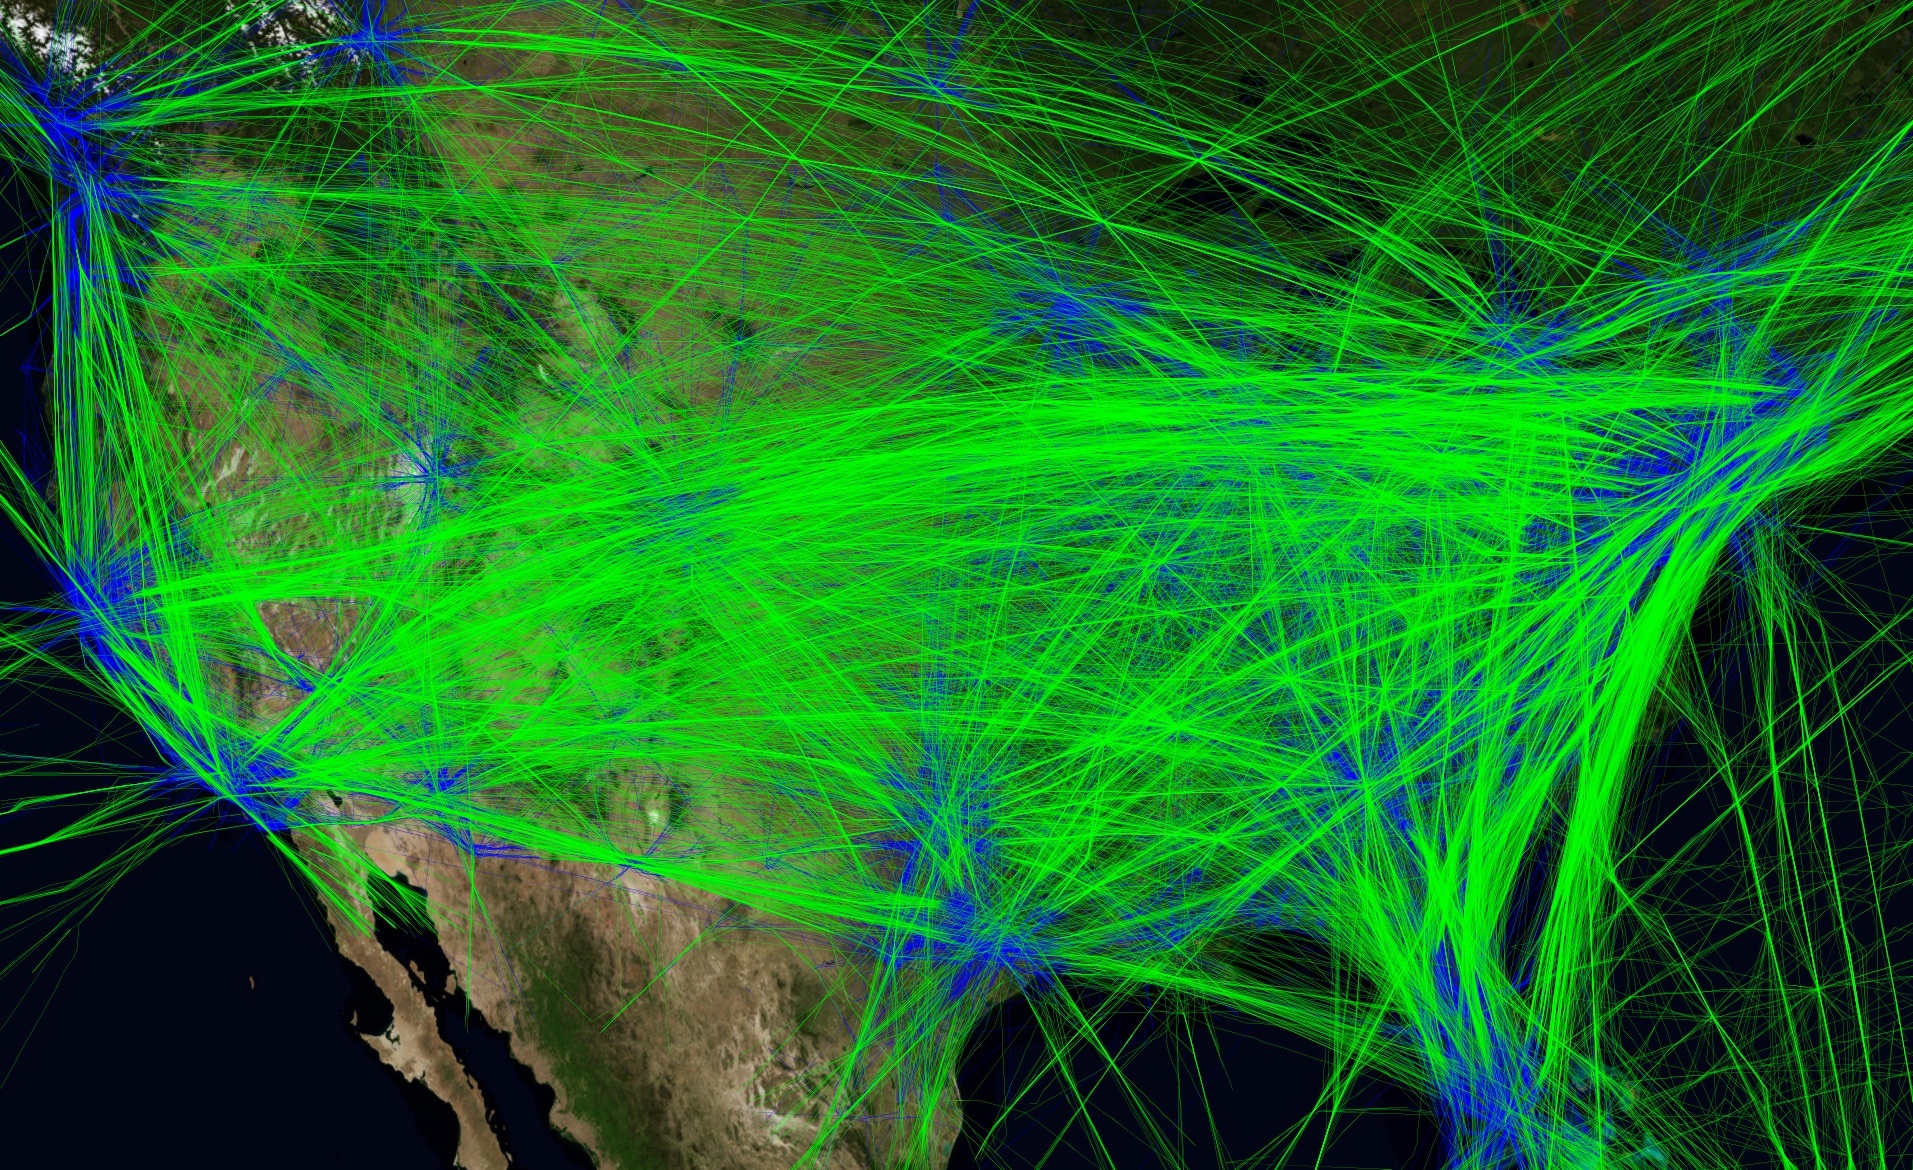
I managed to get some FAA & ADS-B flight data for a 24 hour period from a few days ago, so I've been playing with some visualizations. This is all the flights, but only indicated when they are ABOVE 30,000 feet. Notice how the lines all end short of their destination cities. THis gives a much more accurate indication of the criss-cross nature of flights paths that might produce contrails, and shows there's pretty much nowhere in the country that will not get contrail grids in the sky from time to time.

 
Last edited:
Below 10k. I've not got it lined up right. Will fix eventually.

These are essentially the on-ramps and off-ramps of the airports.

 
Last edited:
Flight segments above 40,000 feet. There were a few (about 15-20) segments of longer flights that went above 45,000 feet, none above 50,000

 
Last edited:
This is the above 30,000 feet (green) overlaid over below 30,000 feet (blue). You can see there are several non-flyover areas that still get a lot of traffic, but it won't leave contrails.

 
Last edited:
This looks like you have achieved some artistry here, Mick. Congratulations, and I can imagine this will be very useful......
 
Probably asking too much but it would be good to see comparisons with 10/20 years ago.
 
Here's something I've long suspected - there's hardly any overflights in Hawaii, it's about 99.5% incoming and outgoing traffic. So it's very unlikely anyone there is seeing lots of contrails directly overhead

 
Last edited:
Whereas Shasta has a lot. It's interesting that you get chemtrail promoters in both places, but the ones from Hawaii tend to be a little more imaginative in what they classify as "chem".


While there's not a lot of East-West traffic directly over Shasta, there is some not far to the East. Contrails can be seen for about 100 miles in any direction. More from high altitudes. Mt Shasta is about 100 miles from the coast, so all of the contrails between Shasta and the coast will be visible at Shasta - especially if there's a westerly wind blowing them inland.
 
Last edited:
This is a region that someone on Above Top Secret was claiming had very little regular traffic:

 
Last edited:
My area. You can see how LAX is used as a nav point for flights to Long Beach and San Diego

 
Last edited:
Any requests? The data covers the US and Europe quite well, and has origin and destination airport, and plane types, so I can do some pretty nice filtering.

This should be very useful to show to people who claim they live somewhere with very little air traffic.
 
Any requests? The data covers the US and Europe quite well, and has origin and destination airport, and plane types, so I can do some pretty nice filtering.

This should be very useful to show to people who claim they live somewhere with very little air traffic.
Can this be animated?
 
Can this be animated?

Yes, but it would probably take a while, both for me to do, and to render. What region/filters did you have in mind?

I'm not going to be able to do much on this for a few days after today. But it's fascinating stuff, so I'll be spending more time on it in the future.
 
I'd like to see Mt. Shasta with a geographic background like above, showing a 24 hour progression of flights > 30,000 ft.
If it would shorten things, just a dusk to dawn time period would be fine.
Thanks for considering this, since it will be very effective for a presentation I'm working on...
 
The entire planet.

This illustrates the problems with the data set, which is a combination of FAA data and ADS-B from a volunteer network - so it's rather patchy in most places outside the US and Europe. Some of it is pretty random, like Mauritius has coverage, but india does not.

 
Last edited:
Ah, Europe !

The area where you don't see the ground anymore under all those threads, pretty much in the center - this is the place that I call home ...

Contrary to the Californians around here, I have all sorts of contrails nearly every day. Now I can see why my chance is so big.
 
Yep there's a lot more pollution "up there" - but it is still only a fraction of the pollution we generate "down here" from surface vehicles & industrial activities!!
 
I am roughly where the A is, right beside Glasgow Airport (not the Glasgow Prestwick which is actually 30 miles away). Don't usually see any contrails from these flight overhead, except on the 2 days a year when it doesn't rain
 

Attachments

  • ME.jpg
    ME.jpg
    2.4 MB · Views: 863
Traffic over the North Atlantic is interesting:

There is a good reason why they look that way.

wikipedia said:
North Atlantic Tracks (NAT) are trans-Atlantic routes that stretch from the northeast of North America to western Europe across the Atlantic Ocean. They ensure aircraft are separated over the ocean, where there is little radar coverage. These heavily-traveled routes are used by aircraft traveling between North America and Europe, flying between the altitudes of 28,500 and 42,000 feet. Entrance and movement along these tracks is controlled by special Oceanic Center air traffic controllers to maintain separation between airplanes. The primary purpose of these routes is to provide a Minimum Time Route (MTR). They are aligned in such a way as to minimize any head winds and maximize tail winds impact on the aircraft. This results in much more efficiency by reducing fuel burn and flight time. To make such efficiencies possible, the routes are created daily to take account of the shifting of the winds aloft.
http://en.wikipedia.org/wiki/North_Atlantic_Tracks
 
I am roughly where the A is, right beside Glasgow Airport (not the Glasgow Prestwick which is actually 30 miles away). Don't usually see any contrails from these flight overhead, except on the 2 days a year when it doesn't rain

Yeah, it's really quite amazing how FEW contrails we see, given the vast amounts of flight criss-crossing over our heads every day.

Varies with local climate though.
 
Last edited by a moderator:
Well, it would still require zero wind along the line connecting the points where contrails cross each other in order to explain this pattern. I went back through a few years of satellite images of the opposite side of North Atlantic but failed to find a similar pattern off Irish and/or Scottish coast.

I got this many years ago off the Dundee website, don't remember it's provenance exactly, but its pre 1999:

atlanticsat.jpg

from my contrail gallery:
Goodsky(Jay Reynolds said:
Satellite image of the North Atlantic corridor shows contrails west of Great Britain and in mid-Atlantic forming preferentially ahead of two different frontal systems due to higher moisture as the front approaches.
 
I got this many years ago off the Dundee website, don't remember it's provenance exactly, but its pre 1999:

atlanticsat.jpg

from my contrail gallery:

Thank you, Jay. It is exactly what I was looking for. A similar pattern of contrail crosses on the opposite side of North Atlantic. I think that it is due to both factors: regular spacing of transatlantic routes and the reversal of wind direction ahead of the weather front.

https://www.metabunk.org/threads/605-Interesting-Contrails-create-five-crosses-in-the-Atlantic
 
Last edited by a moderator:
Thank you, Jay. It is exactly what I was looking for. A similar pattern of contrail crosses on the opposite side of North Atlantic. I think that it is due to both factors: regular spacing of transatlantic routes and the reversal of wind direction ahead of the weather front.

https://www.metabunk.org/threads/605-Interesting-Contrails-create-five-crosses-in-the-Atlantic
Or else the order was to turn off the spray when the planes got into dry air west of the front......:rolleyes:
 
Last edited by a moderator:
I'm back! And here's the visualization of >30,000 feet for Australia.


It's all ADS-B so stuff shows up within about 200 miles of a receiver, and if it shows up at other receivers the intervening path is interpolated as a straight line (should actually be a great circle). Looks like Auckland will not be getting many contrails.
 
Last edited:
I'm back! And here's the visualization of >30,000 feet for Australia.


It's all ADS-B so stuff shows up within about 200 miles of a receiver, and if it shows up at other receivers the intervening path is interpolated as a straight line (should actually be a great circle). Looks like Auckland will not be getting many contrails.

Indeed, they don't.

But the places where you would expect them (Taranaki- the westward bulge halfway down the North Island and Nelson, top of the South Island which are underneath the flight paths for most internal traffic, and Northland, top of the North Island, where all the international traffic leaving Auckland goes over) are the exact places the chemtrail believers report the most 'spraying', and are the centers of the small NZ chemtrail community (namely Clare Swinney in Northland, and Will Ryan in Nelson).

http://chemtrailsnorthnz.wordpress.com/?s=nelson
http://chemtrailsnorthnz.wordpress.com/?s=taranaki
http://chemtrailsnorthnz.wordpress.com/?s=nelson
 
Last edited by a moderator:
The New Zealand map looks pretty good, still ADS-B technology is not widely utilized in the domestic jet fleet and not used at all by air traffic controllers, Air New Zealand still operates 13 Boeing 737-300's on domestic routes, most if not all of them are not ADSB equipped as they are to be replaced with new Airbus A320's. The current Air NZ domestic A320's are ADSB equipped aswell as the Jetstar domestic Buses. Certainly shows the domestic route structure nicely though. The crossing international tracks into and out of wellington show how grid patterns can be fromed over Nelson. Auckland does get the odd overflight been quite a few international services from Nadi to Christchurch recently which pass overhead nicely. There has also been quite a few overflights by Qantas B747 australia-south america flights, I have never heard such grumpy pilots, it sure is a long way!
 
Back
Top