
useful rh and water vapor links
- Relative Humidity over the US at 300mb (about 30,000 feet) via Instant Weather Maps.
- Relative Humidity over Europe at 300mb (about 30,000 feet) via Instant Weather Maps.
- Twisterdata US RH map at 300mb (30,000ft), 250mb (34,000 ft), 200mb (38,600 ft)
- GOES-16 (East) water vapor: Lower (10), Mid Level (9), Upper level (8)
- GOES-17 (West) water vapor: Lower (10), Mid Level (9), Upper level (8)
The use of often highly inaccurate radiosonde (weather balloon) relative humidity (RH) readings for contrail prediction is a common problem in the "chemtrail" conspiracy community. Exhaust contrails need RH level above around 60%, and temperatures below about -40°C/-40°F. Unfortunately many of the radiosondes simply don't work at that temperature (and are inaccurate at warmer temperatures). They are also very widely spaced (hundreds of miles apart) and are generally only used every 12 hours, during which time the local RH at altitude can vary as much as 80%, for the simple reason that the air at that altitude is moving at up to 100 miles per hour.
So I think it would really help the conversation if we could not only explain this, but give a variety of resources to allow people to more accurately determine the RH at flight altitudes (around 30,000 to 45,000 feet). This will help people understand why there are contrails one day, but not the next)
I'd like to use this thread initially for discussion of this, and eventually add a useful list of resources to this post for easy reference later.
An initial point of confusion is that in most of these resources, the altitude is measured in mb (millibars of pressure), and not feet of meters. (You will also see hPa, which is exactly the same unit as mb)) This actually makes sense for planes, as they fly (and report their altitude) as pressure altitude, and not the actual altitude (which they can now get from GPS). There's a full discussion of the relationship between mb and altitude here, but for out purposes there's generally four mb values that cover the range we'd use for exhaust contrails:
300 mb -> 30,000 feet
250 mb -> 34,000 feet
200 mb -> 38,600 feet
150 mb -> 44,300 feet
If you don't know the altitude of the plane you are observing, then ideally use the 250mb/34000feet observation. Some sites don't have this, so 300mb/30,000 feet is a good option - as well as being easy to remember.
Note this covers the normal altitudes of exhaust contrails - i.e. those formed by the addition of water to the atmosphere from the engine exhaust. It does not cover persistent aerodynamic contrails, which more typically occur below 25,000 feet (and almost always below 34,000 feet). For those we can add:
450 mb -> 20800 feet
400 mb -> 23500 feet
350 mb -> 26600 feet
Here I'll focus on the more common exhaust contrails, but the contrail observer should always be aware of the possibility that they are looking at aerodynamic contrails, as they can look quite similar from a distance.
GFS and RAP Model Forecast RH
All RH readings you get are some kind of forecast. Unless you are actually in the plane, directly sampling the air outside, there is really no way of knowing exactly what the RH level is. Somewhat circularly the best indication of current upper air high RH is the presence of contrails. The radiosonde data is theoretically a good measurement, but as noted it's highly inaccurate, and highly limited in terms of time and location.
So what we use instead are very short range weather forecasts. Weather forecasts are computer models that take an incredibly large number of readings of many different types (ground readings, satellite readings, radiosondes, and aircraft readings), and then simulate the weather of the entire planet in order to predict what the weather will be in the future. Long range forecasts of several days are only roughly accurate, however the forecasts can be made for just a few hours, or even minutes, in the future. A forecast model can also give a "zero hour" (0h) forecast, which is what it calculates the weather to be right now (although typically it only creates these every few hours).
The most common one I've been using is the GFS model. GFS is the Global Forecast System run by the United States National Weather Service (NWS). Being government run the data from the GFS is free, and hence lots of different sites use it to create weather forecasts for different purposes. While not the most accurate for long term forecasting, it's still a reasonably accurate indicator of current conditions. And by looking at previous 0h forecasts we can use it as a reasonably accurate historical record of past conditions.
So what WE want is the Relative Humidity and temperature at flight altitudes, the simplest way of getting this is to use one of several RH maps for a given pressure altitude, and a good one to pick in the absence of altitude information is the 250mb/34,000 feet map. If that's not available, then 300mb/30,000 feet is good.
The following is basically several different ways of getting the same GFS data
Instantweathermaps is good, and has a clear color scheme where green is generally good contrail conditions. But limited to 300mb.
http://www.instantweathermaps.com/GFS-php/conusupper.php?var=RH&lev=300mb&hour=000
Europe version: https://www.instantweathermaps.com/GFS-php/euroupper.php?var=RH&lev=300mb
Twisterdata.com is imited to CONUS (Conterminous United States - i.e. the lower 48 states) but gives a slightly higher resolution image, overlaid with wind arrows. They also have better time resolution than InstantWeatherMaps. You need to
- Go to http://www.twisterdata.com/
- Click on "Moisture", then select the appropriate mb RH
- Adjust the time as needed
Here I picked 300 mb to show it's the same as the IWM forecast, above, even though it's using RAP instead of GFS. Because it's a 0h forecast, there's almost no difference between the models.
Here's the same but at 250mb, 34,000 feet:
And the lowest pressure / highest altitude is 200mb/38,600feet.
Note that while there are certainly large differences between the 300mb and 200mb models, the broad strokes are similar. It's typically somewhat drier higher up, but not always. For example, look at the thin brown (dry) area over Northern California, it's green (humid) in the 200mb model
A bigger (but less detailed) picture can be had at https://earth.nullschool.net/, which displays the entire planet in 3D, and allows you to select RH at 250mb. You can also turn off the wind display by pressing the "play" (▷)button.
I've outlined the CONUS region so you can compare it to the previous charts. Here we've basically got blue meaning good contrail humidity conditions. While it's roughly similar, its not as high resolution as the other sites, and a little harder to read. It's a great visualization of the globe conditions though.
All this talk of "models" might make people suspicious. So a good things to check agains is the actual weather, as seen in satellite image. In particular the images taken at wavelengths that emphasize water vapor:
http://www.weather.gov/satellite#wv
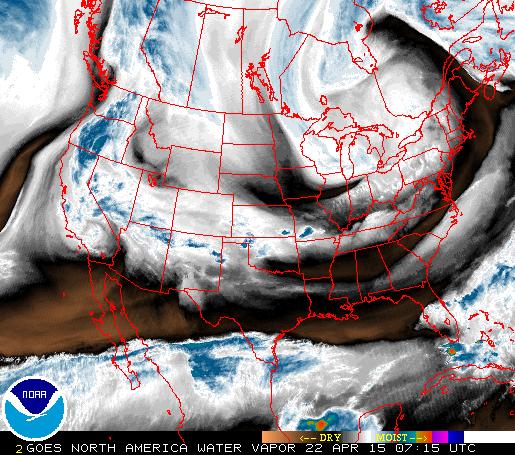
This just shows what the atmosphere looks like from above, so does not tell us much about particular altitudes. But it's a good general approximation a combination of all the levels.
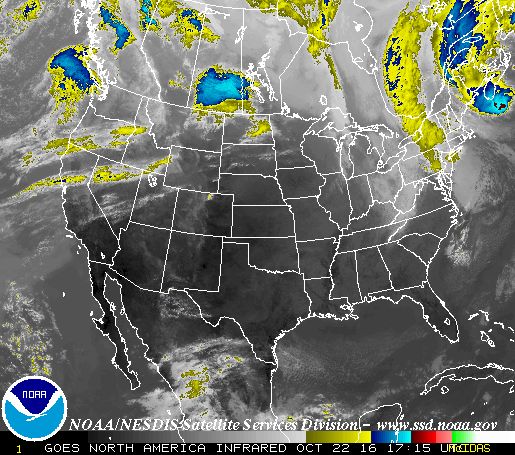
The infrared satellite images are useful as they show areas were cloud is thick enough to obscure the sky, the grey streaky haze areas are more likely good contrail areas.
http://www.weather.gov/satellite#ir
Now I've not focussed much on temperature here, largely because it's always cold enough at some flight altitude. However this does become a more important factor in the summer. Unfortunately TwisterData does not show high altitude temperatures. But InstantWeatherMaps does. Here's the 300mb map:
http://www.instantweathermaps.com/GFS-php/showmap-conusupper.php?var=TMP&lev=300mb
Cold enough in California everywhere North of Los Angeles. Now look at 250mb:
http://www.instantweathermaps.com/GFS-php/showmap-conusupper.php?var=TMP&lev=250mb
Cold enough everywhere in CONUS. And that's just 250mb/34,000 feet. Generally it's pretty safe to say it's cold enough at most flight altitudes above 30,000 feet, certainly above 35,000 feet.
The highest you get non-military planes flying is in the 150mb range, 45,000 feet. It's VERY cold there.
http://www.instantweathermaps.com/GFS-php/showmap-conusupper.php?var=TMP&lev=150mb
Because above a certain altitude it becomes very fuel-inefficient to fly, you will typically only get private jets at that altitude (as they are more concerned with getting there fast vs. cost). Sometimes you will see a solitary contrail in an otherwise blue sky, and it's generally a private jet above 40,000 feet.
A new way of looking at upper air humidity is to use the GOES-16 Satellite and select the Band-8 or Band 9 products. THen you can see just how quickly it can change over a few hours, or even minutes.
Last edited: