Do Subpixel Video Measurements Reveal Errors in the NIST account of 9/11?

Hi @qed I'm intrigued that you "disagree" with my post at #31 given that I made 10 assertions advising @Abdullah of some of the history of this topic. All 10 are true with the partial exception of #2.
(1)Yes. Major_Tom's site has been "off-line" for some time.
(2) A comprehensive collection of data no longer available
(3) And I have had no contact with him for at least 2-3 years.
(4) He was an outstanding researcher of the video record who, together with three colleagues, approached WTC Towers collapse research from a "truther side" starting perspective.
(5) Then honestly rebutted a number of truth-movement memes.
(6) The example I recall from Major_Tom - the photo-shopped graphic used by (I think) S Jones showing alleged molten steel in the debris pile. It was a collage of four separate photos and Major_Tom identified where the added bits of imagery were sourced in the debris pile relative to the central feature of heated steel.
(7) He was the first person to put the "ROOSD" explanation into mainstream 9/11 debate
(8) and was met by denials, insults and personal attacks on another forum
(9) which was renowned for hostility to truthers. (It had in fact seen a "split" of members over those issues. )

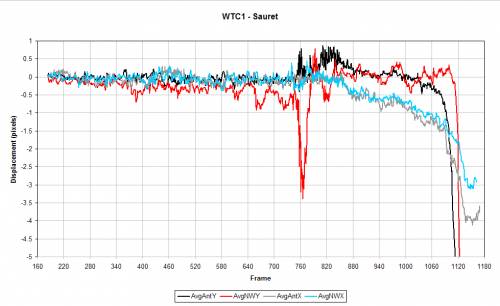
(10) His colleague "femr2" was the person who specialised in accurate interpretation of video measurements including the related issues of "sub-pixel" accuracy.
As for #2 Major_Tom's own website is still offline and that status appears to be permanent. @Abdullah has located the data on the "Wayback Machine". BUT which of the other 9 do you disagree with?

I was very careful in #7 to refer to 'put the "ROOSD" explanation into mainstream 9/11 debate' which Major Tom did early in 2009. Yes I put the explanation without the acronym on-line in 2007 but that was on the R Dawkins Forum which was not a mainstream 9/11 debate.

So why "Disagree" with the other nine? When seven of them are assertions of fact and only two of them include value judgments which I considered appropriate in a post written as advice for member @Abdullah.
 
As one who has been through what remains on the internet, this "work" was a bunch of amateurs playing with very noisy data. No one on this forum who participated in those experiments can repeat them. They do not have the required skills.
I do, and I'll probably get around to it eventually. I'm going to write a motion tracking tool for Sitrec.
 
Wait ..it should be possible to get a 3D model of building deformations using sychronized and located videos from different angles. Does anyone know of a software that does this?
It seems you are asking for accurate data from low-res, noisy, analog footage. Where is the accuracy supposed to come from?

Computer software operates by the GIGO principle: garbage in, garbage out.
 
Wait ..it should be possible to get a 3D model of building deformations using sychronized and located videos from different sngles. Does anyone know of a software that does this?
Step #1 - What are you trying to prove?? The proposal goes well beyond the single issue question of the OP.
 
Last edited:
I do, and I'll probably get around to it eventually. I'm going to write a motion tracking tool for Sitrec.
Why not use the subpixel tracker that comes with MatLab?

Once you have a de-jittered subpixel tracking of the the penthouse corner, what would you consider a sound method for analyzing that dataset with respect to the question of the acceleration of that point? Further, how would you analyze error bounds or noise in the data set?
This is all stuff that has been done before. I've done sub-pixel motion tracking with After Effects, years ago. You could measure noise in the normal way (amplitude about the mean, std dev, sigma).

The biggest issue is really the lack of data points, combined with the lack of resolution.

I don't really think there's going to be much new coming from rehashing this. But saying nobody has the skills to do it is a bit odd. There's a wide variety of people here. There are also new technologies, like OpenCV that might be newly applicable (region tracking vs. point tracking), and people who've done stuff with that in the UFO forums, like @logicbear
 
Step #1 - What are you trying to prove?? The proposal goes well beyond the single issue question of the OP.
Correct. We may need a new thread.

This 3D reconstruction is needed to reconstruct the strains on all visible components. We can then trace the load redistribution and find what broke when. For example

1. The south wall has already buckled before collapse initiation

2. The core thermally expanded, suggesting relatively low temperatures

3. Etc

Basically, investigate the collapse.
 
Hi @qed I'm intrigued that you "disagree" with my post at #31 given that I made 10 assertions advising @Abdullah of some of the history of this topic. All 10 are true with the partial exception of #2.

As for #2 Major_Tom's own website is still offline and that status appears to be permanent. @Abdullah has located the data on the "Wayback Machine". BUT which of the other 9 do you disagree with?

I was very careful in #7 to refer to 'put the "ROOSD" explanation into mainstream 9/11 debate' which Major Tom did early in 2009. Yes I put the explanation without the acronym on-line in 2007 but that was on the R Dawkins Forum which was not a mainstream 9/11 debate.

So why "Disagree" with the other nine? When seven of them are assertions of fact and only two of them include value judgments which I considered appropriate in a post written as advice for member @Abdullah.
I disagree with: (4) He was an outstanding researcher of the video record who, together with three colleagues, approached WTC Towers collapse research from a "truther side" starting perspective.

You are confusing "researcher" with "social media user".
 
I disagree with: (4) He was an outstanding researcher of the video record who, together with three colleagues, approached WTC Towers collapse research from a "truther side" starting perspective.

You are confusing "researcher" with "social media user".
Thank you for your explicit and focused response.

I would normally back off the hyperbole of "outstanding" but the post was intended to advise @Abdullah. And he appears to be unaware of some of the history of on-line discussion and analysis of WTC Twin Towers collapses.

We should probably agree to differ over your denigration of research communicated via social media. Most of my own learning about 9/11 events came from discussions such as these.
 
this "work" was a bunch of amateurs playing with very noisy data.
It doesn't look that noisy to me. If you look at this graphic presented by MT, you can see that for the first 200 frames, nothing deviates by more than a quarter pixel. Then there appears a trough in the NW vertical data of at least another quarter pixel, and with period much longer th around 50 frames - much longer fran the high frequency "noise". Then, about 100 framed later, another 4 troughs of period 50 frames and magnitude ≥¼px. At the time of the largest trough, the high frequency noise of the antenna vertical data increases to about ½px. But there then appears a crest of period 100p, magnitude ≥½px. And at the downward side of the crest, the noise again decreases to the previous magnitude. At this time, antenna and NW peak horizontal displacements exceed ½px, and continues increasing until the collapse about 500 frames later. Something similar is true of the antenna vertical displacements
The following graph gives a nice concept of what can be measured from the Sauret viewpoint from about 9.5 seconds before the visible collapse begins:


I also would like @econ41 to see how gross these deformations are.

"File specs:
97.730.578 bytes
Audio: Dolby AC3 48000Hz 6ch 224Kbps [AC-3]
Video: MPEG2 Video 720x480 (16:9) 29.97fps 9608Kbps [Video]
duration: 02:04,124"¹

The tower was 160px wide in the Sauret video.
The processing doubled the horizontal resolution and quadrupled the vertical resolution. This means each pixel in the graph Major presented is 3.6 inches vertical or 7.2 inches horizontal.

"Processing...

1) Deinterlace - unfold.
2) VideoEnhancer Resolution Upscale (*2x, *4y)
3) Deinterlace - fold.
4) Bob Doubler (Alternate Fields, No resize)"²

To get an idea of how big that is, a displacement of 3.6 inches would cause a 300ft length of steel to reach 30ksi stress.

13 seconds before collapse, the NW corner begins to shudder up and down with a magnitude of 1-2inches. Then, it jerks downward 10 inches before bouncing back up. Shortly afterwards, the antenna lifts about 2 inches. Then, as it drops back, both it and the corner are yanked east 3.6 inches. Over the next 8 seconds, the eastward displacements reach 7.2 inches, and the antenna sinks 3.6 inches below original position. Then in the 1 second between antenna giving and northwest corner giving, the antenna drops 1 foot, and the eastward displacements reach 2 feet.


References
1.
https://web.archive.org/web/2020062...op=view_page&PAGE_id=216&MMN_position=462:462

2.
https://web.archive.org/web/2020070...op=view_page&PAGE_id=280&MMN_position=620:620
 
It seems you are asking for accurate data from low-res, noisy, analog footage.
We do not need to know where every square inch of the façade was at every given millisecond.

The videos have frame rates of 30-60fps. Way more than is needed to detect the slow motions we are looking for. We can average 30 frames to filter out vibration and smoke.

The videos are quite colorful, whereas the tower wasn't. To increase the resolution, all we need to do is blow up the footage, blur out any pixelation, then sharpen it. Both the Sauret and NBC NW videos have resolution of 40cm or better. We need 1cm. We know that pixel colours are given in 256 shades. We can sacrifice nearly all of them in pursuit of that 1cm precision. Like this video, whose resolution I have doubled.

ezgif.com-gif-maker (33).gif

The exterior columns provide an excellent way of mapping lateral deformations that can be used to prove that the building is caving in, not tilting.

We also do not need to know the position of every individual column. We can average data from, say, 6 columns to get the lateral displacement for that part of the wall.

We also do not need to know the lateral displacement of every foot of exterior column. We can average the data across, say, 1 storey. This s, too, will help filter out smoke plumes. Like this
Mezgif.com-gif-maker (42).gif
 
Last edited:
@Abdullah

"Over g" is a pet peeve of mine and I have repeated a number of these experiments from the little information traces that can still be found. I published these here with code, but they seem to have been deleted.

I would not mind putting in the work with you (and others) to repeat them from first principles.

My first question would be the following.
  • The camera is shaking as the building collapses: how should we handle this?
 
Last edited:
Which static points would you suggest, and why are we sure they are static?
In all the videos, we can see a substantial portion of the tower below impact. Before collapse began in earnest, the main reason this portion would move at all is wind. We would prefer to filter out wind.
 
@Abdullah

Your answer gives me too little information to repeat the experiment.

We need two points, ideally three or more, that remain static during the collapse. With more than one static point, we can get some error bounds on de-jittering before we begin attempting to track moving points.

[1] Which video should we analyze? Please post a link.
[2] Which points should we use as our static points? Please post a screen shot of one frame that shows these points.
 
I don't think we can use points on the building as static points? In the first part of the first video I see points on a separate non-collapsing building. Perhaps we can us those?

BTW: What would be the hypothesis of this experiment?
 
In the first part of the first video I see points on a separate non-collapsing building. Perhaps we can us those?
I had wanted to correct for wind.


BTW: What would be the hypothesis of this experiment?
What I am trying to show is that the core fell before the south wall. To this end, I would like to measure the tilt and drop of the sntenna over the final 5-10 seconds before collapse, and show that the fulcrum was outside the building - or at least way too close to it.
 
BTW: What would be the hypothesis of this experiment?
Yes. And even more important what are you both trying to prove?
What I am trying to show is that the core fell before the south wall.
Why? That aspect is only a detail. Part of the total mechanism. So, one again, why dont you get to understand the mechanism. The proven or undeniable main features. THEN test where core motion fits in the known scenario.
To this end, I would like to measure the tilt and drop of the sntenna over the final 5-10 seconds before collapse,
So how are you defining collapse? Because if the antenna actually was tilting and dropping you are already in the collapse. Tilting and dropping are NOT "before the collapse" - they are early stages part of it.
and show that the fulcrum was outside the building - or at least way too close to it.
THEN why not understand the mechanism and how the virtual fulcrum was created AND how it moved. And why for both those aspects.
What sort of a fulcrum do you mean that can be "outside of the building"?
 
Yes. And even more important what are you both trying to prove?
I am trying to prove whatever @Abdullah wants to prove.

I am attempting to make that precise, by request a hypothesis from @Abdullah.

Of course, such a hypothesis should not include the term NIST, rather it should be phrased in terms of measurements we can perform and outcomes we can verify!

(I already concerned that there appear to be no useful static points.)
 
Last edited:
Thanks @qed
I am trying to prove whatever @Abdullah wants to prove.
That is my purpose also. i.e. knowing what @Abdullah "wants to prove" and why.
I am attempting to make that precise, by request a hypothesis from @Abdullah.
Understood and agreed
Of course, such a hypothesis should not include the term NIST,
It is off topic - the topic is about NIST and "sub-pixel" and I see no reference or relevance of "sub-pixel" in an argument which is about the collapse mechanism. Especially since the points being made do not appear to be linked to any agreed outline model of the collapse mechanism
rather it should be phrased in terms of measurements we can perform and outcomes we can verify!

(I already concerned that there appear to be no useful static points.)
I understand both those points EXCEPT I would also want the points placed in reference to the relevant parts of an agreed overall mechanism. The discussion seems to have lost relevance to both key issues of the topic.
 
Why? That aspect is only a detail. Part of the total mechanism. So, one again, why dont you get to understand the mechanism. The proven or undeniable main features. THEN test where core motion fits in the known scenario.
I suppose you are referring to thu?s
Significant facts of explanation working down the hierarchy of taxonomic significance could be:
A) The "initiation" stage was a "cascade failure" of columns;
B) There is evidence for both "core led" and "perimeter led";
C) Whichever it was doesn't change the next stage;
D) All columns failed in two sub-stages (at least)
D1) Columns failed in cascading axial overload mode until there was not sufficient remaining strength to support the "Top Block"; THEN
D2) Top Block [released|descended|fell (choose your preferred word)] and failed all the columns which had survived to that point.
That cascade of failures needs a large local failure to trigger it. There was a large local failure when the plane hit - didn't trigger the death cascade. Inward bowing across almost the entire south face at 10:23 didn't trigger it.

Presumably both of these contributed to the cascade. But what triggered it? Could this thing have triggered sn unstoppable cascade without the two aforementioned things?

To put it another way, let's say that the tower has a safety factor 3.

Impact and bending moments reduce it by 30%. So now we have 2.1×.

Inward bowing and bending moment reduces it by 40%. So now we have 1.26×.

Then mechanism X reduces it by T%, until we have <1×.

That Y could be 25%, un which case the other two mechanisms are needed to explain collapse.
Or it could be 70%, in which case X alone could have destroyed the building as designed, but it could be practical to design a building in the future to survive X. Or it could be 95%, in which case there is no choice but to totally avoid X.

A South wall failure may fit the first scenario. A collective core failure may fit the other two, as demonstrated by WTC7.
 
So how are you defining collapse? Because if the antenna actually was tilting and dropping you are already in the collapse. Tilting and dropping are NOT "before the collapse" - they are early stages part of it.
I understand that I didn't precisely define it. Loosely speaking, I am referring to what onlookers immediately perceive as collapse - the wholesale, high speed drop of the roof. This is an event which can be timed to 1 second precision.

If greater precision is needed, then zi suggest that the moment of collapse should be defined as the moment the crack appears in the NW corner.
 
Back
Top