Debunked: Significant Increase in Volcano Eruptions

Mick West

Administrator
Staff member


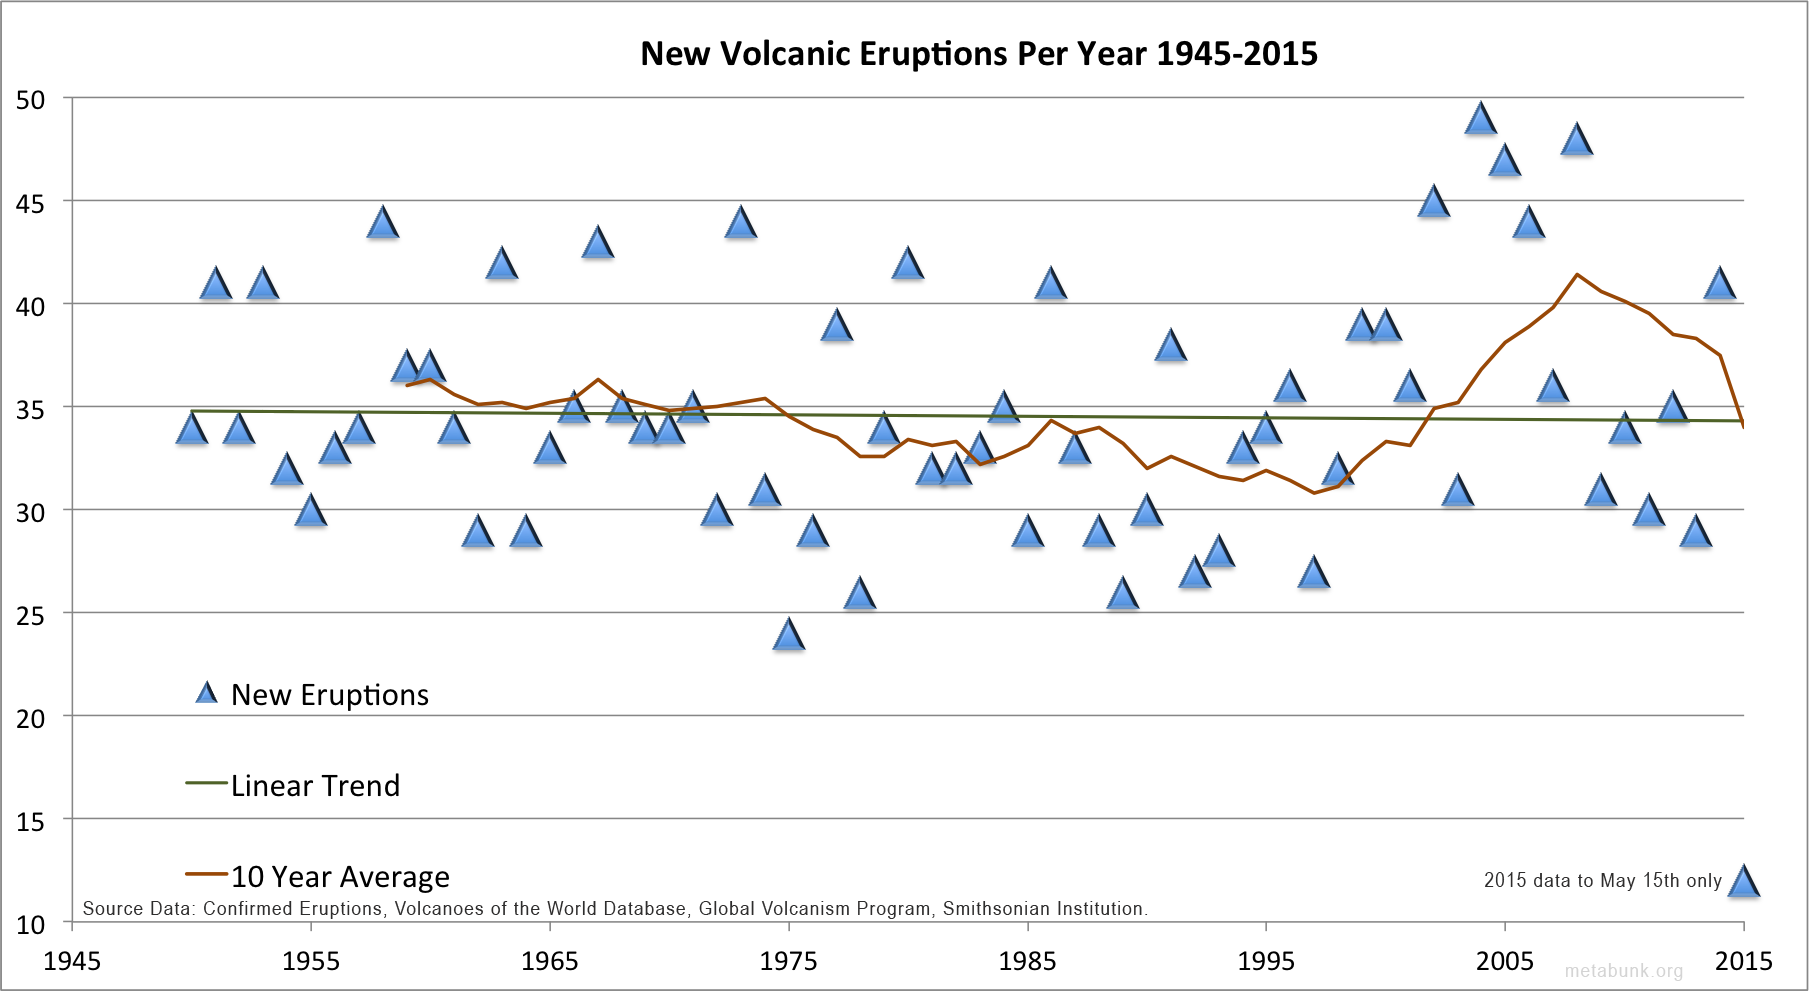
The above chart is based on data from the Smithsonian Institution's Global Volcanism Program (GVP_ database of eruptions, it's a count of all the eruptions that started in each year, from 1945 to 2015. It shows about 35 new eruptions per year, but with a lot of variation from about 25 to 50 per year. The trend over the full period is basically flat, and while there was a slight increase on average from about 1997 to 2008, this is balanced by a decline in recent years.

This year, 2015, shows only 12 eruptions so far, if it continues at that rate we will have about 33 this year, a bit below average. The 12 confirmed eruptions are:
  • Tara, Batu
  • Tungurahua
  • Ubinas
  • Turrialba
  • Turrialba
  • Chikurachki
  • Fournaise, Piton de la
  • San Miguel
  • Karymsky
  • Pacaya
  • Soputan
  • Klyuchevskoy
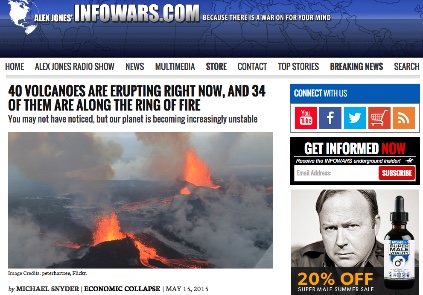
So why then do we have stories like this:
http://www.infowars.com/40-volcanoe...ow-and-34-of-them-are-along-the-ring-of-fire/
20150516-073542-wd2bz.jpg

External Quote:

40 VOLCANOES ARE ERUPTING RIGHT NOW, AND 34 OF THEM ARE ALONG THE RING OF FIRE
You may not have noticed, but our planet is becoming increasingly unstable
by MICHAEL SNYDER | ECONOMIC COLLAPSE | MAY 15, 2015

You may not have noticed, but our planet is becoming increasingly unstable. According to Volcano Discovery, 40 volcanoes around the globe are erupting right now, and only 6 of them are not along the Ring of Fire. If that sounds like a very high number to you, that is because it is a very high number. As I have written about previously, there were a total of 3,542 volcanic eruptions during the entire 20th century. When you divide that number by 100, that gives you an average of about 35 volcanic eruptions per year. So the number of volcanoes that are erupting right now is well above the 20th century's average for an entire calendar year.
Why is he saying there are 40 Volcanoes erupting right now, when the Smithsonian only lists 12 confirmed new eruptions so far?

The problem is that Snyder is comparing two very different things. "Eruptions per year, as counted by the Smithsonian's GVP" is not the same thing as "erupting right now, according to Volcano Discovery". He's comparing one measurement against a different measurement. His historical figures are actually accurate, as they use the same Smithsonian data. There were actually 35 per year, on average, from 1900 to 1999. But if you actually look at the most recent data from the same source then the average has actually dropped a bit, to 33 (from 1945 to 2015), and has been declining in recent years.

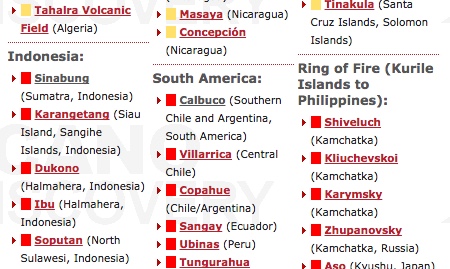
So what is this "40 volcanoes around the globe are erupting right now"? The figure comes from Volcano Discovery, a volcano tourism site that maintains a list of where there is volcanic activity, so people interested in visiting volcanos can find active volcanos. Volcano Discovery lists volcanoes that are either "erupting" (marked in red), or in a state of "unrest" (yellow), like this:
20150515-114014-d6un7.jpg


The difference here seems to be that the two sources have a different cut-off criteria for what constitutes an "eruption". The Smithsonian GVP notes:

External Quote:

The Weekly Volcanic Activity Report does not necessarily include all volcanic activity that occurred on Earth during the week. More than a dozen volcanoes globally have displayed more-or-less continuous eruptive activity for decades or longer, and such routine activity is typically not reported here. Moreover, Earth's sea-floor volcanism is seldom reported even though in theory it represents the single most prolific source of erupted material. The Weekly Volcanic Activity Report summarizes volcanic activity that meets one or more of the following criteria:

- A volcano observatory raises or lowers the alert level at the volcano.
- A volcanic ash advisory has been released by a volcanic ash advisory center (VAAC) stating that an ash cloud has been produced from the volcano.
- A verifiable news report of new activity or a change in activity at the volcano has been issued.
- Observers have reported a significant change in volcanic activity. Such activity can include, but is not restricted to, pyroclastic flows, lahars, lava flows, dome collapse, or increased unrest.
Whereas Volcano Discovery seems to just include any report of activity that might be of interest to a Volcano tourist, and also includes the "more than a dozen" volcanos that have continuous activity.

When trying to determine if there has been a change, you have to compare like with like. If we look at the GVP data, we see no change. We can see that the GVP data is different to the VD data, but can we see if the VD data itself indicates any change? The VD data is from there page "What's Erupting", which has been operating in this form since January 2012, as can be seen on the Internet Archive:
https://web.archive.org/web/20120118231502/http://www.volcanodiscovery.com/erupting_volcanoes.html
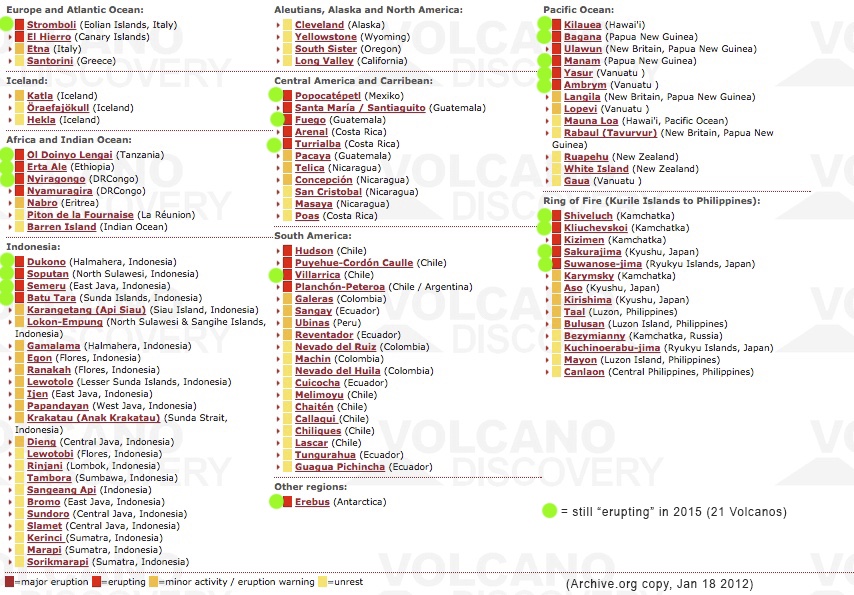
20150515-125232-lnk0m.jpg

Which shows 31 erupting volcanoes, however 21 of them are volcanos that are still listed as "erupting" in May 2015 (I've marked them with green in the image above). If we then go forward to Jun 22 2014, we again have 31, but now 19 of them were listed in both 2012 and 2015.

There's not enough data to determine any trend from VD, but what we can say is that the majority of volcanoes that they list are not new activity at all, and are simply volcanoes that show some activity pretty much every year.

The bottom line - looking at the actual Smithsonian data shows no increase. The Volcano Discovery is a different data set aimed at tourists, which you can't directly compare with the Smithsonian. Even then, the VD data does not show an increase that not within normal variations.

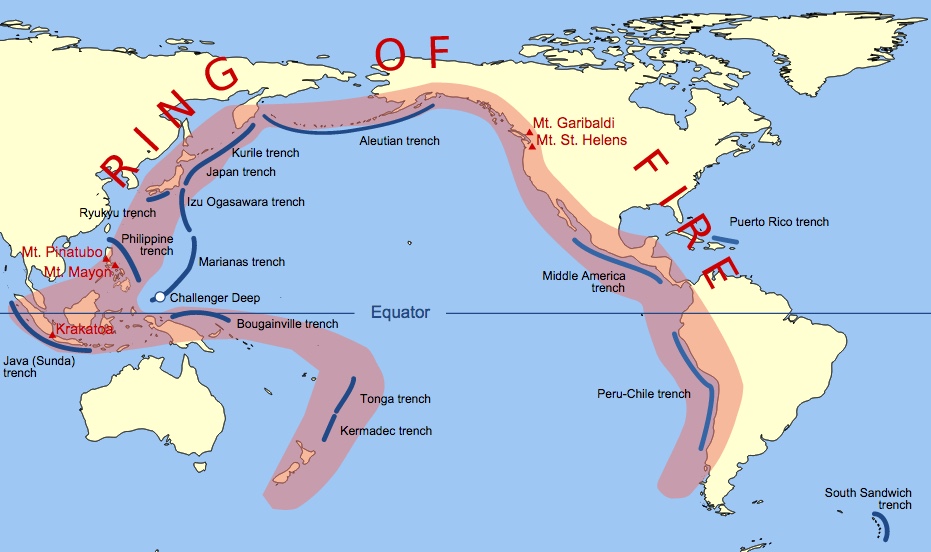
One final thing, Snyder says "34 of them are on the Ring of Fire". Well that's hardly surprising, seeing as the Ring of Fire spans the entire world, and contains 75% of the worlds active and dormant volcanoes.
20150515-132114-32j3u.jpg


Link to raw Smithsonian data: https://www.metabunk.org/sk/GVP_Eruption_Results.xls (38MB file)
 
Last edited:
Thanks. I often encounter claims like these. This is very helpful in rebutting them. Likewise the increase in the number of earthquakes, sinkholes, etc., supposedly indicating the imminent arrival of Nibiru, the end of the world, the return of Jesus, or whatever.
I tried to figure out what was true about the earthquakes claim a few years ago:
upload_2015-5-16_6-47-40.png

source: http://earthquake.usgs.gov/earthquakes/
 
Similar claims have popped up over the last year in geologic discussion groups on LinkedIn (and other places); the primary one being that a cataclysmic eruption of the Yellowstone Caldera was imminent. It got so annoying that the scientists at the Yellowstone Volcanic Observatory (YVO) responded:

External Quote:
A Short Statement Regarding Recent Rumors
August 08, 2014
Though we love doing research at YVO, we prefer it when the research is on topics geological rather than the origin of false rumors. Nevertheless, we have received enough concerned emails and phone calls that we've spent some time tracking down a few of the statements made on various "alternative Internet news sources."

* First, everyone should know that geological activity, including earthquakes and ground uplift/subsidence is well within historical norms and seismicity is actually a bit low at present.

* Concern over road closures is much overblown. There's been one road closure of a small side road – just over three miles long – that was closed for two days. As one can imagine, it is not easy to maintain roads that pass over thermal areas where ground temperatures can approach those of boiling water. Roads at Yellowstone often need repair because of damage by thermal features as well as extreme cold winter conditions.

* The park has not been evacuated. This one is pretty easy to verify by everyone. If the Old Faithful webcam shows people, or if news articles are coming out about a hobbyist's remote control helicopter crashing into a hot spring, Yellowstone is certainly open for business.

* No volcanologists have stated that Yellowstone is likely to erupt this week, this month or this year. In one recent article, a name was attributed to a "senior volcanologist", but that person does not appear to exist, and a geologist with that name assures us that he did not supply any quotes regarding Yellowstone.

* Finally, we note that those who've kept track of Yellowstone over the past decade or so, have seen a constant stream of "predictions" regarding imminent eruptions at Yellowstone. Many have had specific dates in mind, none had a scientific basis, and none have come true.

We will continue to provide updates on geological activity at Yellowstone, and educational materials to help understand the science around Yellowstone monitoring.

Virtually everything known about Yellowstone's spectacular volcanic past comes from the scientists who work at this observatory, at all our eight member agencies. We're the ones who mapped the deposits, figured out the ages of the eruptions, measured the gases, located the earthquakes, and tracked the ground movement. A few of us have been doing it for over forty years. We will continue to help you understand what's happening at Yellowstone now, and what's likely to happen in the future.
 
There's an old GVP FAQ on the topic:
https://web.archive.org/web/20090730080558/http://www.volcano.si.edu/faq/index.cfm?faq=06
External Quote:

Has volcanic activity been increasing?
We don't think so.

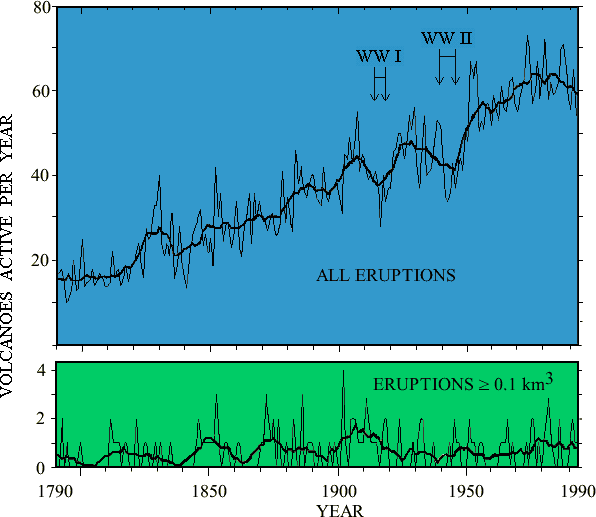
A look at the number of volcanoes active per year, over the last few centuries, shows a dramatic increase, but one that is closely related to increases in the world's human population and communication. We believe that this represents an increased reporting of eruptions, rather than increased frequency of global volcanism: more observers, in wider geographic distribution, with better communication, and broader publication. The past 200 years (see plot below) show this generally increasing trend along with some major "peaks and valleys" which suggest global pulsations. A closer look at the two largest valleys, however, shows that they coincide with the two World Wars, when people (including editors) were preoccupied with other things. Many more eruptions were probably witnessed during those times, but reports do not survive in the scientific literature.

If these apparent drops in global volcanism are caused by decreased human attention to volcanoes, then it is reasonable to expect that increased attention after major, newsworthy eruptions should result in higher-than-average numbers of volcanoes being reported in the historical literature. The 1902 disasters at Mont Pelee, St. Vincent, and Santa Maria (see 1902 arrow) were highly newsworthy events. They represent a genuine pulse in Caribbean volcanism, but we believe that the higher numbers in following years (and following Krakatau in 1883) result from increased human interest in volcanism. People reported events that they might not otherwise have reported and editors were more likely to print those reports.

Additional strong evidence that the historical increase in global volcanism is more apparent than real comes from the lower plot below. Here only the larger eruptions (generating at least 0.1 km3 of tephra, the fragmental products of explosive eruptions) are plotted. The effects of these larger events are often regional, and therefore less likely to escape documentation even in remote areas. The frequency of these events has remained impressively constant for more than a century, and contrasts strongly with the apparent increase of smaller eruptions with time.
60c2f21ee0b86ed3b80b6bacac64a92f.png

External Quote:


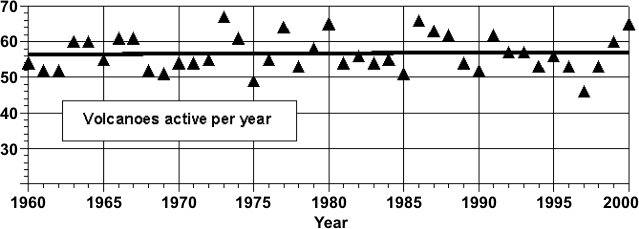
Finally, we plot below the record since reasonably comprehensive reporting of global volcanism began in the 1960s. Note that the number of confirmed erupting volcanoes has leveled off between 50 and 70 per year through the past four decades, and a linear regression line through the data indicates that volcanism has been virtually constant.
25bcbef75a67df8003b445883a877dbf.jpg


Note their chart shows active volcanoes, not new eruptions, which is what the top chart measures.
 
Likewise the increase in the number of earthquakes, sinkholes, etc., supposedly indicating the imminent arrival of ...

And meteors. Don't forget meteors. :D

During the height of the Nibiru hysteria there were numerous fearmongers claiming an increase in meteor activity. I graphed the number of meteors detected per day by NASA's Fireballs Network all-sky cameras to show there hadn't been any increase. It is only for cameras 1 through 4; they add more cameras from time to time so I just used those cameras. Here is an updated graph. The red line is the linear trend.

fireballs as of 2015-05-14.png
 
And meteors. Don't forget meteors. :D

During the height of the Nibiru hysteria there were numerous fearmongers claiming an increase in meteor activity. I graphed the number of meteors detected per day by NASA's Fireballs Network all-sky cameras to show there hadn't been any increase. It is only for cameras 1 through 4; they add more cameras from time to time so I just used those cameras. Here is an updated graph. The red line is the linear trend.
Thanks again. Useful as well. Nice to see the Perseids and Geminids peak every year. I still have a question. The vertical axis says "meteors per day". But when I spend a night watching Perseids I see a few dozen per hour. So I wonder if this is about all meteors or just fireballs?
 
Quakesstacked2.png
Thanks. I often encounter claims like these. This is very helpful in rebutting them. Likewise the increase in the number of earthquakes, sinkholes, etc., supposedly indicating the imminent arrival of Nibiru, the end of the world, the return of Jesus, or whatever.
I tried to figure out what was true about the earthquakes claim a few years ago:
View attachment 12881
source: http://earthquake.usgs.gov/earthquakes/
Hey,
I noticed what you did until I added all other magnitudes from 4.0 and up. Sorry the chart is a little busy. What do You think?
 
View attachment 12934
Hey,
I noticed what you did until I added all other magnitudes from 4.0 and up. Sorry the chart is a little busy. What do You think?
I think Hama Neggs is right. From the USGS:
External Quote:

The USGS estimates that several million earthquakes occur in the world each year. Many go undetected because they hit remote areas or have very small magnitudes. The NEIC now locates about 50 earthquakes each day, or about 20,000 a year.

As more and more seismographs are installed in the world, more earthquakes can be and have been located. However, the number of large earthquakes (magnitude 6.0 and greater) has stayed relatively constant.


A bit more info from http://alabamaquake.com/education.html
External Quote:
There are several reasons for the perception that the number of earthquakes, in general,and particularly destructive earthquakes is increasing.

1) A partial explanation may lie in the fact that in the last twenty years, we have definitely had an increase in the number of earthquakes we have been able to locate each year. This is because of the tremendous increase in the number of seismograph stations in the world and the many improvements in global communications.

In 1931, there were about 350 stations operating in the world; today, there are more that 4,000 stations and the data now comes in rapidly from these stations by telex, computer and satellite.This increase in the number of stations and the more timely receipt of data has allowed us and other seismological centers to locate many small earthquakes which were undetected in earlier years, and we are able to locate earthquakes more rapidly.

The NEIC now locates about 12,000 to 14,000 earthquakes each year or approximately 50 per day. Also, because of the improvements in communications and the increased interest in natural disasters,the public now learns about more earthquakes. According to long-term records (since about 1900),we expect about 18 major earthquakes (7.0 - 7.9) and one great earthquake (8.0 or above) in any given year.However, let's take a look at what has happened in the past 32 years, from 1969 through 2001, so far.
Our records show that 1992, and 1995-1997 were the only years that we have reached or exceeded the long-term average number of major earthquakes since 1971. In 1970 and in 1971 we had 20 and 19 major earthquakes, respectively, but in other years the total was in many cases well below the 18 per year which we may expect based on the long-term average.

2) The population at risk is increasing. While the number of large earthquakes is fairly constant, population density in earthquake-prone areas is constantly increasing. In some countries, the new construction that comes with population growth has better earthquake resistance; but in many it does not. So we are now seeing increasing casualties from the same sized earthquakes.

3) Better global communication. Just a few decades ago, if several hundred people were killed by an earthquake in Indonesia or eastern China, for example, the media in the rest of the world would not know about it until several days, to weeks, later, long after such an event would be deemed newsworthy. So by the time this information was available, it would probably be relegated to the back pages of the newspaper, if at all. And the public Internet didn't even exist. We are now getting this information almost immediately.

4) Earthquake clustering and human psychology. While the average number of large earthquakes per year is fairly constant, earthquakes occur in clusters. This is predicted by various statistical models, and does not imply that earthquakes that are distant in location, but close in time, are causally related. But when such clusters occur, especially when they are widely reported in the media, they are noticed. However, during the equally anomalous periods during which no destructive earthquakes occur, no one deems this as remarkable.
 
Last edited:
I think Hama Neggs is right. From the USGS:
External Quote:

The USGS estimates that several million earthquakes occur in the world each year. Many go undetected because they hit remote areas or have very small magnitudes. The NEIC now locates about 50 earthquakes each day, or about 20,000 a year.

As more and more seismographs are installed in the world, more earthquakes can be and have been located. However, the number of large earthquakes (magnitude 6.0 and greater) has stayed relatively constant.


A bit more info from http://alabamaquake.com/education.html
External Quote:
There are several reasons for the perception that the number of earthquakes, in general,and particularly destructive earthquakes is increasing.

1) A partial explanation may lie in the fact that in the last twenty years, we have definitely had an increase in the number of earthquakes we have been able to locate each year. This is because of the tremendous increase in the number of seismograph stations in the world and the many improvements in global communications.

In 1931, there were about 350 stations operating in the world; today, there are more that 4,000 stations and the data now comes in rapidly from these stations by telex, computer and satellite.This increase in the number of stations and the more timely receipt of data has allowed us and other seismological centers to locate many small earthquakes which were undetected in earlier years, and we are able to locate earthquakes more rapidly.

The NEIC now locates about 12,000 to 14,000 earthquakes each year or approximately 50 per day. Also, because of the improvements in communications and the increased interest in natural disasters,the public now learns about more earthquakes. According to long-term records (since about 1900),we expect about 18 major earthquakes (7.0 - 7.9) and one great earthquake (8.0 or above) in any given year.However, let's take a look at what has happened in the past 32 years, from 1969 through 2001, so far.
Our records show that 1992, and 1995-1997 were the only years that we have reached or exceeded the long-term average number of major earthquakes since 1971. In 1970 and in 1971 we had 20 and 19 major earthquakes, respectively, but in other years the total was in many cases well below the 18 per year which we may expect based on the long-term average.

2) The population at risk is increasing. While the number of large earthquakes is fairly constant, population density in earthquake-prone areas is constantly increasing. In some countries, the new construction that comes with population growth has better earthquake resistance; but in many it does not. So we are now seeing increasing casualties from the same sized earthquakes.

3) Better global communication. Just a few decades ago, if several hundred people were killed by an earthquake in Indonesia or eastern China, for example, the media in the rest of the world would not know about it until several days, to weeks, later, long after such an event would be deemed newsworthy. So by the time this information was available, it would probably be relegated to the back pages of the newspaper, if at all. And the public Internet didn't even exist. We are now getting this information almost immediately.

4) Earthquake clustering and human psychology. While the average number of large earthquakes per year is fairly constant, earthquakes occur in clusters. This is predicted by various statistical models, and does not imply that earthquakes that are distant in location, but close in time, are causally related. But when such clusters occur, especially when they are widely reported in the media, they are noticed. However, during the equally anomalous periods during which no destructive earthquakes occur, no one deems this as remarkable.


Thanks for this detailed response. The information is really helpful in regards understanding what's really happening and how to interrupt the data.
 
There has been more 4.0 and above lately than ever before recoded. This is just sleep fuel. Never mind the active volcanoes and Mt. St. Hellen getting ready to pop again.
 
Last edited by a moderator:
There has been more 4.0 and above lately than ever before recoded.
Source?
Never mind the active volcanoes
Which ones? What about them?

...and Mt. St. Hellen getting ready to pop again.

Source?

External Quote:
CASCADES VOLCANO OBSERVATORY WEEKLY UPDATEMonday, April 4, 2016 9:45 AM PDT (Monday, April 4, 2016 16:45 UTC)

CASCADE RANGE VOLCANOES

Current Volcano Alert Level: NORMAL
Current Aviation Color Code: GREEN

Activity Update: All volcanoes in the Cascade Range of Oregon and Washington are at normal background levels of seismicity. These include Mount Baker, Glacier Peak, Mount Rainier, Mount St. Helens, and Mount Adams in Washington State; and Mount Hood, Mount Jefferson, Three Sisters, Newberry, and Crater Lake in Oregon.


Recent observations: Over the past week, there have been located earthquakes at Newberry, Mount Hood, Mount Rainier. At Mount St. Helens, a few tens of very small earthquakes were detected at depths <5 km, which is consistent with background levels of seismicity at the volcano. Field crews performed maintenance on monitoring stations at Mount St. Helens.


The above chart is based on data from the Smithsonian Institution's Global Volcanism Program (GVP_ database of eruptions, it's a count of all the eruptions that started in each year, from 1945 to 2015. It shows about 35 new eruptions per year, but with a lot of variation from about 25 to 50 per year. The trend over the full period is basically flat, and while there was a slight increase on average from about 1997 to 2008, this is balanced by a decline in recent years.
Link to raw Smithsonian data: https://www.metabunk.org/sk/GVP_Eruption_Results.xls (38MB file)

Do you happen to have a link to that chart at the top of your post? I'm in a debate with some conspiracy theorists who insist that volcanic activity is through the roof the last several years, and you can't tell them otherwise, because last year there were two volcanoes erupting at the same time on different parts of the globe and that's never happened before in all of history so THERE!!! If I could link that chart, it would be a boon, but I can't find it on the website you linked.

Thanks...
 
Last edited by a moderator:
Ah, OK... thanks. As it is, they seem to have accepted the chart without a link - or at least, didn't challenge it. Kinda scurried away from it, to be honest... I just hate posting data without cites, but in this case it appears to have worked out OK.

Apparently, earthquakes, volcanoes, tsunamis, and storms are at an all time high. For some mysterious reason, nobody can provide any supporting data for that, but it just is. And that's that! :-D
 
It looks like you can download to a spreadsheet format.

Okay I figures it out again, so I'll write it down this time :)

From Smithsonian Institution's Global Volcanism Program (GVP_ database of eruptions), I selected "Confirmed eruptions", then "Check all (countries)". Then on the next page, "Download Results to Excel".

I then made a column of the numbers 1945 to 2018, then an adjacent column with the formula:

=COUNTIF($I$3:$I$100000,Z2)

(Where the I column is the year per eruption, and Z is the new year column)

This gives:


Metabunk 2018-12-30 22-52-19.jpg


and I've added a chart just by selecting the two new columns. Then pretty it up, and add a trend line.

This one is to 2018, and there's really been no change.
Metabunk 2018-12-30 22-54-14.jpg
 
because last year there were two volcanoes erupting at the same time on different parts of the globe and that's never happened before in all of history so THERE!!
Here is a chart, updated every few minutes, of all current volcanic activity around the world
https://www.volcanoesandearthquakes.com/
You will see there are a fair few volcanos whose activity is described as 'eruptive', this not unusual.
 
Back
Top