Claim: Extremely high radiation levels in the US.

Steve Funk

Senior Member.
This claim of extremely high radiation levels is circulating on Facebook:


RADIATION CPM* COMPARISON CITY STATE
f99b92bac2d1902ccec64266d455326a.jpg
Colorado Dust Storm

*Listed in Counts per Minute, a Count is One Radioactive Decay Registered by the Instrument.

All Radiation Counts reported are partial Counts. Uncounted types of radiation include Alpha, Beta, Gamma, Neutron and X-Ray radiation. Uncounted radiation, if added, makes the actual Count higher and more dangerous.

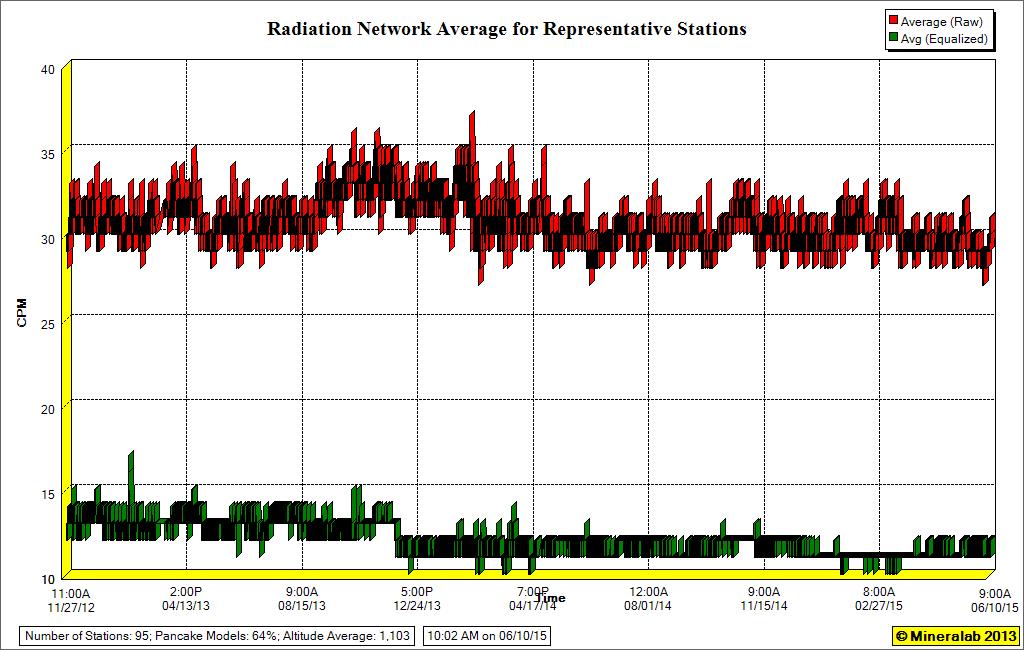
The highest radiation reporting city is listed first, the least radioactive city is listed last. Still, all reporting cities are above normal.

Normal Radiation is 5 to 20 CPM. [6]


1306 CPM, 265.2 Times Normal, Ft Wayne IN Gamma, Beta.
1004 CPM, 201 Times Normal, Concord, NH
Gamma, Beta.
1001 CPM, 200.2 Times Normal, Champaign, IL Gamma Only
944 CPM, 188.8 Times Normal, Albuquerque, NM G&B, Highest Rpt.
893 CPM, 178.6 Times Normal, Billings, MT Gamma Only.
855 CPM, 171 Times Normal, Bakersfield, CA G&B, Last report
854 CPM, 170.8 Times Normal, Pittsburgh, PA, Gamma, Beta.
798 CPM, 159.6 Times Normal, Montgomery, AL. Gamma, Beta.
792 CPM, 158.4 Times Normal, Little Rock, AR Gamma, Beta.
652 CPM, 130.4 Times Normal, Tucson, AZ Gamma, Beta.
641 CPM, 128.2 Times Normal, San Angelo, TX. Gamma, Beta.
634 CPM, 126.8 Times Normal, Lincoln, NE Gamma, Beta.
607 CPM, 121.4 Times Normal, Aberdeen, SD. Gamma Only.
575 CPM, 115 Times Normal, Dallas, TX. Gamma, Beta.
558 CPM, 111.8 Times Normal, San Diego, CA Gamma Only
543 CPM, 108.6 Times Normal, Washington, D.C. Gamma, Beta.
531 CPM, 106.2 Times Normal, Portland, ME Gamma Only.
501 CPM, 100.2 Times Normal, St. Paul, MN. G&B, Last report
499 CPM, 99.8 Times Normal, Miami, FL. Gamma Only.
476 CPM, 95.2 Times Normal, Phoenix, AZ Gamma, Beta.
Content from External Source
http://www.veteranstoday.com/2015/09/05/your-radiation-this-week-no-20/

The above source does not specifically link this to Fukushima, but the data is cited in a Fukushima story here: http://allnewspipeline.com/Fukushima_Death_America_Next.php

In order to verify the historic data, from the Nuclear Emergency Tracking Center http://www.netc.com/ You need a paid account. Is there anyone here who can access this? I really don't have a good grasp on the Relationship between counts per minute and actual REM exposure, or whether this data is a momentary peak, hourly average or daily average.
 
http://radiationnetwork.com/

There is a free network of more or less continuously active geiger counters. Even without equalizing rates ("count" isn't a standardized unit and varies by a factor of 3 depending on the type of counter - sites with darker borders are models that give higher count rates*), no counter in the network has ever significantly exceeded 100 cpm, even the two in Japan (and for some time after the accident there was one very close to Fukushima). The highest on the network right now looks like 45, and is not trending upwards. In fact, there are no upward or downward trends at all, globally (most of the network is in the US, but there are stations in Europe, South America, Japan, and Australia).

http://radiationnetwork.com/Graph.htm

The historial data doesn't go back to 2011, but the highest spike in recent memory is a staggering 17 in early 2013.

*-the fact that the data isn't clustered around two points itself suggests it's bunk, as you can see in the network map there are clusters around the 10's and 40's, with the higher counts being counter models with a pancake-type tube, which have a count rate about three times higher than models with a standard tube.


Another point, geiger counters can't distinguish alpha, beta, gamma, X-ray, or harmless photon radiation. For models that can detect neutron radiation, they also can't distinguish that from the rest. You need different instruments to do this, and "count" is a term unique to geiger counters.
 
Last edited:
RadNet query is what you want. https://cdxnode64.epa.gov/radnet-public/query.do

The guy who makes those bogus weekly reports uses Gamma Energy Range 5 Gross for his gamma CPM.

Tips and tricks to make RadNet query work:
If your browser says it prevented the website from re-directing to another page then hit "allow" or it will sit there forever. It is very slow and only returns 400 data points per query (which is about 16 days worth of data). If you open it in Excel be sure to enable "detect special numbers" so it will recognize dates and times.
 
Last edited:
RadNet query is acting all wonky. It won't return results from before 2011. They changed the input interface since the last time I used it; they might have buggered it.
 
Thanks Hevach. I have seen radiation network before, and I was thinking it was the same site as Nuclear Emergency Tracking Center. It's not, but their graphics are very similar. Here, from radiation network, is a specific response to the link I originally cited:

Update: 10/21/15 - Apples and Oranges - "Veterans Today" article

Have received so many emails with links to a "Veteran's Today" article, that it warrants response. Basically, the author of the article concludes that EPA radiation monitoring stations are recording massively elevated radiation readings compared to the norm, because at least in part, he defines the norm as those background levels detected by a Digilert 100 Geiger counter. Problem is, the EPA stations are not operating Digilert 100 Geiger counters, nor anything close to that, and not all radiation detectors are created equal. True, a Digilert's normal background reading is about the 5 to 20 CPM that the author cites, but the normal readings for an EPA station are many multiples of that. Without going into detail, EPA stations use both larger and specialized radiation collectors, so really, the comparison to the Digilert is not as much apples and oranges, but more like watermelons to cherries.

For readers of the Veterans Today periodical, please write in and urge the author to make that correction. He needs to redefine the "norm" for those EPA stations using whatever that number is based on the specific radiation detectors that they operate. Thank you.

P.S. While the reporting of EPA data is a good thing, yes, relating their readings to those of our Radiation Network is a problem. One of the attributes of the Radiation Network, among others, is that our station operators use the same Geiger counters that any of us would typically acquire for our own personal safety, or what our first responders in cities like New York are also using, so that the radiation readings detected are very relate-able.
Content from External Source
http://radiationnetwork.com/Message.htm
 
sciencealert.com Link


Highest levels of Fukushima radiation detected off the US West Coast
Chill out, guys – the ocean's still safe.


FIONA MACDONALD
9 DEC 2015
Nearly five years on, the damaged Fukushima nuclear plant in Japan continues to leak small amounts of radiation into the Pacific Ocean, and more of that material is now showing up on the west coast of the US, according to new data.

Researchers have detected 110 new contaminated sites off the American Pacific coast, including the highest levels of radioactive contamination around 2,500 km west of San Francisco. That's still 500 times below US government safety limits for drinking water, so there's no need to panic even if you've recently been swimming or fishing in the Pacific. But it's an interesting insight into hownuclear waste spreads, and where the currents that govern our oceans have been moving.


"These new data are important for two reasons," said lead researcher Ken Buesseler from the Woods Hole Oceanographic Institution. "First, despite the fact that the levels of contamination off our shores remain well below government-established safety limits for human health or to marine life, the changing values underscore the need to more closely monitor contamination levels across the Pacific."

"Second, these long-lived radioisotopes will serve as markers for years to come for scientists studying ocean currents and mixing in coastal and offshore waters," he added.

Researchers have been continually monitoring the waters throughout the Pacific since the 9.0 magnitude earthquake caused the Fukushima nuclear plant to experience full meltdown in March 2011, on the look-out for radiation levels that may pose a risk to human health or the environment.

To date, the levels detected have remained well below the safe limit, and sampling of fish in British Columbia on the west coast of Canada hasn't shown any traces of Fukushima contamination, so there's no need for concern. But more radioactive material does seem to be appearing on the US Pacific coast.

So how do scientists know if radiation in the water has come specifically from Fukushima? Pretty much all seawater sampled from the Pacific will contain traces of an isotope called cesium-137, which has 30-year half-life and is left over from nuclear weapons testing carried out between the 1950s and '70s.

But Fukushima has its own unique isotope, cesium-134, which is like a 'fingerprint' of the Fukushima meltdown. With only a two-year half-life, it decays a lot quick than cesium-137, but it can still be detected in small amounts throughout the ocean, showing scientists exactly where the reactors radioactive material has spread.

Out of the 110 new contaminated samples detected off the US west coast, the most radioactive was collected around 2,500 km off the coast of San Francisco. It contained 11 Becquerel's per cubic metre of seawater – which is equivalent to 50 percent higher cesium levels than other samples collected in this part of the ocean so far.

Buesseler's research has also shown that Fukushima is still leaking radioactive material into the ocean in Japan, with the levels off the Japanese coast between 10 to 100 times higher than the levels off the US West Coast today.

"Levels today off Japan are thousands of times lower than during the peak releases in 2011," said Buesseler. "That said, finding values that are still elevated off Fukushima confirms that there is continued release from the plant."

Content from External Source
 
Back
Top