If by "corridors" you mean the blue arcs labeled 00:11UTC:
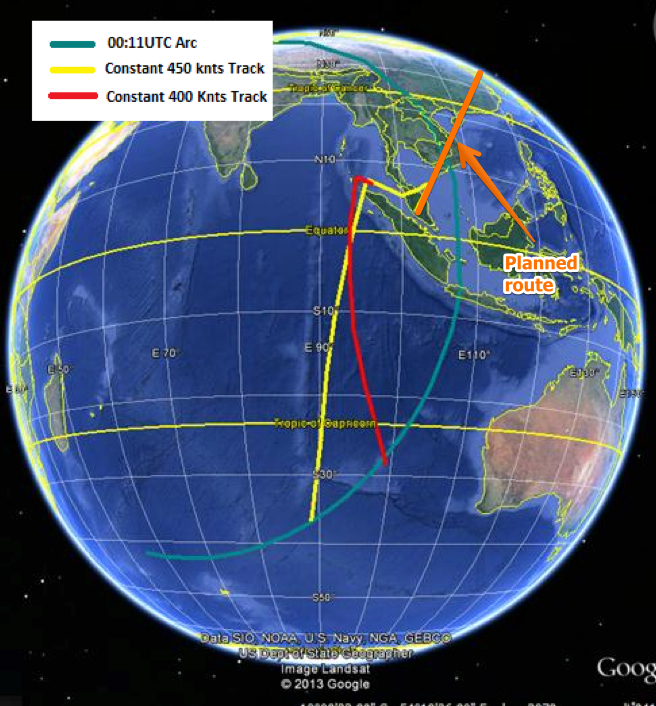
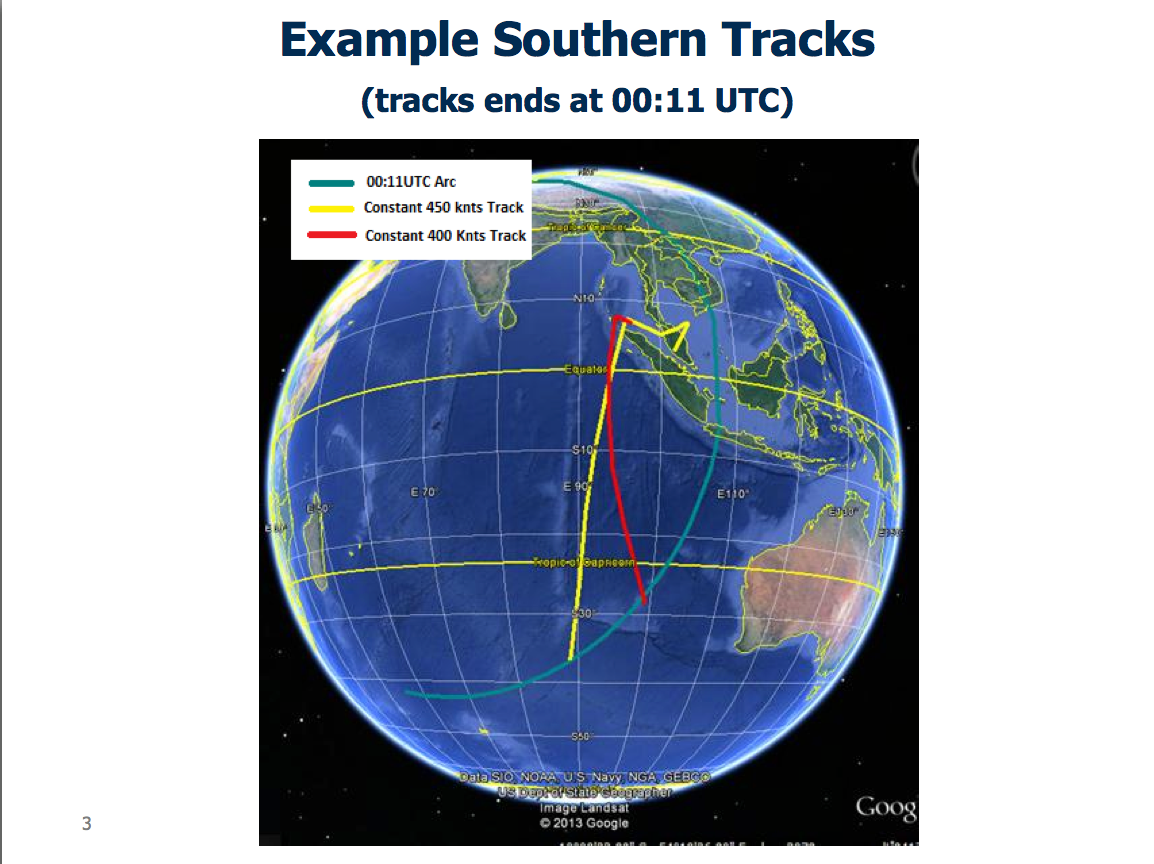
Those are not "corridors" in the sense of corridors along which the plane is thought to have travelled. They are a range of possible positions that the plane might be at 00:11UTC. The "ping" would have come from somewhere on the circle that includes those arcs, and the size of the arcs just represents the low and high estimates of the distance the plane travelled.
In some diagrams the middle of the arc is omitted. Here the arcs are joined - it's technically possible that the plane might have flown in circles for a few hours, then headed due east. But other factors seem to eliminate this, which is why the diagram is sometimes shown with a separate north and south arc.
See the yellow and red paths are actual possible paths, each of which end up somewhere on the southern arc.