Debunked: Dane Wigington's Claims That UV is "Off The Charts"

Status
Not open for further replies.

Jay Reynolds

Senior Member.
Update 6/9/2014: More concise debunking, including the latest "confirmed" claim, at:
https://www.metabunk.org/threads/de...irmation-of-record-shattering-uv-levels.3923/

Original post follows
-------------------------------------------------------------------------------------

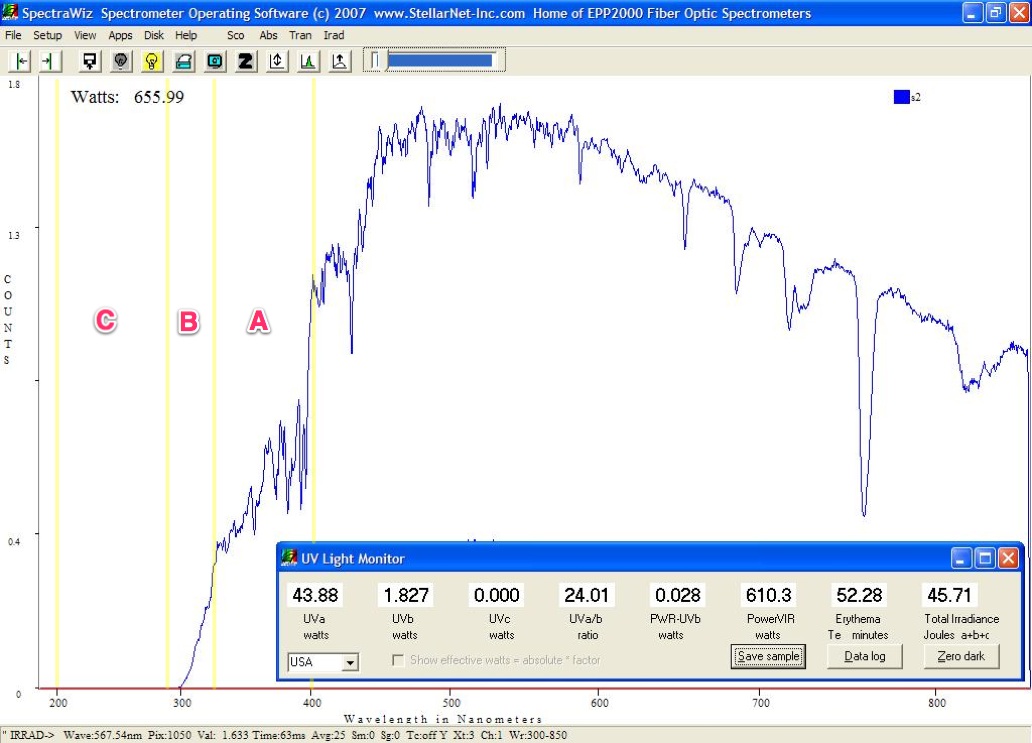
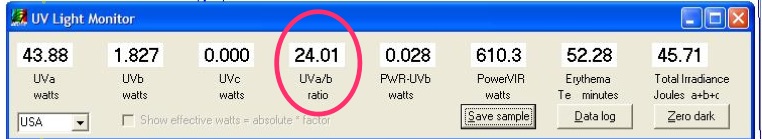
At his Geoengineeringwatch website and on a Global Skywatch Conference call on 7/29/13, Dane Wigington is claiming that measurements of ultraviolet radiation are "Off the Charts":

Off The Chart UV Levels Not Being Disclosed

Dane Wigington
geoengineeringwatch.org
So, How Bad Can It Get? Just when it seemed the negative news surrounding global geoengineering could not get any worse, it absolutely can and is.
We have known for some time that the UV levels were getting rapidly worse due to the ongoing atmospheric spraying. Anyone that is even slightly awake and aware has noticed that the sun feels incredibly intense on the skin. Most varieties of plant life are showing at least some signs of stress in most areas. In many regions, whole forests are in steep decline. And its getting worse by the day.
Although extreme drought and toxic rains (due in large part to the heavy metal fallout from geoengineering) are taking their toll, recent metering of UV levels in Northern California indicate that there is an element in this die off that is far worse than we had realized, an incomprehensibly high level of UV radiation.
With the assistance of a very generous and conscientious individual, geoengineeringwatch.org purchased top-of-the-line UV metering equipment which was put in the hands of a 40-year environmental metering veteran, with 20 years government experience and 20 years as a private consultant. Our findings are far beyond shocking.

This is the data he presents:
LINK

GEW-UV.jpg

I expect that the title of this thread will eventually be changed to Debunked: Dane Wigington's Claims That UV is "Off The Charts".

Have a look and see what you find.

Some preliminary comments:

1. He claims that the increase in UV is due to a decrease in ozone from "spraying", but rather than measure Total Column Ozone and showing a decrease, he is only displaying some measurements of UV.

2. As usual, we get no information on who actually took the measurements, what sort of instrument was used and whether or not it was calibrated or operated properly.

3. Some clue about the instrument and calibration might be found in this comment:
"The metering performed in Northern California, on which this statement is based, was done by a pair of identical state-of-the-art, brand-new, science-grade meters guaranteed to be scientifically calibrated to a range within 4%. As stated earlier in this article, the tech who did this metering is a 40- year veteran in environmental measurement and interpretation."

This could be Francis Mangels, who has previously been found to make bogus claims.

In his article, Wigington does challenge the public to investigate his claims:

Dane Wigington said:
Alarmism?
Do your own honest investigation and find out.

Original Page: http://www.geoengineeringwatch.org/geoengineering-is-destroying-the-ozone-layer/
Archived 9-19.2013: http://archive.is/mMlYn
Zip Archive attached.
 

Attachments

  • mMlYn.zip
    2.6 MB · Views: 1,167
Last edited by a moderator:
I am getting confused. People like Max claim Rickets is on the increase through lack of sunlight produced Vitamin D and UV light is used to treat Rickets. Now they are claiming UV is on the increase. I am off to sit in a dark room as a migraine is coming on.
 
We can check out ozone vertical profiles and multi-spectral UV data at the World Ozone and Ultraviolet Radiation Data Centre.

http://www.woudc.org/index_e.html

I've been spending most of my days this summer working and recreating outside, but all I got was this lousy tan.

Edit: Here's a page of global ozone maps. Looks pretty normal over North America with a percent deviation of somewhere around 0%.

http://exp-studies.tor.ec.gc.ca/e/ozone/Curr_allmap_g.htm
 
Last edited:
It's kind of great that 6 of the columns in his table are simple unit conversions for the same figures.
 
To be fair you are not comparing similar values. That is the UV index and you will have to convert their data for a like by like comparison.

Right, but if UV were on the rise, then wouldn't UV index be on the rise? Or am I confused - is UV index just a prediction based on other weather factors, and not a measurement?
 
Ah,
http://www.epa.gov/sunwise/uvicalc.html

The U.S. National Weather Service calculates UV Index using a computer model that relates the ground-level strength of solar ultraviolet (UV) radiation to forecasted stratospheric ozone concentration, forecasted cloud amounts, and elevation of the ground. The calculation done by some other nations also includes ground observations.

The calculation starts with measurements of current total ozone amounts over the entire globe, obtained via two satellites operated by the National Oceanic and Atmospheric Administration. These data are used to produce a forecast of stratospheric ozone levels for the next day at many points across the country. A computer model uses the ozone forecast and the incident angle of sunlight at each point to calculate the strength of UV radiation at ground level. Sunlight angle is determined by latitude, day of year, and time of day (solar noon). The strength of UV radiation is calculated for several wavelengths between 290 and 400 nm, the full spectrum of UV-B (290-320 nm) and UV-A (320-400 nm) radiation.
Content from External Source
So no actual UV measurements, just ozone measurements. But since he's claiming it's due to ozone, then effectively the charts should debunk his claim?

Of course the real question is what would be the expected readings in his chart.
 

Hacked?
Global MARCH Against Chemtrails and Geoengeneering Geoengineeringwatch.org was shut down by their own Domain provider that hosts the web site... DANE was posting this content to release it to the world when his isp blocked the entire site for no legal reason.this information he released is new and THEY do not want the public to know about it.THIS IS THE NEW WORLD ORDER FRIENDS PREPARED WE MIGHT BE NEXT OFF LINE FOR POSTING THE CONTENT TO !
Content from External Source
Sounds more like he forgot to pay the bill.

It's not as if he can't release the information on Facebook. Heck he could even post it here.


Hello Friends,

The Geoengineeringwatch.org website was taken down today by our host without warning. Our tech person tells us he has never seen anything like this happen before. He is dealing with it right now. Dane is certain this is not an accident. There have been many phone calls and email communications this week in the course of preparing this data for release. We suspect that the site was shut down to prevent this article from reaching the tens of thousands of you who visit our site daily.

The article, about our findings when testing UV levels is below. These findings are quite alarming.

Dane wants top get this information out there any way possible. He asks that you share this article far and wide for us.

If you want to order flyers, cards, bumper stickers, tshirts or dvd's, until we are back online, you can email me directly at: geowatch2012@gmail.com. I will set up a page end of the day for you to be able to order resources and I'll send you the link.

We have so much appreciation and respect for each one of you who have joined us in taking on this battle that none of us asked for!

Please send this information to as many people as possible. Let's get this out to 10 times the readers it would have reached had the site been up!

Yvonne
geoengineeringwatch.org

awww.nightingaledesign.org_images_uv_article_sun.png
Geoengineering is Destroying the Ozone Layer

Off The Chart UV Levels Not Being Disclosed

By Dane Wigington
geoengineeringwatch.org

We have known for some time that the UV levels were getting rapidly worse due to the ongoing atmospheric spraying. Anyone that is even slightly awake and aware has noticed that the sun feels incredibly intense on the skin. Most varieties of plant life are showing at least some signs of stress in most areas. In many regions, whole forests are in steep decline. And it's getting worse by the day.

Although extreme drought and toxic rains (due in large part to the heavy metal fallout from geoengineering) are taking their toll, recent metering of UV levels in Northern California indicate that there is an element in this die off that is far worse than we had realized, an incomprehensibly high level of UV radiation.

With the assistance of a very generous and conscientious individual, geoengineeringwatch.org purchased top-of-the-line UV metering equipment which was put in the hands of a 40-year environmental metering veteran, with 20 years government experience and 20 years as a private consultant. Our findings are far beyond shocking.

From a recent science study on excessive UV:

We are told UV-B is only a minor component of the total solar radiation, we now know this could not be further from the truth. Our recent metering reflects an exponential rise in UVB radiation. Due to its high energy, its potential for causing biological damage to plants, animals, and humans is exceptionally high and even small increases could lead to significant biological damage. There are numerous peer reviewed studies which verify this fact.

awww.nightingaledesign.org_images_uv_article_screen_shot_1.png
The Results

According to agencies like WHO, (World Heath Organizatin) and a long list of other recognized government sources of UV information like NOAA (National Oceanic and Atmospheric Administration), no more than 5% of the total UV reaching the surface of Earth should be UVB. The other 95% should be UVA.

These agencies go on to state that UVC should be ZERO.

What has our testing shown?

UVB - the most lethal form of UV radiation - has now escalated to almost 70% of the total UV reaching the surface of our planet. At least this is the case in Northern California. (This can only mean that total Ultra-Violate exposure has also escalated sharply, making overall UVB levels worse still.)

In addition, our testing has consistently shown significant levels of UVC which used to be filtered out by the ozone layer, some 100,000 feet up in our atmosphere.

Not any more.

UV is measured in spectral bandwidths. The higher the bandwidth, the more benign the UV; lower bandwidths are more lethal.

awww.nightingaledesign.org_images_uv_article_screen_shot_2.png

Current testing reveals that almost 70% of incoming UV radiation is currently in the UVB and UVC range. (Not 5% or less, as we are being told by all major agencies and their media mouthpieces).

This translates into nearly a 1,400% increase in UVB as a percentage of total UV. If UVA has also gone up due to the same ozone destruction which has driven up the UVB, this would indicate a likelihood that the total UVB and UVC is higher still - not just a difference of ratio with the same overall number.

What are the known negative effects of excessive UV exposure to plant life?

The Proof On The Ground

awww.nightingaledesign.org_images_uv_article_2.jpg

awww.nightingaledesign.org_images_uv_article_3.jpg

awww.nightingaledesign.org_images_uv_article_4.jpg


In the forests of Northern California, bark is literally being scorched from trees. On many specimens, only a thin strip of bark remains on the shaded side of the tree. Foliage is being scorched with many trees having only a fraction of their normal leaf cover. Many native species of plants are not even sprouting any more. The organisms that do still manage to grow appear miniaturized in some cases.

What are just some of the results of excessive UV exposure to plants?

  • Can stop sprouting of seeds, • Stunts growth, • Limb die off, • Reduced foliage, • DNA damage, • Changes nutrient distribution, • Mutatins, • Effects photosynthesis • Greatly increased mortality
  • SOME known effects of excessive UV exposure to aquatic life:
  • All aquatic life is particularly vulnerable to high UV levels.
  • Phytoplankton accounts for some 30% of the worlds' intake of animal protein. Phytoplankton and the microorganisms they consume are killed by excessive UV levels. (Global plankton populations have already been reduced by 40% to 50%. Much of the die off is likely due to increased UV radiation.)
  • Less plankton = less carbon-dioxide absorption.
  • Less plankton = less oxygen production. (Atmospheric oxygen content around the globe declining rapidly)
  • Less plankton = less fish. Period.
Bottom line: A crashing plankton population effects the entire food chain and all life on earth.

Excess UV kills coral reefs. So do waters warmed and made acidic by CO2 fallout. (Reefs are the nurseries of many crucial aquatic species and are in sharp decline around the globe.)

SOME of the known effects of excess UV on humans:

• Damaged immune system, • DNA damage • Damages sight • Causes various forms of cancer

Geoengineering Aerosols Destroy The Ozone Layer

This is not speculation, it is fact. There is a mountain of science data that confirms the ozone decimating effect of sunlight-reflecting particulates in the upper atmosphere. As geoengineering climate modeler Ken Caldeira warned after crunching the numbers for Dr. Edward Teller's aerosol “sunscreen”, the resulting rapid cooling of the stratosphere causes the formation of huge ice clouds that attract and concentrate ozone-destroying chemicals.

In addition, high nitrogen oxide emissions from fleets of aerosol-spreading jet tanker aircraft - and more than 93,000 daily airline flights - directly attack Earth's protective ozone layer.

Though many of these "science studies" do not admit geoengineering is already going on, this fact is not hard to confirm for any that do even the slightest investigation.

Numerous references are posted below this article.

At A Crossroad

The gravity of our collective crisis cannot be overstated. Current UV metering makes clear we are now being exposed to dangerously high levels of UV radiation, specifically UVB and UVC.

The metering performed in Northern California, on which this statement is based, was done by a pair of identical state-of-the-art, brand-new, science-grade meters guaranteed to be scientifically calibrated to a range within 4%. As stated earlier in this article, the tech who did this metering is a 40- year veteran in environmental measurement and interpretation.

Here in Northern California, we are already seeing frighteningly visible damage to foliage, trees, and plants. The ramifications of extremely high UV levels to all life forms – including us – are grave. As the die-off of other species go, so will we. We are in the 6th Great Mass Extinction – right here, right now! (References below)

If geoengineering continues unabated, and the ozone layer is completely destroyed, it will be game over for us all. No ozone layer = no life on Earth.

It's that simple.

Global geoengineering is tearing apart the entire fabric of life on our planet. • Geoengineering is poisoning our air, waters, and soils. • Geoengineering is pushing increasingly erratic atmospheric processes resulting from human-propelled climate change past the Chaos threshold into unpredictable, self-reinforcing, cascading events. • Geoengineering is disrupting the jetstream and all natural weather patterns, which in turn is fueling catastrophic climate feedback loops – the most dire of which are mass methane hydrate releases from the Arctic tundra and seafloor. • Geoengineering is destroying the stratospheric solar radiation shielding, which protects all life on Earth.

Alarmism?

Do your own honest investigation and find out.

Global awareness of these lethal programs is rising quickly, but not fast enough. Its up to all of us to help shine the light on this life-or-death issue.

Every day counts.
Content from External Source
 
Wigington was claiming that his site was "taken down" on Monday night. I had no problem this morning accessing his site. Whenever these people have an internet problem, it is always seen as being someone else's fault, somehow related to them, and someone not wanting something to "come out". The interesting thing is that what they are saying about UV will turn out to be false, and that fact will be what the original claimants won't let "come out". That is my prediction in this case based on their previous actions.
 
So he's saying
According to agencies like WHO, (World Heath Organizatin) and a long list of other recognized government sources of UV information like NOAA (National Oceanic and Atmospheric Administration), no more than 5% of the total UV reaching the surface of Earth should be UVB. The other 95% should be UVA.

These agencies go on to state that UVC should be ZERO.
Content from External Source
And his table shows:
upload_2013-7-31_12-0-43.png

So he has UVA at 7.40 mW/cm2, and UV A/B at 16.67, and since 7.40 is about 45% of 16.67, and the WHO says that "no more than 5% of the total UV reaching the surface of Earth should be UVB" (Wikipedia actually seems to say "no less than"), and here his measurements suggest 55% UVB, then something is messed up.

So the question here would be, is UVB = (UV A/B) - UVA? On the meter he is using. And is the "amount" suggested by the 95% measured in watts?
 
Of course the real question is what would be the expected readings in his chart.

Sam old playbook from the Mt. Shasta bunch.

They pulled the same trick with aluminum, barium and strontium found in rainwater. They made claims that the levels of elements were high, but never did come up with any support for what was expected.

They are using a meter which supposedly reads UV-C. Ordinarily solar UV-C is effectively filtered out That leads me to think it is some type of meter usually used by fabricators for curing coatings, inks, and adhesives. I'd expect those are not designed to measure low intensity UV as in sunlight, rather are specifically designed for measuring high intensity light from lamps.

UV curing.jpg

Here is an example of that sort of meter:
http://www.oai-instruments.com/OAI_Model50-energyMeterUVCure.html
 
Last edited:
If someone was on site, they should be able to test the meter's accuracy by placing a sheet of glass between the sensor and the sunlight. Below 330nm, UVC and UVB should almost all be blocked by ordinary glass. If their meter stills shows high, something is wrong.

Just a quick and dirty yet practical test to see if their meter is giving high readings.
 
I can't find any meter so far that measures A, A/B and C. I though I had it above but that is three different meters. The higher end meters don't even measure UVB (just UVA and UVC), and the UVAB and UVB meters seem like novelty items.

Apparently the solid state meters can be wildly off, and you have to use a Spectrophotometer to get accurate results.

This is all meaningless until he says what meter he was using.
 
I am limited in what as I can do as I have broken my laptop and am stuck with my phone. I came across this site http://uvb.nrel.colostate.edu/UVB/uvb_dataAccess.jsf
http://uvb.nrel.colostate.edu/UVB/uvb-dataAccess.jsf

It seems to have plenty of raw data to directly compare. Hopefully be some use

Indeed it does, accurate UVA and UVB readings for the last five years for Davis, CA (Closest to Wigington)

upload_2013-7-31_13-35-50.png

Peaks are summer. Note UVA goes to 1600 (1.6 Mj = 1600 Kj), UVB goes to 45, hence only about 3% of the total.

So quite clearly this is debunked. Wigington is simply measuring it wrong. The ratio of UVA to UVB is as it should be, and there has been no change in the last five years.

Note this is a total energy measure (Joules per m2 per day), whereas Dane is just measuring the rate at noon (Watts per m2).
 
Last edited:
the
I can't find any meter so far that measures A, A/B and C. I though I had it above but that is three different meters. The higher end meters don't even measure UVB (just UVA and UVC), and the UVAB and UVB meters seem like novelty items.

Apparently the solid state meters can be wildly off, and you have to use a Spectrophotometer to get accurate results.

This is all meaningless until he says what meter he was using.
During the Global Skywatch Conference call, Wigington mentioned that the UV meter he was sending to Russ Tanner cost about $200, so yes, they are using a cheap meter.
 
I think they are in danger of ending up their own arses. How can they reconcile their claim of Global Dimming against the claim of ozone reduction and increased UV irradiation. As far as I am aware ozone depletion is still happening but how can chemtrails cause it? I raise the issue again if their claims the rise in rickets is down to chemtrails.

Poor Max Bliss is going to be losing it when he finds out it is increased UV making his figs wilt.
 
I recall that when they did their water tests they once tried taking two samples from the same rain, and got different results on the lab analyses.

In this case, Wigington says they have two instruments, but are only showing one set of results, presumably from one instrument.
Repeatability is one hallmark of good science. They could have done a rough check of their instrument/method by comparing one instrument against the other at the same time.

Also in this case, Solrey has noted that the time of meter readings are different from day to day, some as late as 1500 hrs. It would have been better experimental procedure to take their readings at the same time of day. For instance, the UVC levels they show are exactly the same at 12:50 or at 3pm, whether on a "clear" day or 50% cloudy day. Did that really seem plausible to them?

These problems don't surprise me. Mangels has always been long on verbal announcements, but short on analysis and quality control. To date, he has NEVER documented anything on a level which would pass muster in a normal high school Science Fair project.

GEW-UV UVC.jpg

Just as they told folks to scoop up a little DIRT when taking WATER samples........
 
Last edited:
I think they are in danger of ending up their own arses. How can they reconcile their claim of Global Dimming against the claim of ozone reduction and increased UV irradiation. As far as I am aware ozone depletion is still happening but how can chemtrails cause it? I raise the issue again if their claims the rise in rickets is down to chemtrails.

Poor Max Bliss is going to be losing it when he finds out it is increased UV making his figs wilt.

Yes, Max is saying that rickets is up due to less UV generating vitamin D in the skin, while Wigington is claiming that UV levels are higher, not less......

Wigington claims that ozone in the stratosphere has decreased which has led to high levels of UV. He will most likely claim that all ozone and UV monitoring has been controlled by the New World Order.

However, private citizens like Forrest Mims III have been monitoring ozone, UV, and even aerosols for many years as part of their own personal research. They have independent meters.

How do you control that?
How do you accomplish such control, Dane?
How do you keep your people thinking that sunlight has been dimmed down 22%, yet now have them believe UV is "Off The Charts"?
Do you really think they won't notice the change in tactics?
 
Last edited:
How do you control that?
How do you accomplish such control, Dane?
How do you keep your people thinking that sunlight has been dimmed down 22%, yet now have them believe UV is "Off The Charts"?
Do you really think they won't notice the change in tactics?


Of course they'll never notice the change in tactics. They still haven't resolved if the planes are an unmarked fleet, commercial airlines, drones, ufos, holograms... They'll move the goal posts and glom onto whatever "theory" maintains their status quo.
 
I'd like to know, considering that the ozone layer is generally recognised to start at around 60000 feet, how it would be possible to damage the ozone layer via their current meme?

No contrailing aircraft can fly within 3 miles of that altitude, 5 with any sort of load.

I believe Wigington is altering the writings of Dr David Karoly, an Australian climate scientist, who has sounded the warning about possible damage to the ozone layer should projects like SPICE be implemented.

http://theconversation.com/geo-engineering-why-research-something-we-never-want-to-use-3684
Content from External Source
Of course, SPICE has nothing to do with aircraft emitting a contrail. The assertion that it does only indicates wilful disinformation or ignorance.

I can't find Karolys original work, here is a related one that specifically mention sulphur injection into the stratosphere, something that is definitely not related to white lines in the sky.


http://environmentalresearchweb.org/cws/article/news/34082
Content from External Source
 
[Update: after seeing photos of the actual meter readings, it now seems that the A/B reading IS actually what is coming out of the meter that should be measuring A+B, hence my analysis here is incorrect. See:
https://www.metabunk.org/threads/de...t-uv-is-off-the-charts.2097/page-2#post-62322
and
https://www.metabunk.org/threads/de...t-uv-is-off-the-charts.2097/page-3#post-62462
]


I think I have it figured out. Look at the table again:


Dane's Claim:

Current testing reveals that almost 70% of incoming UV radiation is currently in the UVB and UVC range. (Not 5% or less, as we are being told by all major agencies and their media mouthpieces).

This translates into nearly a 1,400% increase in UVB as a percentage of total UV. If UVA has also gone up due to the same ozone destruction which has driven up the UVB, this would indicate a likelihood that the total UVB and UVC is higher still - not just a difference of ratio with the same overall number.
Content from External Source
He's basing that on say the "Full Particular Coverage" row of UVA of 3.71 and UV A/B of 10.4, so he calculates the percentage of UVB as (10.4-3.71)/10.4 = 64%.

Now look at this chart of a typical UV light absorption spectra.


I've marked the regions of UVA,B and C. The amount of radiation is the area under the line. And you can see the numbers in the box. The units are different here, but we have UVA 43.88, UVB 1.827, and UVC of zero. Clearly here (and this is generally what the curve looks like) the UVB is a lot less than UVA, so what is going on? The amount of UVB he is suggesting is incredibly dangerously high, totally turning the expected absorption curve on its head.

But look at the next box:


UV A/B isn't UVA + UVB it's UVA/UVB. UVA divided by UVB. It's the ratio, not the sum. On meters that measure it, the sum is written UVAB.

So once we know that, it's quite clear that these figures are not unusual at all. In fact for a normal clear day the ratio of UVA to UVB is pretty much what you would expect around 5 or 6%. It's higher on cloudy days, but that's perfectly natural.

So debunked here is the claim that UV is in any way "off the charts".
 
Last edited:
So, Mick, do you have a UV meter able to measure the levels for yourself?

Wigington repeated the percentage claim again yesterday with some more details in an interview (hour 2):

http://www.blogtalkradio.com/cfp-radio/2013/08/06/the-hagmann-hagmann-report

A transcript will help show the debunking. He says he is very sure about his math....
It's clear in his explanation he thinks his meter is reading UVA/B as total of A+B rather than a ratio of A to B (A divided by B). Francis Mangels who ran this meter is obviously incorrect. :oops:
 
If I am doing the math right, the total UVA plus UVB would be the UVA/UVB ratio plus 1, in unitless numbers. Divide 1 by this sum to get the percent UVB. If you throw out the anomalous cloudy day, the average percent UVB for the other eight days of Dane Wigington's data is 5.6%.
 
If I am doing the math right, the total UVA plus UVB would be the UVA/UVB ratio plus 1, in unitless numbers. Divide 1 by this sum to get the percent UVB. If you throw out the anomalous cloudy day, the average percent UVB for the other eight days of Dane Wigington's data is 5.6%.

Your end result is right, but I don't think it makes sense to say the total is unitless, it's the ratio that's unitless. It's easier if you simplify the terminology

R = A/B (ratio), hence B = A/R
T = A+B (total), hence T = A + A/R, or T = A(1+1/R)

The percentage is B/T, we have to express that in terms of A and R,
B/T = (A/R) / (A + A/R)
B/T = 1/(R+1)
 
Last edited:
As a biologist who specializes in problems that afflict trees, this sort of thing really drives me nuts:
The Proof On The Ground


In the forests of Northern California, bark is literally being scorched from trees. On many specimens, only a thin strip of bark remains on the shaded side of the tree. Foliage is being scorched with many trees having only a fraction of their normal leaf cover. Many native species of plants are not even sprouting any more. The organisms that do still manage to grow appear miniaturized in some cases.
Content from External Source
Besides the fact that these show trees in stressful urban settings rather than natural forests, all of the above pictures show symptoms that can happen from very mundane causes. Taking some pictures of such anecdotes doesn't show that anything unusual is happening on a landscape scale - because at any given time in any given area, there are always problems happening on trees. It would be tremendously UN-natural for there to be a large area where all trees were completely free of pests, disease, environmental stress, or injury. Most people pay no attention to these things on a daily basis, but when people start looking for tree problems, they absolutely will find them. (I'm cursed with a constant awareness of them, due to my work.)

I'm reminded of something that happened a couple of years ago. I received a sample shipped from a state park consisting of a big bag of dead leaves, from several different tree species - basically useless. I called the park biologist, who said that they had many trees, of many different species, all suddenly dying at an alarming rate. I scheduled a visit to check it out. As it turned out, they did have a few trees of one species (redbay) which were rapidly dying from a known issue that is a serious concern on that species: laurel wilt disease, caused by an exotic ambrosia beetle and its symbiotic fungus, which had just spread to that area. But apparently that had caused them to look around at all of their other trees, and suddenly notice symptoms from issues that are completely common and normal for those species - like leaf spots and galls, twig borers, aphids, etc. The incidence of those symptoms had not increased suddenly or abnormally, but the park staff's awareness of them had.

The other side of it is that if unusual, massive, unexplained dieback and mortality of trees on a were happening on a landscape scale, there are plenty of biologists specializing in tree problems in northern California who would absolutely be ringing the alarm bell and trying to figure it out. Are all of these people now in on the conspiracy as well? And why am I not seeing it where I am, is the effect restricted to northern CA?
 
Last edited by a moderator:
If the UV were so high that bark is being burned off of trees, why isn't everyone walking around with severe sunburns, why are people not reporting to hospital?
If UV were so high that bark is being burned off of trees, why isn't the local farming community getting on board?
Here is the local farming magazine for Northern California, nothing there:
http://www.ediblecommunities.com/shastabutte/online-magazine/summer-2013/table-of-contents.htm

Here are the farmer's markets in Dane Wigington's area around Redding, CA.
http://www.shastagrowersassociation.com/

http://healthyshasta.org/farmersmarkets.htm

Here is what the local Community Supported Ag farm is providing THIS WEEK.

Churn Creek.jpg


If I were Dane Wigington, I surely wouldn't brag about using this sort of meter to do reliable science:
http://www.omega.com/pptst/HHLM3_HHUVA1.html
 
I think I have it figured out. Look at the table again:


Dane's Claim:

Current testing reveals that almost 70% of incoming UV radiation is currently in the UVB and UVC range. (Not 5% or less, as we are being told by all major agencies and their media mouthpieces).

This translates into nearly a 1,400% increase in UVB as a percentage of total UV. If UVA has also gone up due to the same ozone destruction which has driven up the UVB, this would indicate a likelihood that the total UVB and UVC is higher still - not just a difference of ratio with the same overall number.
Content from External Source
He's basing that on say the "Full Particular Coverage" row of UVA of 3.71 and UV A/B of 10.4, so he calculates the percentage of UVB as (10.4-3.71)/10.4 = 64%.

Now look at this chart of a typical UV light absorption spectra.


I've marked the regions of UVA,B and C. The amount of radiation is the area under the line. And you can see the numbers in the box. The units are different here, but we have UVA 43.88, UVB 1.827, and UVC of zero. Clearly here (and this is generally what the curve looks like) the UVB is a lot less than UVA, so what is going on? The amount of UVB he is suggesting is incredibly dangerously high, totally turning the expected absorption curve on its head.

But look at the next box:


UV A/B isn't UVA + UVB it's UVA/UVB. UVA divided by UVB. It's the ratio, not the sum. On meters that measure it, the sum is written UVAB.

So once we know that, it's quite clear that these figures are not unusual at all. In fact for a normal clear day the ratio of UVA to UVB is pretty much what you would expect around 5 or 6%. It's higher on cloudy days, but that's perfectly natural.

So debunked here is the claim that UV is in any way "off the charts".

Just a thought. Why are the figures for each days UV A/B different? As a ratio of A to B surely they will all be the same? It's almost as if they are trying to hide any relationship in clear view.
 
Last edited by a moderator:
As a biologist who specializes in problems that afflict trees, this sort of thing really drives me nuts:
The Proof On The Ground

In the forests of Northern California, bark is literally being scorched from trees. On many specimens, only a thin strip of bark remains on the shaded side of the tree. Foliage is being scorched with many trees having only a fraction of their normal leaf cover. Many native species of plants are not even sprouting any more. The organisms that do still manage to grow appear miniaturized in some cases.
Content from External Source
Besides the fact that these show trees in stressful urban settings rather than natural forests, all of the above pictures show symptoms that can happen from very mundane causes. Taking some pictures of such anecdotes doesn't show that anything unusual is happening on a landscape scale - because at any given time in any given area, there are always problems happening on trees. It would be tremendously UN-natural for there to be a large area where all trees were completely free of pests, disease, environmental stress, or injury. Most people pay no attention to these things on a daily basis, but when people start looking for tree problems, they absolutely will find them. (I'm cursed with a constant awareness of them, due to my work.)

I'm reminded of something that happened a couple of years ago. I received a sample shipped from a state park consisting of a big bag of dead leaves, from several different tree species - basically useless. I called the park biologist, who said that they had many trees, of many different species, all suddenly dying at an alarming rate. I scheduled a visit to check it out. As it turned out, they did have a few trees of one species (redbay) which were rapidly dying from a known issue that is a serious concern on that species: laurel wilt disease, caused by an exotic ambrosia beetle and its symbiotic fungus, which had just spread to that area. But apparently that had caused them to look around at all of their other trees, and suddenly notice symptoms from issues that are completely common and normal for those species - like leaf spots and galls, twig borers, aphids, etc. The incidence of those symptoms had not increased suddenly or abnormally, but the park staff's awareness of them had.

The other side of it is that if unusual, massive, unexplained dieback and mortality of trees on a were happening on a landscape scale, there are plenty of biologists specializing in tree problems in northern California who would absolutely be ringing the alarm bell and trying to figure it out. Are all of these people now in on the conspiracy as well? And why am I not seeing it where I am, is the effect restricted to northern CA?

I am seeing more and more posts on Max Bliss facebook page on this same vain. Here is the latest pics:
https://www.metabunk.org/data/MetaM...0x480_12677_10151533531861791_763255137_n.jpg


My background is not biology but I can google and this looks like Septoria leaf spot http://anr.ext.wvu.edu/r/download/57038 page 6


and http://vegetablemdonline.ppath.cornell.edu/factsheets/Tomato_Septoria.htm describes it as a fungus.

So now everything is Chemtrails and not just normal behavior.

Like I said this seems to be the new angle of attack, do not just look up, look down everything is dying or deformed based on Chemtrails...
 
Last edited by a moderator:
Like I said this seems to be the new angle of attack, do not just look up, look down everything is dying or deformed based on Chemtrails...

And it will work for the same reason "look up" works. If you look up you will see contrails, and because it's something you've not paid attention to, you'll think it's something new.

Again, exactly like the Seattle Windshield Pitting Epidemic,
http://en.wikipedia.org/wiki/Seattle_Windshield_Pitting_Epidemic

Or chemspots (look down!)
http://chemspots.wordpress.com/2010/12/09/chemspots-hidden-in-plain-sight/
 
Actually I'm surprised there are not more microscopic photos of "chem-residue" or "chem-webs"
 
Status
Not open for further replies.
Back
Top