I see both Enews and naturalnews being used to back up the claims. I have found both of those to often either 'magnify' something, or to be out and out lying about things.
I don't think either one of them checks the sources of their posters.
It would be nice to have some info from 2013 instead of 2011.
Where is the link to the Vancouver Sun article that claims radiation levels in seaweed tested from waters off the coast of British Columbia were 4 times the amount considered safe? The worldtruth.tv page links to Enews and the Enews link 404's.
The claims in this article are very radical, and a lot of them have been already debunked or proven false.
External Quote:
Infant mortality rates across the United States have increased by more than 35% since the nuclear disaster, according to a court statement by Dr. with independent scientist Leuren Moret, MA, PhD. A study published in The International Journal of Medicineindicates that more than 20,000 deaths right here in North America can be directly attributed to the release of radioactive material from Fukushima.
You should be aware that the journal article that is the crux of this point has been met with a lack of good press from the peer review process. Essentially, the article is using a false premise and making an appeal to emotion and the scientific community has ripped it apart and completely debunked it. They cherry picked their data to fit their emotional appeal. That is hardly science at all and is a display of cognitive bias to the scientific community.
More important, why did the authors choose to use only the four weeks preceding the Fukushima disaster? Here is where we begin to pick up a whiff of data fixing. Though the CDC doesn't provide the data in its weekly reports in an easy-to-manipulate spreadsheet format (that would be too easy), it does provide a handy web interfacethat allows individuals to access HTML tables for specific cities.
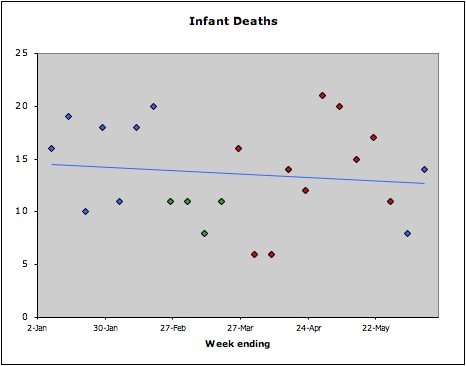
I copied and pasted the 2011 figures from the eight cities in question and culled all data aside from the mortality rates for children under one year old. You can see those numbers in aGoogle doc I've posted here. (Note: Because I use the most recent report, my mortality figures are slightly higher than the Sherman and Mangano's, as some deaths aren't reported to medical authorities until weeks afterward. The small difference doesn't change the analysis.)Better still, take a look at this plot that I've made of the data:
The Y-axis is the total number of infant deaths each week in the eight cities in question. While it certainly is true that there were fewer deaths in the four weeks leading up to Fukushima (in green) than there have been in the 10 weeks following (in red), the entire year has seen no overall trend. When I plotted a best-fit line to the data (in blue), Excel calculated a very slight decrease in the infant mortality rate. Only by explicitly excluding data from January and February were Sherman and Mangano able to froth up their specious statistical scaremongering.
This is not to say that the radiation from Fukushima is not dangerous (it is), nor that we shouldn't closely monitor its potential to spread (we should). But picking only the data that suits your analysis isn't science—it's politics. Beware those who would confuse the latter with the former.
I cannot locate the source for your article's radiation claims and that is making it difficult to substantiate their results. For example they list erroneously 181 times federal standard but do not list what isotope that is for. Those seem more like re-hashed radical claims that were made in 2011. Our best science to this date shows that this disaster is hardly measurable in the USA without specialized equipment, and also that the levels were far below the public health hazard standards across the board.
The article the OP posted also claims that the government does not measure radiation. They most certainly do; those kinds of claims are pure hokum.