Scott Gates
Active Member
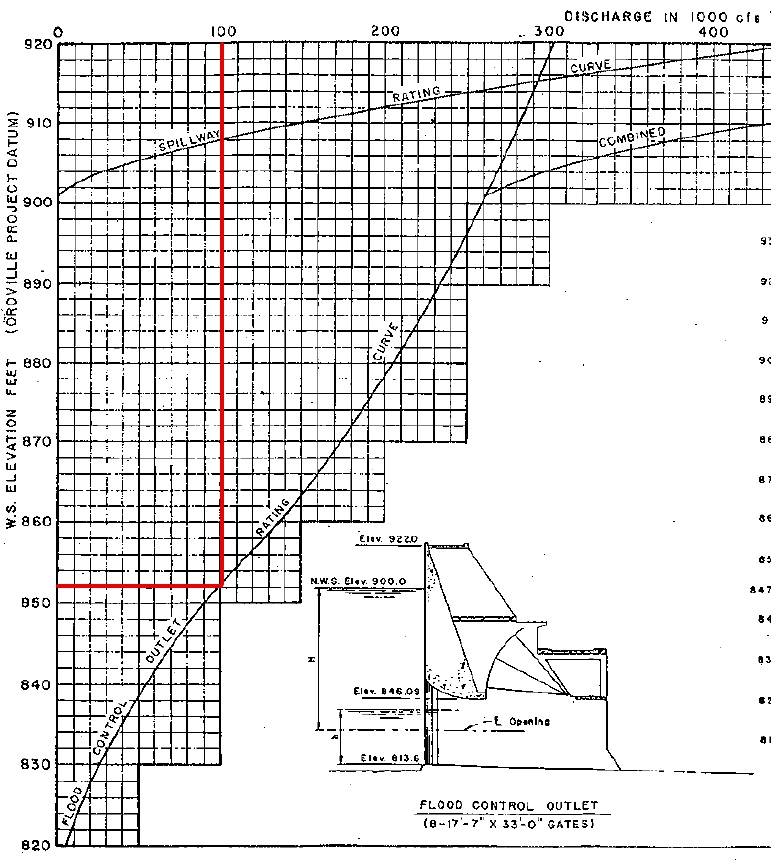
An interpolated view of appx. elevations for front of the Emergency ogee weir ...


A guess is maybe water is supplied to these drain pipes when spillway flow is initiated - perhaps a pipe along each side of spillway that runs from top ... and the discharge topside creates a negative pressure in the drain pipes to draw water out of the subsurface?
It helps me if I look at it backwards and sideways:
")
Great find!! I meant maximum controlled release. An ogee crest spillway at ~1770 ft long can indeed discharge a BUNCH of water - and kiss that drainage slope just downstream of the emergency spillway good-bye. Thanks for posting that design description.You mention "dam overtopping". The graph I just posted shows that at dam-top height, the emergency spillway alone would carry 440,000 cfs. That number is not an accident, as it is the 450-year flood inflow number. Most of the dam descriptions, however, assume that the dam is being operated and never has to deal with that.
From the spillway design description, from page 100 of https://archive.org/stream/zh9californiastatew2003calirich
External Quote:
The flood control outlet was sized on the basis of
limiting Feather River flow to leveed channel capacity
of 180,000 cfs during occurrence of the standard
project flood (peak inflow 440,000 cfs). This limitation
applies at the confluence of the Feather and Yuba
Rivers approximately 35 miles downstream of the
Dam. It was estimated that a runoff of 30,000 cfs could
be expected within this 35-mile reach of the Feather
River during the standard project flood. Therefore,
the flood control outlet was designed for a controlled
release of 150,000 cfs. The normal reservoir water surface
previously had been set at elevation 900 feet.
To meet these criteria, a flood control reservation of
750,000 acre-feet was needed. The criteria also governed
the size and location of the flood control outlet
gates. The outlet must release 150,000 cfs at water
surface elevation 865 feet to control the flood shown
on Figure 80.
The standard project flood has a probability recurrence
interval of approximately 450 years. If data received
indicate a flood is developing greater than the
standard project flood, release through the flood control
outlet may be increased above 150,000 cfs but may
not exceed 90% of the inflow. When the reservoir fills
above elevation 901 feet, flow occurs over the emergency
spillway. The emergency spillway, in conjunction
with the flood control outlet, has the capacity to
pass the maximum probable flood release of 624,000
cfs for the drainage area (peak inflow 720,000 cfs)
while maintaining a freeboard of 5 feet on the embankment.
The maximum probable flood has a probability
recurrence interval in excess of 10,000 years.
Thanks for pointing this out. I stand corrected. Good Job!Nope. Find 917 feet near top left of chart, as that's the maximum "Design Flood Pool". The curves on the right are at 350,000 for the emergency spillway and 296,000 for the main spillway individually. At that point there's about 16 feet of water flowing over the emergency spillway.
The TerraServer site has a series of higher resolution images of the area:
But of particular interest is this one labeled 2016-05-02
View attachment 24928
View attachment 24929
Appears to show some turbulence at the spot where the damage occurred.
That road has been there since construction. There's some kind of solar powered sensor there, possible a weather station or seismograph.There appears to be a small road approaching that area from the right (the dam side). I wonder if it was an area of concern that they thought they'd need to look at often.
how many of them were there?
See Ward's models at https://websites.pmc.ucsc.edu/~ward/External Quote:a computer simulation by UC Santa Cruz research geophysicist Steven Ward shows flood waters would hit Highway 70 in about 30 minutes. In less than three hours, it would hit Highway 99. After 9 hours, it would fan out to cover a 231-square mile area.
Ward says it would be a massive wave near Oroville. The videos of the main spillway releasing 100,000 cubic feet per second pale in comparison.
"We've seen all week the videos of the regular spillway operating at full speed at about 100,000 cubic feet per second. This partial break is about 20 times that. It's going to overpower the dikes and levees for sure," says Ward.
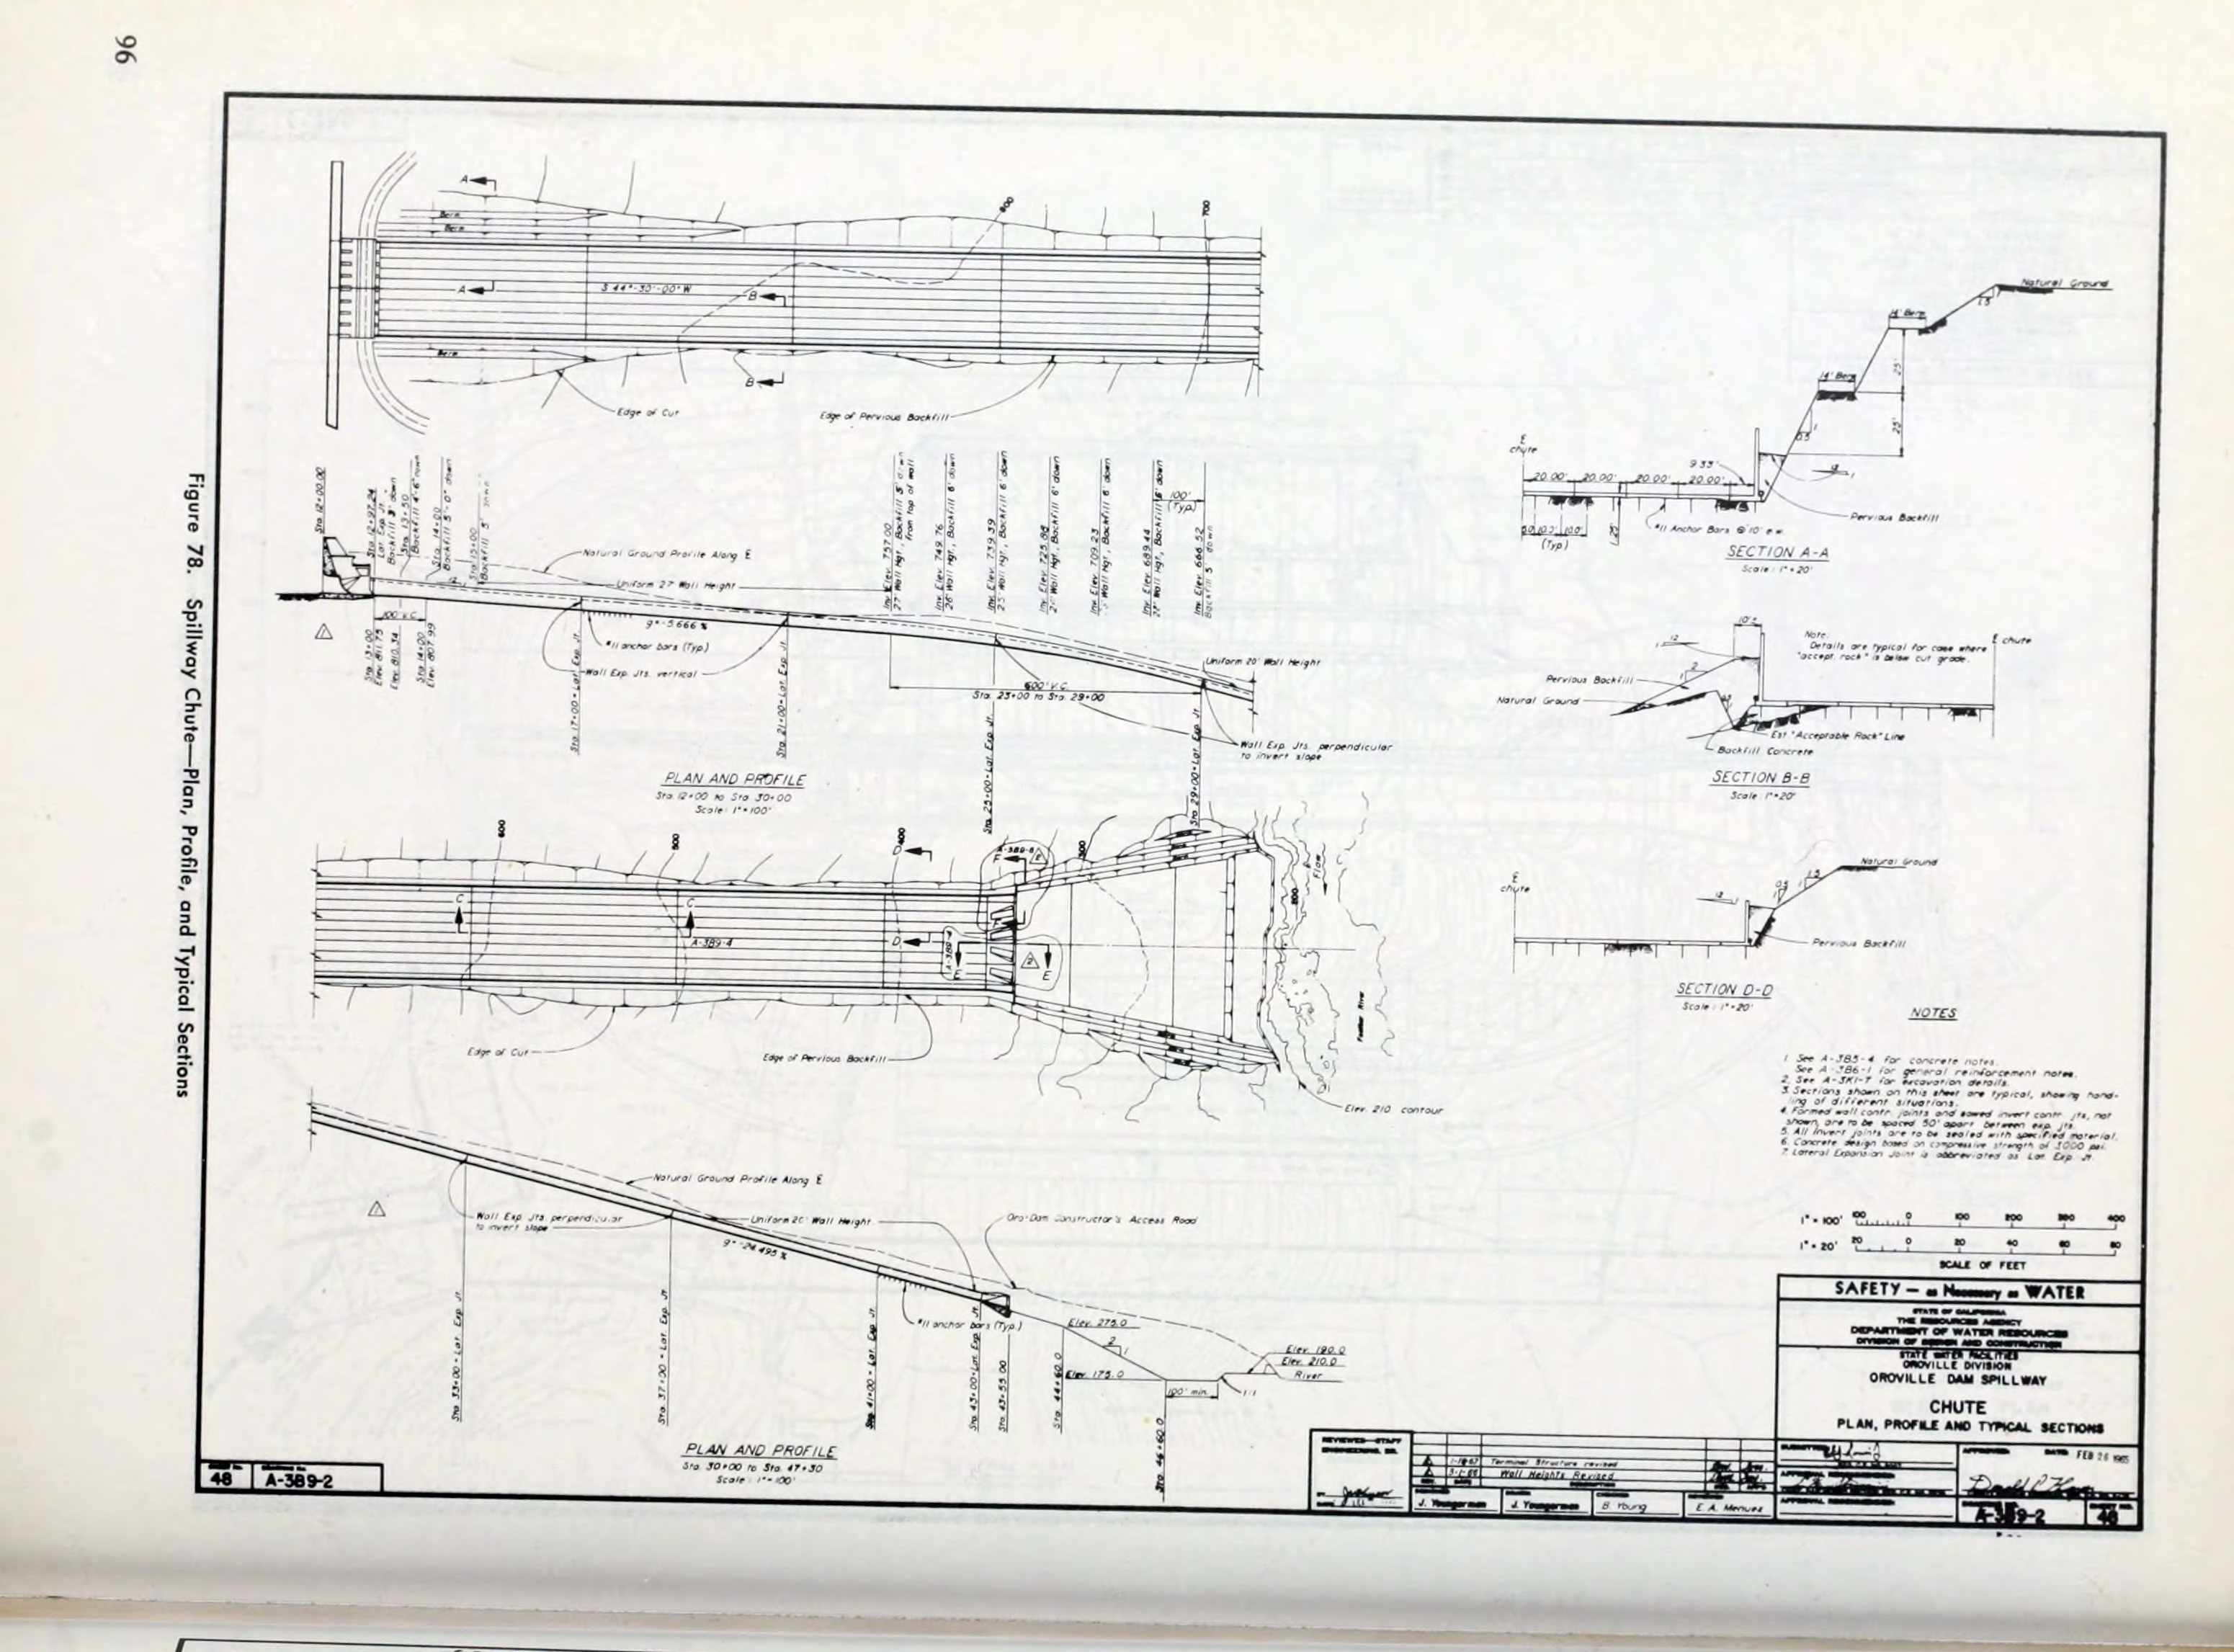
If you look carefully at the detail in the upper right hand corner, it indicates that the anchors are at 10' centers each way.
I've never worked on dams or spillways or other things that transport water, but have designed anchors into rock that hold concrete to it.Lots of comments and questions about anchors in this thread (what are they? were they corrosion protected? how many of them were there?, etc)...in just this one picture below (http://pixel-ca-dwr.photoshelter.co...0kN9PORvuykE/KG-oro-spillway-damage-10060-jpg), I count the remains of 22 anchors visible, most of which are still very much permanently embedded into solid bedrock. Of those 22 anchors, I only see 2 of which show any signs of corrosion at all (both are brown colored...likely rusted).
View attachment 24934
My comments:
1) What's a little disconcerting to me is how many of the anchors look to have no damage at all to them, despite supposedly being embedded into the concrete poured above them and supposedly then having that concrete forceably stripped off of them by unreal forces. Someone with knowledge of concrete slab failure will have to enlighten us on how this is possible.
2) On center spacing laterally appears to be fairly consistent, but the spacing up and down the slope seems to be sporadic. Would this be due to entire lines of anchors being pulled from their locations as the concrete failed in certain places while concrete failure did not pull anchors in other locations, or would this spacing have been a byproduct of the original construction?
3) In browsing this photo, I believe I found the broken drain pipe for the next drain downstream. I circled this area in blue and enlarged it. The lateral location, the orientation, the shape and size of the object, and the position up and down the slope all support the idea that this might be a drain pipe that has turned the corner out beyond the far edge of the slab and is now heading downstream for the next drain exit. The next question this brings up...what is this pipe made of? These days, it's PVC. Back then? This picture and pictures elsewhere of the 90 degree elbow still attached to the sidewall indicate heavy material corrosion (looks like rust, especially for the 90 degree elbow). Would these pipes be heavily rusted, and therefore contributed to underslab erosion due to material failure?
http://www.mercurynews.com/2017/02/17/oroville-dam-what-made-the-spillway-collapse/External Quote:"They have to look at their procedures and modify them," he said. "Clearly the spillway is going to have to be rebuilt," a job that will cost hundreds of millions of dollars.
And the investigation won't be easy.
"All evidence of what caused this thing," Sitar said, "has been washed away."
The "new flow" down the hillside some were worried about earlier today ... simply a flow that has been running for days thru the breech in main spillway wall on emergency spillway side ... has become more pronounced with the rain, some likely additional opening downslope with embankment sloughing, and potentially because they have SLOWED the rate from 100,000 down to 70,000 cfs - which makes it easier for water to accumulate at the wall break than at higher flows ...
View attachment 24868
=================Ward's Partial Failure of the Oroville Emergency Spillway Model
2 million cfs flow would flood the primary California State Highway SR70 evacuation route within 30 minutes! (Last week's evacuation of 188,000 took > 70 hours.)
Simulation Shows Oroville Dam Spillway Failure http://www.capradio.org/90618
See Ward's models at https://websites.pmc.ucsc.edu/~ward/External Quote:a computer simulation by UC Santa Cruz research geophysicist Steven Ward shows flood waters would hit Highway 70 in about 30 minutes. In less than three hours, it would hit Highway 99. After 9 hours, it would fan out to cover a 231-square mile area.
Ward says it would be a massive wave near Oroville. The videos of the main spillway releasing 100,000 cubic feet per second pale in comparison.
"We've seen all week the videos of the regular spillway operating at full speed at about 100,000 cubic feet per second. This partial break is about 20 times that. It's going to overpower the dikes and levees for sure," says Ward.
Partial Failure – "3D" – of the Oroville Emergency Spillway
View attachment 24946
Partial Failure Oroville Emergency Spillway with Street Map
https://websites.pmc.ucsc.edu/~ward/oroville5.mov
View attachment 24947
Partial Failure Oroville Emergency Spillway - 9 hours
https://websites.pmc.ucsc.edu/~ward/oroville3.mov
View attachment 24949
Complete Failure Oroville Dam https://websites.pmc.ucsc.edu/~ward/oroville1.mov
Steven Ward posted a movie on the Banqiao Dam DisasterExternal Quote:"This one assumed a gap 600 (m) wide down to 25 meters below max reservoir level.
-25 m might be associated with depth to bedrock under the emergency spillway.
Might be extreme. Could try -20m or -10m or whatever."
=================
PS For parameters on his Partial Failure – "3D" – of the Oroville Emergency Spillway model, Steven Ward (personal communication) states:
Content from external source "This one assumed a gap 600 (m) wide down to 25 meters below max reservoir level.
-25 m might be associated with depth to bedrock under the emergency spillway.
Might be extreme. Could try -20m or -10m or whatever."[/ex]
My comments:
1) What's a little disconcerting to me is how many of the anchors look to have no damage at all to them, despite supposedly being embedded into the concrete poured above them and supposedly then having that concrete forceably stripped off of them by unreal forces. Someone with knowledge of concrete slab failure will have to enlighten us on how this is possible.
3) In browsing this photo, I believe I found the broken drain pipe for the next drain downstream. I circled this area in blue and enlarged it. The lateral location, the orientation, the shape and size of the object, and the position up and down the slope all support the idea that this might be a drain pipe that has turned the corner out beyond the far edge of the slab and is now heading downstream for the next drain exit. The next question this brings up...what is this pipe made of? These days, it's PVC. Back then? This picture and pictures elsewhere of the 90 degree elbow still attached to the sidewall indicate heavy material corrosion (looks like rust, especially for the 90 degree elbow). Would these pipes be heavily rusted, and therefore contributed to underslab erosion due to material failure?
Don Pedro might use its spillway again in a few days (first time since 1997):
https://ww2.kqed.org/science/2017/02/17/another-california-dam-grapples-with-flood-danger/
Shasta Pretty full too:External Quote:
Operators are releasing as much water as possible to make room for anticipated storm runoff. The lake level is hovering around 826 feet in elevation, close to the 830-foot maximum.
But with almost five inches of rain expected on Monday and Tuesday, officials say if the forecast pans out, they might need to open their "controlled spillway."
The last time the spillway was used in 1997, parts of Modesto were flooded.
http://www.redding.com/story/news/l...-ahead-north-state-braces-more-rain/98049690/
Basically the entire system is saturated, and other dams are being stressed.External Quote:
With more rain and runoff on its way, the U.S. Bureau of Reclamation is planning to hold water releases from Shasta Dam to about 64,000 cubic foot per second (cfs) through Saturday.
But It will begin reducing flows on Sunday to around 34,000 cfs due to the expected heavier rainfall Sunday night and into Monday.
After the storms pass, however, the river flows will be gradually increased back up to 79,000 cfs to make more room for future storms and runoff.
"Once they (the storms) clear out we will be increasing flows," Don Bader, the bureau's area manager, said Friday.
Lake Shasta was only six feet from the top of Shasta Dam on Monday when water releases were upped to 79,000 cfs and the lake, which is about 91 percent full, is now about 14.5 feet from the top of the dam, Bader said.
That emergency spillway scenario does not seem likely, or even possible. as it would require removal of both spillways all the way to the hill past the parking lot
View attachment 24954
The parking "spillway" is only a meter or so down to rock.
So really his simulation is pretty much a "worst case spillway collapse"
Thanks MickThat emergency spillway scenario does not seem likely, or even possible. as it would require removal of both spillways all the way to the hill past the parking lot
View attachment 24954
The parking "spillway" is only a meter or so down to rock.
So really his simulation is pretty much a "worst case spillway collapse"
Plus the changing pattern of rain vs. snow. We're seeing more significant rain events as a result of warming as opposed to snow ones. All of these dams were built--and have been operated--on the assumption the big pulse of water would be from snowmelt. That may not always be the case anymore.One concern I have, and perhaps it is a bit premature, is that I think they will have to rely on the emergency spillway as the primary "safeguard" for at least one rainy season, as the primary spillway is repaired or perhaps replaced (this is likely to be a significant project). I think the design bases for this scenario need to be looked at very closely, along with the apparent pattern of more "extreme" weather events (ie, the concept of 100 year floods now happening every 10 years (exact data/forecasts/probabilities to be provided by climatoligists)).
Once they get the power plant operating again, they can drain it down a long way in order to have significant capacity available in case of another storm. Obviously this will mean they don't have that water available for agriculture etc, but I bet they'll do everything they can to avoid any more use of the emergency spillway. They can only draw it down so far with the spillway, but it can go way lower with the power plant.One concern I have, and perhaps it is a bit premature, is that I think they will have to rely on the emergency spillway as the primary "safeguard" for at least one rainy season, as the primary spillway is repaired or perhaps replaced (this is likely to be a significant project). I think the design bases for this scenario need to be looked at very closely, along with the apparent pattern of more "extreme" weather events (ie, the concept of 100 year floods now happening every 10 years (exact data/forecasts/probabilities to be provided by climatoligists)).
My understanding is that the worst case flood scenario is a long heavy snowstorm depositing lots of snow down to relatively low elevations, followed by a tropical storm with heavy rain up to high elevations. That's essentially what happened in 1862.Plus the changing pattern of rain vs. snow. We're seeing more significant rain events as a result of warming as opposed to snow ones. All of these dams were built--and have been operated--on the assumption the big pulse of water would be from snowmelt. That may not always be the case anymore.
Good points. Can they draw it down low enough so that they can get though a rainy season without any expectation of using/needing any spillway? Perhaps someone has already crunched the numbers? And they won't be generating a lot of power with levels down that low, but I agree that is a secondary concern...Once they get the power plant operating again, they can drain it down a long way in order to have significant capacity available in case of another storm. Obviously this will mean they don't have that water available for agriculture etc, but I bet they'll do everything they can to avoid any more use of the emergency spillway. They can only draw it down so far with the spillway, but it can go way lower with the power plant.
My understanding is that the worst case flood scenario is a long heavy snowstorm depositing lots of snow down to relatively low elevations, followed by a tropical storm with heavy rain up to high elevations. That's essentially what happened in 1862.
It would certainly erode in places, as seen by the current erosion. But it's far more likely in the short term a notch would form and deepen rather than 600m off hillside neatly shearing off to 25m.Thanks Mick
How good is that "rock"? From the erosion following the emergency spillway overflow, it seemed very broken with numerous cracks and faults. What confidence can we have that that "rock" is reliable? Have there been any deep core samples taken?
Good points. Can they draw it down low enough so that they can get though a rainy season without any expectation of using/needing any spillway? Perhaps someone has already crunched the numbers? And they won't be generating a lot of power with levels down that low, but I agree that is a secondary concern...
I suspect they'll spend quite a bit more money than they otherwise would in order to get the repair done during a dry season. Add in use of the power plant at 100% 24/7 and I suspect they'll be ok without spillway use. Obviously there's some luck involved.Good points. Can they draw it down low enough so that they can get though a rainy season without any expectation of using/needing any spillway? Perhaps someone has already crunched the numbers? And they won't be generating a lot of power with levels down that low, but I agree that is a secondary concern...
This is unrelated to the Oroville situation (other than it being from lots of rain). Maxwell gets its water from the hills to the West. However due to the proximity people might get confused.External Quote:
COLUSA COUNTY — The town of Maxwell is being evacuated due to flooding in the area.
Residents are being relocated to Williams.
Question for the civil engineers - can this type of failure be modeled with open channel flow simulation software (if there is such software out there)? The objective would be to calculate dynamic and static forces on the concrete weir, all for a given range of V notch sizes/flows? Is there any way that the end of the weir could could be pushed aside, if one end were to be bypassed and a V notch formed? Or is the weir too massive to be pushed aside or pushed forward by any foreseeable flow?It would certainly erode in places, as seen by the current erosion. But it's far more likely in the short term a notch would form and deepen rather than 600m off hillside neatly shearing off to 25m.
Is there any way that the end of the weir could could be pushed aside, if one end were to be bypassed and a V notch formed? Or is the weir too massive to be pushed aside or pushed forward by any foreseeable flow?
One concern I have, and perhaps it is a bit premature, is that I think they will have to rely on the emergency spillway as the primary "safeguard" for at least one rainy season, as the primary spillway is repaired or perhaps replaced (this is likely to be a significant project).
In my opinion, a competent engineer or manager would not rely on the emergency spillway for reservoir control. This structure exists primarily for dam safety based on the designs we have seen documented previously. The lack of flow management and its high spill-over height (901') make it poorly suited for flow control and reservoir management use.
Were I charged to resolve this problem, I would determine how far back towards the flood control structure gates I needed to cut back the existing structure to reach a stable transition point and then begin construction down the slope towards the river. If I were unable to complete the entire spillway in the given time, I would include a sacrificial edge structure at the terminus of the new work.
I don't believe it would be unreasonable to expect that the remaining lower section is quite stable given the levels of erosion and hydraulic wear it has been subjected to during this event. Also, it would appear that the area to the SouthEast of the flow dispersal section has been worn down to stable bedrock based on the lack of additional deposits in front of the washout.
The "sacrificial" section mentioned above could be constructed to direct the flow into this existing - though recently created - channel for the 2017/18 season. I would then complete the remainder of the lower section replacement during the 2018 summer season and also work any additional replacements or modifications on the upper spillway channel that has thus far not been impacted by this event.
Given the strong possibility that the drain system in conjunction with flow related damage created the failure, I would not be comfortable retaining any of the existing drainage system within the spillway system - I would choose to replace it all with a system meeting current standards. This drainage improvement, along with more modern water incursion prevention at the control joints would likely provide a significant improvement in the amount of water moving below the spillway structure.
If you look carefully at the detail in the upper right hand corner, it indicates that the anchors are at 10' centers each way.