Here is my current hypothesis of the conditions and events that led to this situation. All just speculation based on preliminary evidence and vaguely legitimate looking links to documents that seem complicated enough to be government agency public policy.
I suspect long term seepage during years of operation combined with geologic conditions, weaker chemically weathered rock ether from ancient hydrothermal venting, intrusion of geothermal features during a later time period, or recent weathering from groundwater intrusion, caused the undermining of the main spillway.
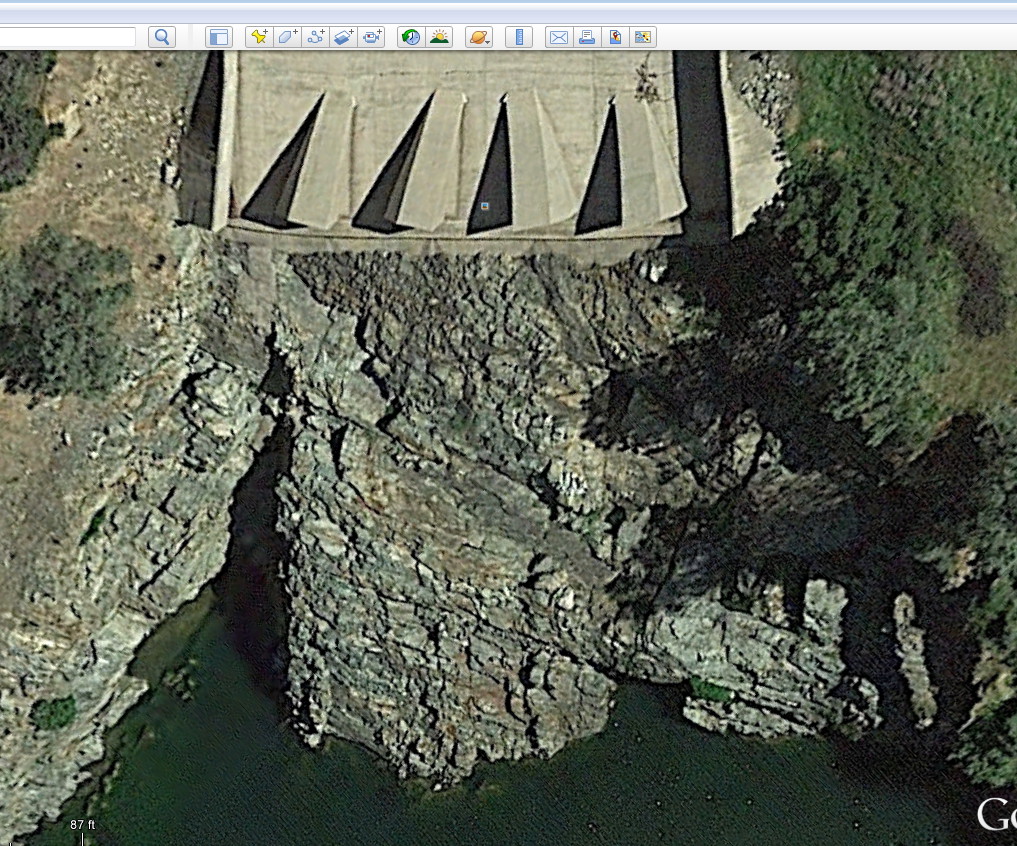
I believe the drain system under the main spillway is in question and likely contributed to the event. My reasoning is influenced by photographic evidence presented on MetaBunk of the drains not functioning in key areas, as well as descriptions of spillway failures in the Bureau of Reclamation dam spillway design document
here (PDF page 105-106, document page 3-88 3-89).
I suspect 'Stagnation Pressure' as described by the Bureau of Reclamation,
External Quote:
Stagnation pressure refers to two conditions that can result in damage and/or failure of the spillway: (1) High velocity, high pressure flows enter cracks or open joints in the spillway flow surface (such as a chute), which results in uplift pressure that lifts (displaces) portions of the spillway conveyance feature; and (2) High velocity, high pressure flows enter the foundation through cracks or open joints in the spillway flow surface, which results in internal erosion of the foundation and loss of support of portions of the spillway conveyance feature [26].
is the accelerator of the failure, with the underlying geologic conditions initiating the erosion under the spillway.
A likely series of events I conceptualize is as follows:
Long term seepage caused weaker rock to slump, causing cracks and gaps and slight height variations in some of the spillway concrete slabs. Thermal changes caused normal expansion and contraction but the underlying geology caused slabs to shift slightly vertically during these.
Water was able to create a high pressure flow under the spillway through a gap and even a minor a height offset of spillway concrete slabs.
For some unknown reason the drainage pipes failed in the area eroded by stagnation pressure and caused further erosion of the sections those pipes served. I believe this is the real culprit that caused a large area to fail instead of just a disruption of flow and a small spout that would indicate a problem to be fixed by the DWR. I suspect DWR expected to see the edge of a slab fail and cause a minor spouting or surface wave which they could keep running for a time with and then fix, not whole sections of the spillway floor to drop away.
The unsupported floor of the spillway failed to support the water pressure as the water drops from the flatter portion to the steeper portion of the spillway and collapsed.
After that point it's all on video, so I will stop speculating there.
I reserve the right to change my mind! But that's the way it's looking from this perspective as of now.