Aluminum in the United States, Prevalence in Soil and Water

MikeG

Senior Member.
Greetings all,

I am a new entry into the world of chemtrails. Metabunk has been extremely helpful in understanding the many facets of this particular conspiracy theory, from natural cloud formations, to aircraft engines, to the existence of various elements (e.g., aluminum) claimed to be part of the ongoing aerial spraying campaign, etc.

Rather than get bogged down in a Gish Gallop over every element in the chemtrail universe, I decided to focus on aluminum. It appears in every part of the conspiracy theory from its “dispersal” from aircraft, to its presence on the ground and in water, to its alleged (and false) links with a number of contemporary medical problems.

I also decided to develop a deeper understanding of this one element because I believe that depth should be an important part of any discussion with a chemtrail believer.

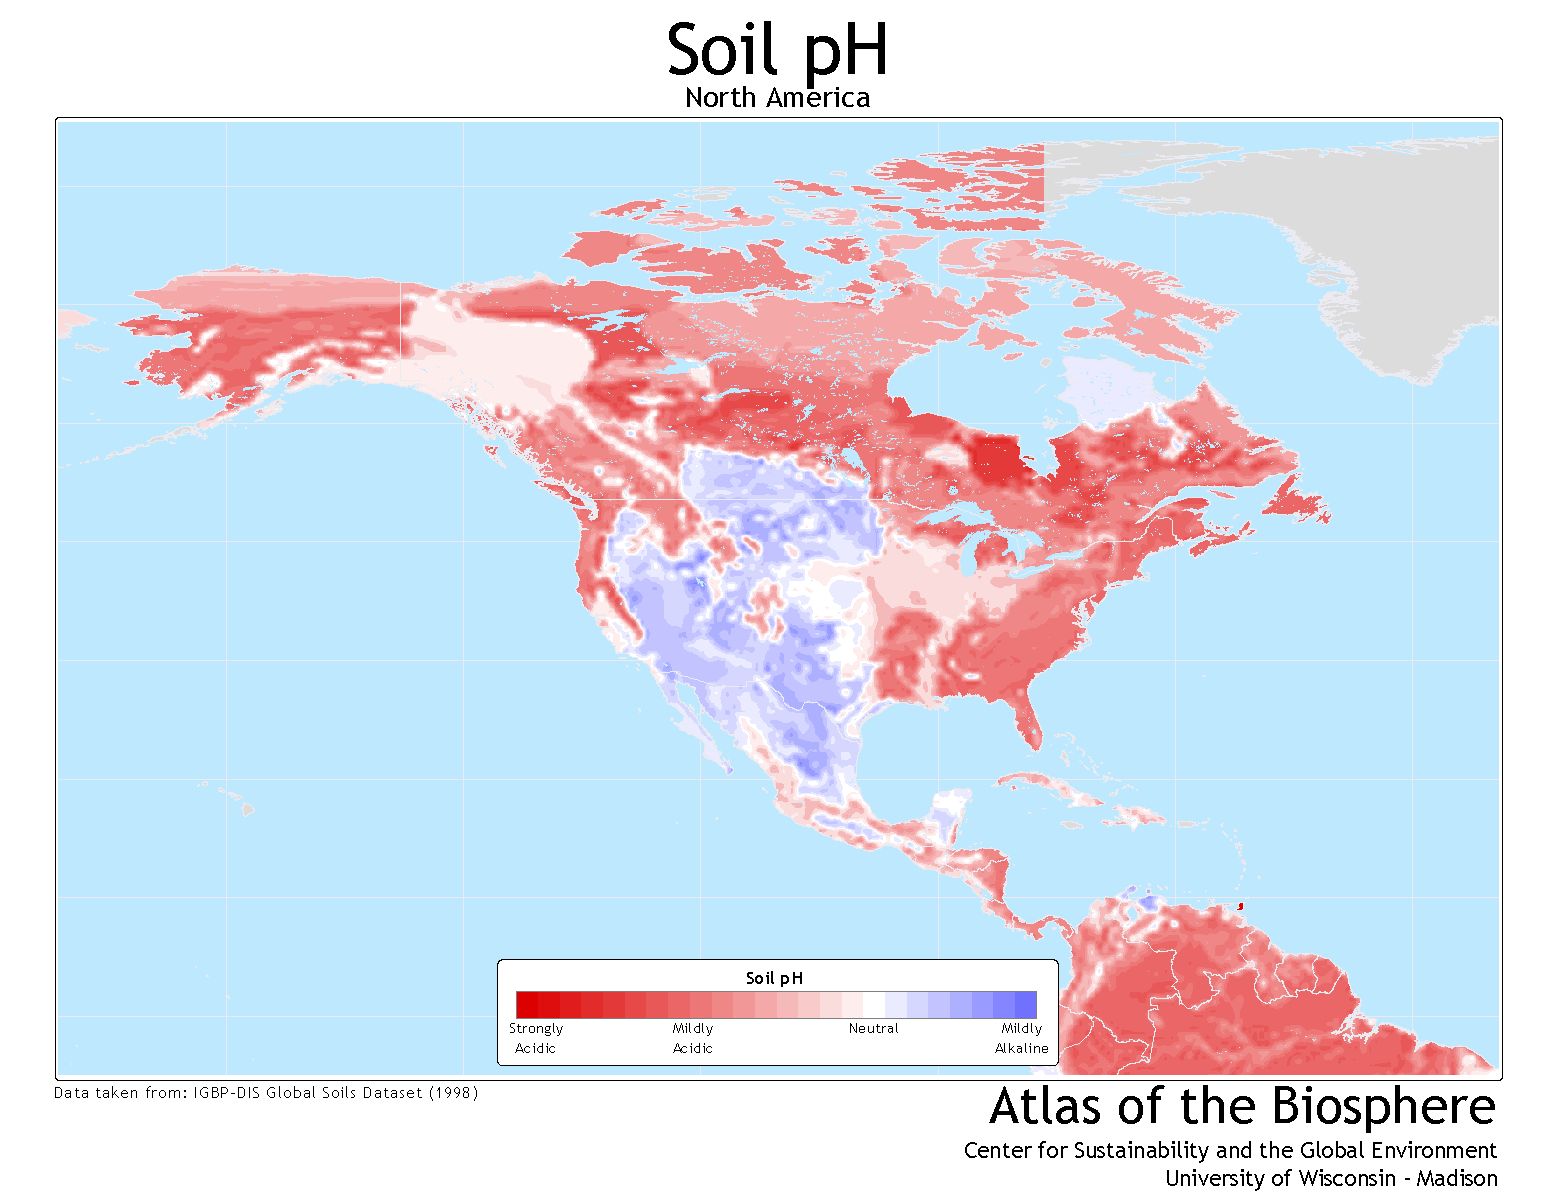
To that end, I am asking for help, specifically sources on the presence of aluminum in the United States and, if possible, the Mid-Atlantic region where I live. More specifically, I can use information on aluminum in the soil, water, snow, and rainfall.

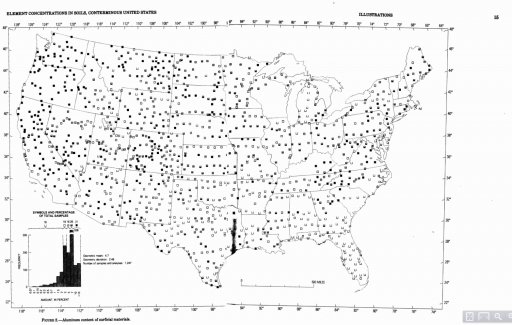
Mick West has already provided a few excellent references. For example, the USGS publication, Geochemical and Mineralogical Maps for Soils of the Coterminous United States (2014) is a great source of data and illustrations.

https://pubs.usgs.gov/sir/2017/5118/sir20175118_element.php?el=13


20160817-132214-t4dwg.jpg

To that, I have added few good documents from the EPA, ATSDR, the U.S. Department of Health and Human Services, and a number of state environmental protection agencies.


What I am looking for are sources similar to a chart from the Canadian Journal of Earth Sciences that appeared in an earlier thread.

https://www.metabunk.org/threads/chemical-composition-of-rain-and-snow-aluminum-barium-etc.135/

If anyone can offer links, documents, or advice, I would appreciate it.


Thanks,


MikeD
 
Last edited by a moderator:
Aluminium isn' a problem in soil unless the soil is acidic enough to dissolve some of its molecular bonds with other elements, creating Al+++ ions - it is these that are toxic to plants.

That's a bit of a different topic though, I think what MikeG is looking for is evidence of how much Aluminum would reasonably be expected to be found in soil samples (and, by extension, air and water) in various parts of the US.

Although it's also important to be able to distinguish what type of tests are being referred to. Al+++ (aka Al3+, or ionic aluminum) is sometime mentioned. Since Al3+ is found in incredibly small amounts, it's an easy mistake to compare expected Al3+ amounts with tests for regular aluminum.

And of course, the aluminum found in the (non Al3+) tests is not a metal, it's an oxide or silicate. So you have to keep that in mind when interpreting results.
 
Just so that I'm clear.. @MikeG is looking for a baseline of aluminum to start with so that a comparison can be made between what SHOULD be there naturally in order to determine whether or not extra aluminium is being added to the environment by chemtrails... does that sound about right?

If thats the case, would it then also be prudent to also obtain that data from prior to 1990ish since thats when all this spraying and chemtrailing supposedly began? The only reason I ask is because the same types of statements were made back in the 60s and 70s when the lead problem was being looked into. There were the papers and testimonies of guys like Robert Kehoe promoting lead as safe and that the amounts found in the environment were "normal and natural." It took several decades and a LOT of work from guys like Claire Patterson to undo the damage done by Kenhoe, and the lead industry as a whole, so that lead could be banned.

I bring this up, because the conspiracy seems to be that big corporations and big brother are behind all of this chemtrailing, and saying that the aluminum that's found right now is "normal" parallels the story that Kenhoe was pushing for the lead industry which was accepted by the vast majority of the public (and even the government) to be true. It plays right into the narrative and paranoia shown by chemtrail believers. My question would be, where would be a good place to start looking for baselines on both fronts.. amounts prior to the start of the chemtrail stuff and what's found today so that a good comparison can be made between the two.. would make doing the math a lot easier.

This report is from 1984, and quotes earlier data back to 1959: http://pubs.usgs.gov/pp/1270/pdf/PP1270_508.pdf

upload_2015-4-7_22-19-46.png

Note the "Range" figure, which appears incorrect. It seems to have been corrected from "700 - <10,000" to "700 - >10,000", but this must still be wrong if the Average is 72,000. Perhaps it should be >100,000?


Later in the same report: note that this is in percent (1% = 10,000 ppm).

upload_2015-4-7_22-23-53.png

This would suggest a range of 5,000 to >100,000ppm for the west, and 7,000 to >100,000ppm for the east.
 
Last edited:
This report is from 1984, and quotes earlier data back to 1959: http://pubs.usgs.gov/pp/1270/pdf/PP1270_508.pdf

upload_2015-4-7_22-19-46.png

I'm not quite sure what the "Range" figure should be. It seems to have been corrected from "700 - <10,000" to "700 - >10,000", but this must still be wrong if the Average is 72,000. Perhaps it should be >100,000?

That report also has a map showing the variation across the country, which matches the more modern map:


It's a little hard to read, but they use differently filled squares to represent different ranges of the histogram in the lower left. So a lot of California is the solid black square (10% or higher), but Florida is all the U shape (2% or less)
 

Attachments

  • upload_2015-4-7_14-22-48.png
    upload_2015-4-7_14-22-48.png
    458.6 KB · Views: 481
That's a bit of a different topic though, I think what MikeG is looking for is evidence of how much Aluminum would reasonably be expected to be found in soil samples (and, by extension, air and water) in various parts of the US.

Although it's also important to be able to distinguish what type of tests are being referred to. Al+++ (aka Al3+, or ionic aluminum) is sometime mentioned. Since Al3+ is found in incredibly small amounts, it's an easy mistake to compare expected Al3+ amounts with tests for regular aluminum.

And of course, the aluminum found in the (non Al3+) tests is not a metal, it's an oxide or silicate. So you have to keep that in mind when interpreting results.

That is correct. I am attempting to present a documented explanation for the presence of aluminum in the U.S. in the soil, air and water.
 
Just so that I'm clear.. @MikeG is looking for a baseline of aluminum to start with so that a comparison can be made between what SHOULD be there naturally in order to determine whether or not extra aluminium is being added to the environment by chemtrails... does that sound about right?

If thats the case, would it then also be prudent to also obtain that data from prior to 1990ish since thats when all this spraying and chemtrailing supposedly began? The only reason I ask is because the same types of statements were made back in the 60s and 70s when the lead problem was being looked into. There were the papers and testimonies of guys like Robert Kehoe promoting lead as safe and that the amounts found in the environment were "normal and natural." It took several decades and a LOT of work from guys like Claire Patterson to undo the damage done by Kenhoe, and the lead industry as a whole, so that lead could be banned.

I bring this up, because the conspiracy seems to be that big corporations and big brother are behind all of this chemtrailing, and saying that the aluminum that's found right now is "normal" parallels the story that Kenhoe was pushing for the lead industry which was accepted by the vast majority of the public (and even the government) to be true. It plays right into the narrative and paranoia shown by chemtrail believers. My question would be, where would be a good place to start looking for baselines on both fronts.. amounts prior to the start of the chemtrail stuff and what's found today so that a good comparison can be made between the two.. would make doing the math a lot easier.

I don't subscribe to chemtrail conspiracy theory at all.

I do think that data from the pre-1990 era is useful as would be contemporary data. The fact that there is likely some consistency between the past and present is important to debunk the aluminum claims made by Wigington, et al.
 
That report also has a map showing the variation across the country, which matches the more modern map:


It's a little hard to read, but they use differently filled squares to represent different ranges of the histogram in the lower left. So a lot of California is the solid black square (10% or higher), but Florida is all the U shape (2% or less)
These are both excellent. Thank you.
 
Just an idea, I'm not an expert, but I know that areas of permanent snow or ice cover build up layer by layer, year on year preserve a snap shot of the atmospheric conditions for that year.. So a core sample of such an ice layer going down from the present day surface through the mid ninety's and beyond should, in theory at least give a range a of samples that could be tested for year on year results. Now this wouldn't give complete coverage across the whole country, but samples from glaciers in Alaska, Washington, Oregon, California, Nevada, Colorado, Montana, Wyoming and Utah; may be compared with samples from other parts of the world, The Alps and Urals etc in Europe, The High Andes in South America, etc, could, if sampled under controlled conditions, and compared to base line soil samples in the area could either help lay the atmospheric aluminum claims to bed once and for all, or provide the smoking gun chem trailers have been looking for.

After all if after 1995 there is a huge jump in the aluminum content of the samples then we may have evidence of chemtrailing, but if, as I suspect the Al content remains fairly consistent through and before 1995 and maybe even back before the age of mass air travel, then we know the Al claims are bunk.

Now I know such a survey would neither be cheap or easy, and great care would have to be taken controlling how the cores were taken, stored and analyzed, but I think it could work.

Just an idea.
 
Last edited:
I don't subscribe to chemtrail conspiracy theory at all.

I do think that data from the pre-1990 era is useful as would be contemporary data. The fact that there is likely some consistency between the past and present is important to debunk the aluminum claims made by Wigington, et al.


I agree with you completely, and if I came across as suggesting that you did buy into the chem meme then I offer my sincere apologies.. the questions I was asking was more for clarification and for my own understanding of what you were looking for and then expounding on the what if angles.. thats why I mentioned pre-1990s info since that seems to be the magic decade all this started, which is odd because thats when the internet started getting popular. I wonder if they're related some how (dry british style comedic sarcasm there).
 
Just an idea, I'm not an expert, but I know that areas of permanent snow or ice cover build up layer by layer, year on year preserve a snap shot of the atmospheric conditions for that year.. So a core sample of such an ice layer going down from the present day surface through the mid ninety's and beyond should, in theory at least give a range a of samples that could be tested for year on year results. Now this wouldn't give complete coverage across the whole country, but samples from glaciers in Alaska, Washington, Oregon, California, Nevada, Colorado, Montana, Wyoming and Utah; may be compared with samples from other parts of the world, The Alps and Urals etc in Europe, The High Andes in South America, etc, could, if sampled under controlled conditions, and compared to base line soil samples in the area could either help lay the atmospheric aluminum claims to bed once and for all, or provide the smoking gun chem trailers have been looking for.

After all if after 1995 there is a huge jump in the aluminum content of the samples then we may have evidence of chemtrailing, but if, as I suspect the Al content remains fairly consistent through and before 1995 and maybe even back before the age of mass air travel, then we know the Al claims are bunk.

Now I know such a survey would neither be cheap or easy, and great care would have to be taken controlling how the cores were taken, stored and analyzed, but I think it could work.

Just an idea.

Great minds....
https://www.metabunk.org/threads/wi...how-up-in-varves-ice-cores-or-tree-rings.743/
 
I agree with you completely, and if I came across as suggesting that you did buy into the chem meme then I offer my sincere apologies.. the questions I was asking was more for clarification and for my own understanding of what you were looking for and then expounding on the what if angles.. thats why I mentioned pre-1990s info since that seems to be the magic decade all this started, which is odd because thats when the internet started getting popular. I wonder if they're related some how (dry british style comedic sarcasm there).

No apology necessary. There are times when I have seen these discussions go off the rails over simple misunderstandings.

To your point, I agree that a range of sources over time is a good approach, perhaps simply to demonstrate consistency in the findings.

I am attaching a 2008 US Department of Health and Human Services "Toxicological Profile for Aluminum" that I unearthed recently. It is very useful, however, much of its references are very old. Page 197 cites studies of Aluminum in snow and rainwater which are exactly what I am researching. However, these studies are all in the sixties and early seventies.

Similarly, a table on aluminum concentration in water offers an interesting comparison of individual US states, but the source is from 1989.

Al in Drinking Water by State.jpg

I think that linking together a chain of consistent sourcing on the subject is a good approach. That said, information from all parts of the timeline would be a great help.
 

Attachments

  • Toxicological Profile for Aluminum.pdf
    6.1 MB · Views: 1,002
What do you do with the chemtrail believers who have already modified the story to claim that the "spraying" has been going on much longer? They started doing that some time ago when all the old contrail pics started being shown. When the various beginning-belief-factions are questioned about the contradictory claims, they just don't answer.
 
What do you do with the chemtrail believers who have already modified the story to claim that the "spraying" has been going on much longer? They started doing that some time ago when all the old contrail pics started being shown. When the various beginning-belief-factions are questioned about the contradictory claims, they just don't answer.
I just point out how the story and time line changes over the years. For example when I first came across the whole chemtrail thing it was late 90's / early 2000's when chemtrails were population control to cull us all, then it was mind control to make everyone compliant, then weather warfare and HAARP and now geo-engineering. When you point out how often the claims and conspiracy changes and how their time line is constantly being changed to match the latest conspiracy whilst the scientific and evidence based debunking has stayed constant, it causes confusion and fluster.
 
What do you do with the chemtrail believers who have already modified the story to claim that the "spraying" has been going on much longer? They started doing that some time ago when all the old contrail pics started being shown. When the various beginning-belief-factions are questioned about the contradictory claims, they just don't answer.
well since no one remembers seeing contrails when they were young, obviously they weren't spraying :p
 
I may be redundant in posting this as this info might be embedded with other links provided above--but it might be helpful to explain how one would know what is a 'natural baseline' for various metals in the soil. (this article is from the 1960's--the introduction kind of explains it). Maybe there is a better and clearer explanation on how baselines are determined to begin with--but here FWIW


COLLECTION AND ANALYSIS OF GEOCHEMICAL DATA SAMPLING PLAN The sampling plan was designed with the emphasis on practicality, in keeping with the expenditures of time and funds available, and its variance from an ideal plan has been recognized from the beginning. Because the collection of most samples was, by necessity, incidental to other duties of the samplers, the instructions for sampling were simplified as much as possible, so that sampling methods would be consistent within the wide range of kinds of sites to be sampled. The samples were collected by U.S. Geological Survey personnel along their routes of travel to areas of other types of field studies or within their project areas. The locations of the routes that were sampled depended on both the network of roads that existed and the destinations of the samplers.

Sampling intensity was kept at a minimum by selecting only one sampling site every 80 krn (about 50 miles; selected for convenience because vehicle odometers were calibrated in miles) along the routes. The specific sampling sites were selected, insofar as possible, that had surficial materials that were very little altered from their natural condition and that supported native plants suitable for sampling. In practice, this site selection necessitated sampling away from roadcuts and fills. In some areas, only cultivated fields and plants were available for sampling. Contamination of the sampling sites by vehicular emissions was seemingly insignificant, even though many sites were within 100 m or less of the roads.

Collecting samples at about 20 cm depth, rather than at the upper soil horizons, may have avoided the effects of surface contamination on the samples. However, we had no adequate way of measuring any contamination that may have occurred. (See Cannon and Bowles, 1962.) Many of the sampled routes had only light vehicular traffic, and some were new interstate highways. Routes through congested areas generally were not sampled; therefore, no gross contamination of the samples was expected.

The study areas that were sampled follow: Wisconsin and parts of contiguous States, southeastern Missouri, Georgia, and Kentucky, sampled by Shacklette; Kentucky, sampled by J. J. Connor and R. R. Tidball; Nevada, New Mexico, and Maryland, sampled by H. L. Cannon; various locations in Arizona, Colorado, Montana, New Mexico, Utah, and Wyoming, sampled by F. A. Branson and R. F. Miller; Missouri, sampled by Shacklette, J. A. Erdman, J. R. Keith, and R. R. Tidball; and various locations in Colorado, Idaho, Montana, South Dakota, Utah, and Wyoming, sampled by A. T. Miesch and J. J. Connor. Sampling techniques used in these areas varied according to the primary objectives of the studies being conducted, but generally these techniques were closely similar to the methods used in sampling along the roads.

In general, the sampling within study areas was more intensive than that along the travel routes. To make the sampling intensity of the two sampling programs more nearly equal, only the samples from selected sites in the study areas were used for this report. The selected sites were approximately 80 km apart. Where two or more samples were collected from one site, they were assigned numbers, and one of these samples was randomly chosen for evaluation in this study.

SAMPLING MEDIA

The material sampled at most sites could be termed "soil" because it was a mixture of comminuted rock and organic matter, it supported ordinary land plants, and it doubtless contained a rich microbiota. Some of the sampled deposits, however, were not soils as defined above, but were other kinds of regoliths. The regoliths included desert sands, sand dunes, some loess deposits, and beach and alluvial deposits that contained little or no visible organic matter. In some places the distinctions between soils and other regoliths are vague because the materials of the deposits are transitional between the two.

Samples were collected from a few deposits consisting mostly of organic materials that would ordinarily be classified as peat, rather than soil. To unify sampling techniques, the samplers were asked to collect the samples at a depth of approximately 20 cm below the surface of the deposits. This depth was chosen as our estimate of a depth below the plow zone that would include parts of the zone of illuviation in most welldeveloped zonal soils, and as a convenient depth for sampling other surficial materials. Where the thickness of the material was less than 20 cm, as in shallow soils over bedrock or in lithosols over large rock fragments, samples were taken of the material that lay iust above the rock deposits. About 0.25 liter of this material was collected, put in a kraft paper envelope, and shipped to the US. Geological Survey laboratories in Denver, Colo.

CHEMICAL-ANALYSIS PROCEDURES

The soil samples were oven dried in the laboratory and then sifted through a 2-mm sieve. If the soil material would not pass this sieve, the sample was pulverized in a ceramic mill before serving. Finally, the sifted, minus 2-mm fraction of the sample was used for analysis. The methods of analysis used for some elements were changed during the course of this study, as new techniques and instruments became available. For most elements, the results published in the first report (Shacklette, Hamilton, and others, 1971) were obtained by use of a semiquantitative six-step emission spectrographic method (Meyers and others, 1961). The methods used for other elements were: EDTA titration for calcium; colorimetric (Ward and others, 1963) for phosphorus and zinc; and flame photometry for potassium. Many of the elements analyzed in the 355 samples collected in phase two of the study were also analyzed by the emission spectrographic method (Neirnan, 1976). Other methods were used for the following elements: flame atomic absorption (Huffman and Dinnin, 1976) for mercury, lithium, magnesium, sodium, rubidium, and zinc; flameless atomic absorption (Vaughn, 1967) for mercury; X-ray fluorescence spectrometry (Wahlberg, 1976) for calcium, germanium, iron, potassium, selenium, silver, sulfur, and titanium; combustion (Huffman and Dinnin, 1976) for total carbon; and neutron activation (Millard, 1975, 1976) for thorium and uranium.
Content from External Source
 

Attachments

  • PP1270_508.pdf
    3.6 MB · Views: 866
Last edited by a moderator:
What do you do with the chemtrail believers who have already modified the story to claim that the "spraying" has been going on much longer? They started doing that some time ago when all the old contrail pics started being shown. When the various beginning-belief-factions are questioned about the contradictory claims, they just don't answer.

I think tagging aluminum to the claim helps. Chemtrail believers like to cite patents as "proof" of their belief in ongoing spraying. For example:

http://www.geoengineeringwatch.org/links-to-geoengineering-patents/

However, it is important to point out that aluminum practically never appears in these patents. One cited on the geoengineeringwatch.org website is from 2007, which again breaks their timeline.

Just a thought.

Right, but my point is, they have already broken their OWN timeline (but don't seem to notice). A bunch of them no longer subscribe to the idea that it all started in the mid 90s, so aluminum found in tests before that falls on deaf ears.
 
Last edited:
Back
Top