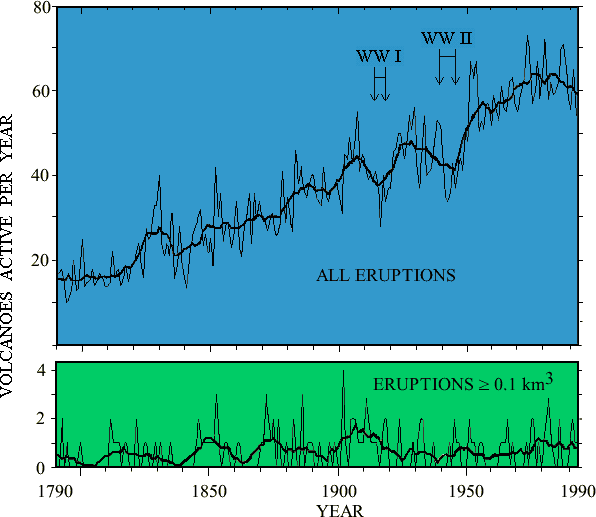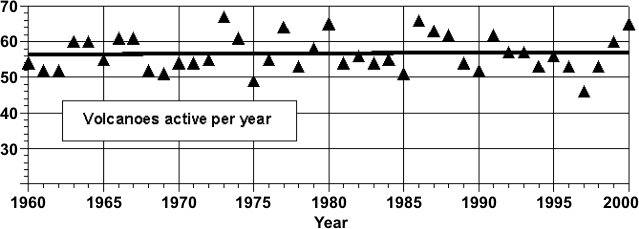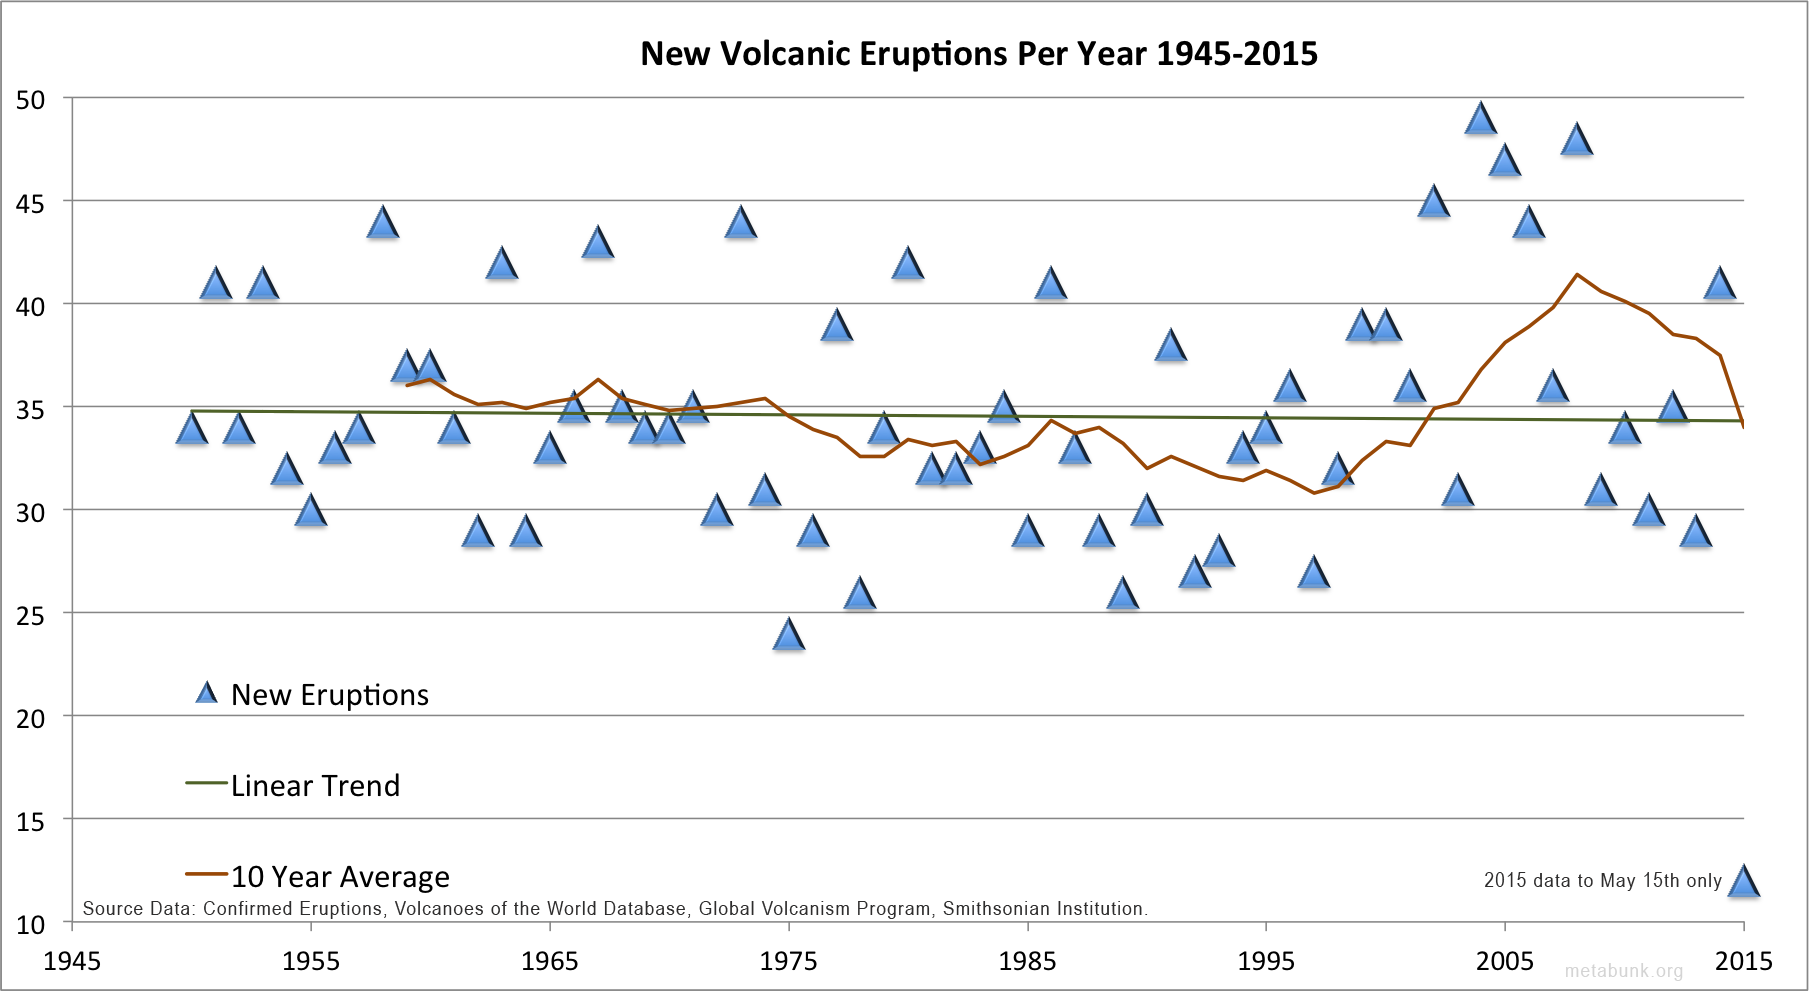
The above chart is based on data from the Smithsonian Institution's Global Volcanism Program (GVP_ database of eruptions, it's a count of all the eruptions that started in each year, from 1945 to 2015. It shows about 35 new eruptions per year, but with a lot of variation from about 25 to 50 per year. The trend over the full period is basically flat, and while there was a slight increase on average from about 1997 to 2008, this is balanced by a decline in recent years.
This year, 2015, shows only 12 eruptions so far, if it continues at that rate we will have about 33 this year, a bit below average. The 12 confirmed eruptions are:
- Tara, Batu
- Tungurahua
- Ubinas
- Turrialba
- Turrialba
- Chikurachki
- Fournaise, Piton de la
- San Miguel
- Karymsky
- Pacaya
- Soputan
- Klyuchevskoy
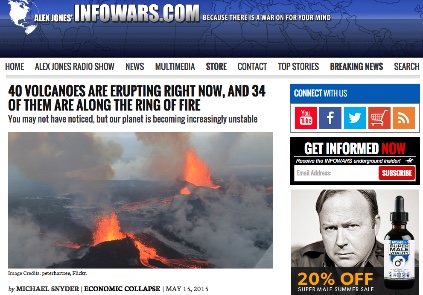
http://www.infowars.com/40-volcanoe...ow-and-34-of-them-are-along-the-ring-of-fire/
Why is he saying there are 40 Volcanoes erupting right now, when the Smithsonian only lists 12 confirmed new eruptions so far?
40 VOLCANOES ARE ERUPTING RIGHT NOW, AND 34 OF THEM ARE ALONG THE RING OF FIRE
You may not have noticed, but our planet is becoming increasingly unstable
by MICHAEL SNYDER | ECONOMIC COLLAPSE | MAY 15, 2015
You may not have noticed, but our planet is becoming increasingly unstable. According to Volcano Discovery, 40 volcanoes around the globe are erupting right now, and only 6 of them are not along the Ring of Fire. If that sounds like a very high number to you, that is because it is a very high number. As I have written about previously, there were a total of 3,542 volcanic eruptions during the entire 20th century. When you divide that number by 100, that gives you an average of about 35 volcanic eruptions per year. So the number of volcanoes that are erupting right now is well above the 20th century’s average for an entire calendar year.
The problem is that Snyder is comparing two very different things. "Eruptions per year, as counted by the Smithsonian's GVP" is not the same thing as "erupting right now, according to Volcano Discovery". He's comparing one measurement against a different measurement. His historical figures are actually accurate, as they use the same Smithsonian data. There were actually 35 per year, on average, from 1900 to 1999. But if you actually look at the most recent data from the same source then the average has actually dropped a bit, to 33 (from 1945 to 2015), and has been declining in recent years.
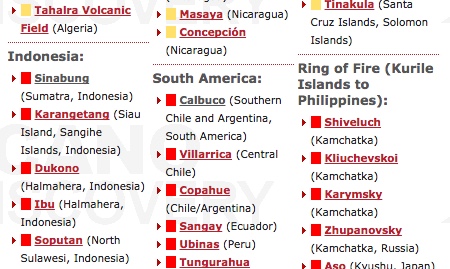
So what is this "40 volcanoes around the globe are erupting right now"? The figure comes from Volcano Discovery, a volcano tourism site that maintains a list of where there is volcanic activity, so people interested in visiting volcanos can find active volcanos. Volcano Discovery lists volcanoes that are either "erupting" (marked in red), or in a state of "unrest" (yellow), like this:
The difference here seems to be that the two sources have a different cut-off criteria for what constitutes an "eruption". The Smithsonian GVP notes:
Whereas Volcano Discovery seems to just include any report of activity that might be of interest to a Volcano tourist, and also includes the "more than a dozen" volcanos that have continuous activity.
The Weekly Volcanic Activity Report does not necessarily include all volcanic activity that occurred on Earth during the week. More than a dozen volcanoes globally have displayed more-or-less continuous eruptive activity for decades or longer, and such routine activity is typically not reported here. Moreover, Earth's sea-floor volcanism is seldom reported even though in theory it represents the single most prolific source of erupted material. The Weekly Volcanic Activity Report summarizes volcanic activity that meets one or more of the following criteria:
- A volcano observatory raises or lowers the alert level at the volcano.
- A volcanic ash advisory has been released by a volcanic ash advisory center (VAAC) stating that an ash cloud has been produced from the volcano.
- A verifiable news report of new activity or a change in activity at the volcano has been issued.
- Observers have reported a significant change in volcanic activity. Such activity can include, but is not restricted to, pyroclastic flows, lahars, lava flows, dome collapse, or increased unrest.
When trying to determine if there has been a change, you have to compare like with like. If we look at the GVP data, we see no change. We can see that the GVP data is different to the VD data, but can we see if the VD data itself indicates any change? The VD data is from there page "What's Erupting", which has been operating in this form since January 2012, as can be seen on the Internet Archive:
https://web.archive.org/web/20120118231502/http://www.volcanodiscovery.com/erupting_volcanoes.html
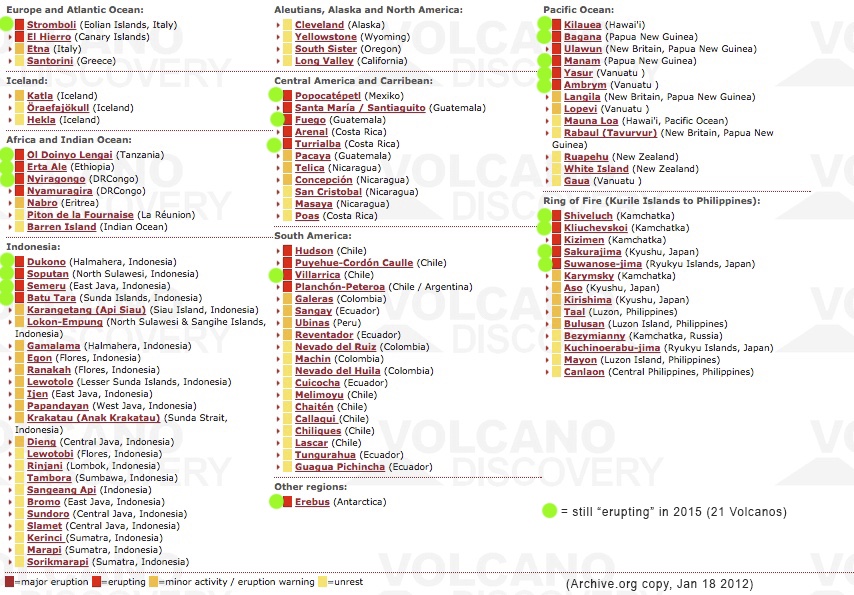
Which shows 31 erupting volcanoes, however 21 of them are volcanos that are still listed as "erupting" in May 2015 (I've marked them with green in the image above). If we then go forward to Jun 22 2014, we again have 31, but now 19 of them were listed in both 2012 and 2015.
There's not enough data to determine any trend from VD, but what we can say is that the majority of volcanoes that they list are not new activity at all, and are simply volcanoes that show some activity pretty much every year.
The bottom line - looking at the actual Smithsonian data shows no increase. The Volcano Discovery is a different data set aimed at tourists, which you can't directly compare with the Smithsonian. Even then, the VD data does not show an increase that not within normal variations.
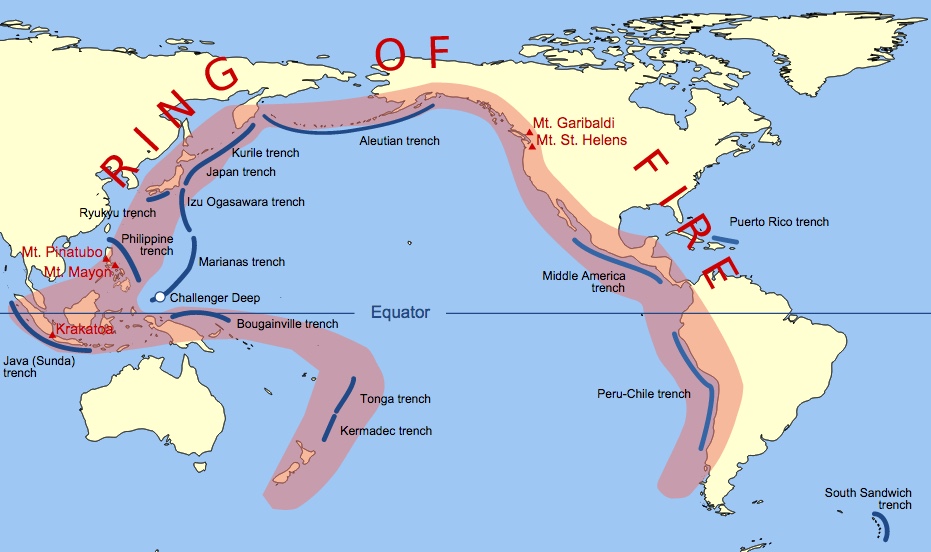
One final thing, Snyder says "34 of them are on the Ring of Fire". Well that's hardly surprising, seeing as the Ring of Fire spans the entire world, and contains 75% of the worlds active and dormant volcanoes.
Link to raw Smithsonian data: https://www.metabunk.org/sk/GVP_Eruption_Results.xls (38MB file)
Last edited: