Simulating Atmospheric Refraction

Mick West

Administrator
Staff member
Metabunk 2019-01-24 16-58-50.jpg
This is the discussion thread for the Metabunk Refraction Simulator (previously called the mirage simulator), which you can see at:
https://www.metabunk.org/refraction/

How to use it:

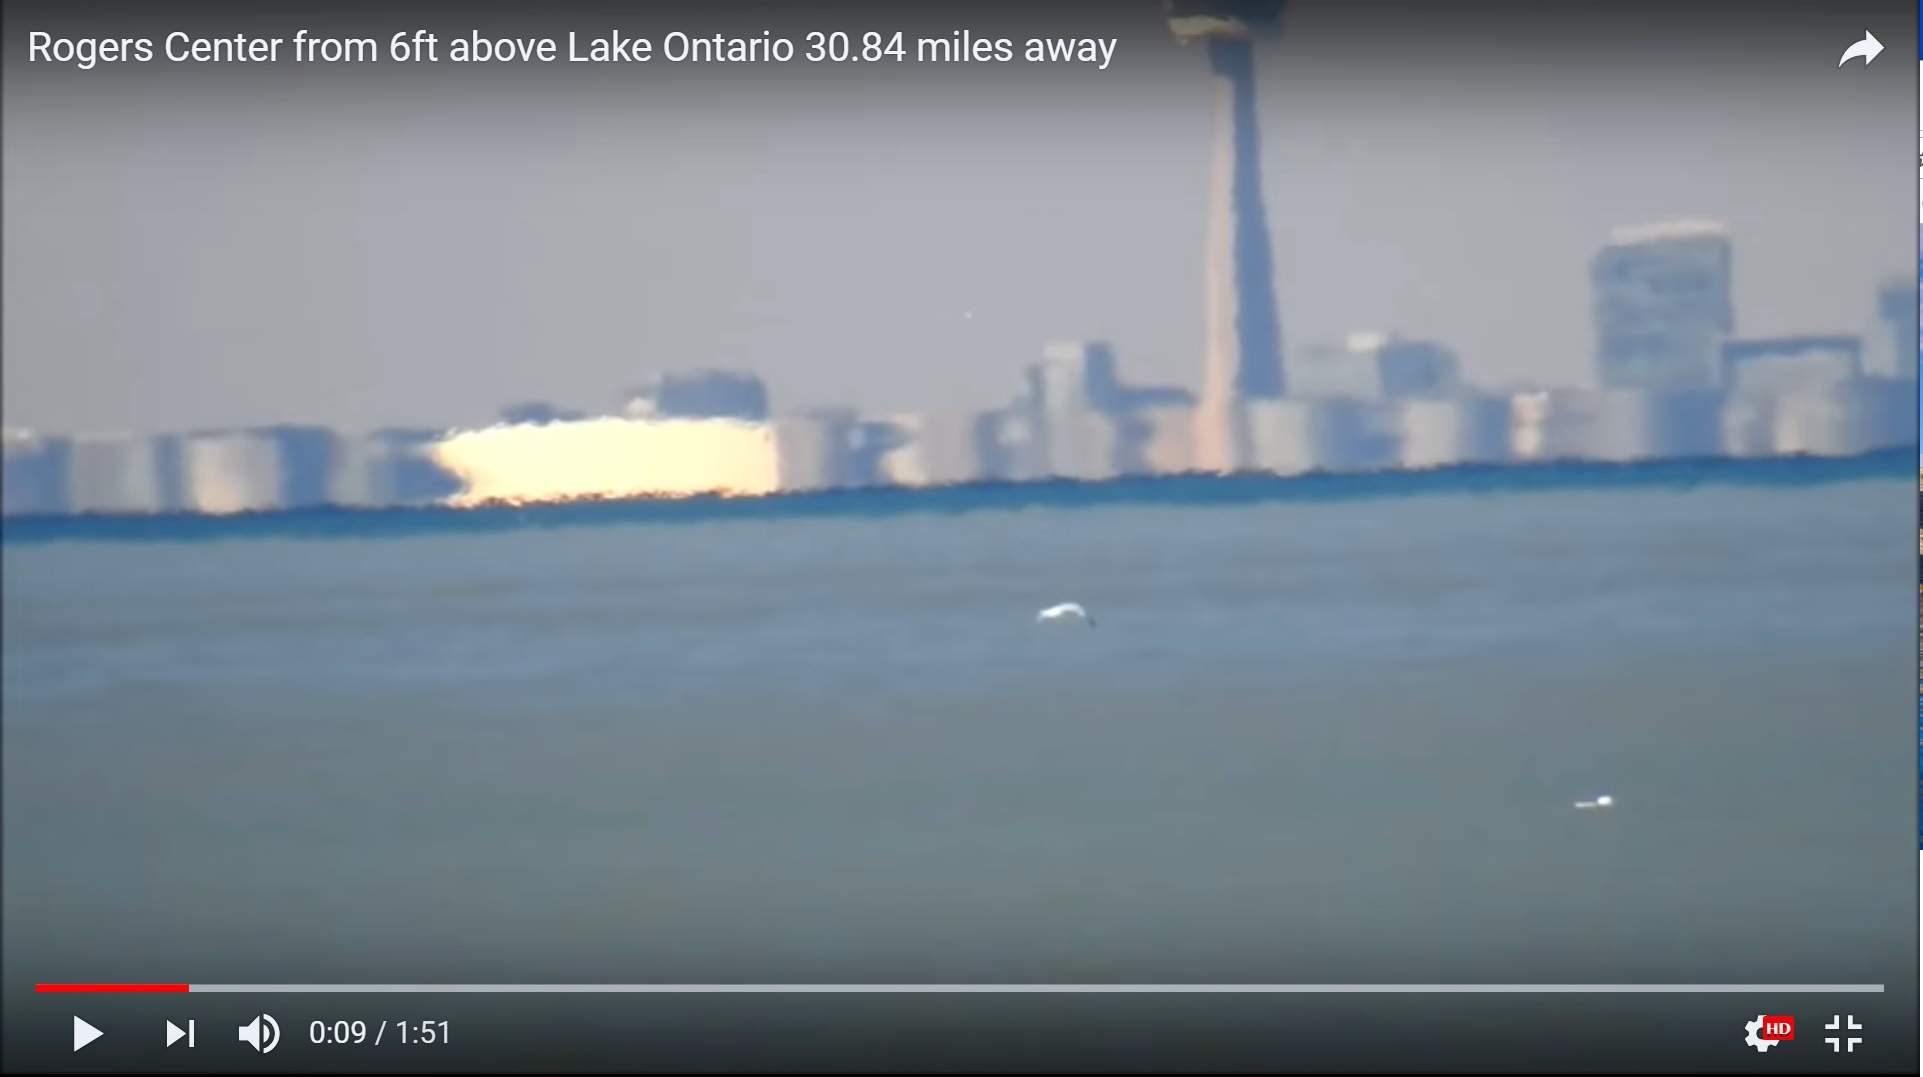
Source: https://www.youtube.com/watch?v=8zzEWy5SGKg


Technical Explanation

Source: https://www.youtube.com/watch?v=1mUXhNhij0Q


A work in progress, the refraction simulator aims to be a physically accurate simulation of the refraction of light from distant objects and the resulting artifacts such as looming, distortion, and mirages.

The approach used is to model the atmosphere where the refractive index is a function of altitude, being derived from pressure (using standard atmosphere pressure altitudes) and temperature (using a user-editable temperature profile.

The simulator then traces a single ray for each line of the image, starting at the eye/camera position. The ray is stepped through the atmosphere, and the direction modified based on the refractive index gradient. This is repeated until it hits the ground, the target object, or misses both (and continues into the sky - no provision yet for ground behind the object.)

This approach is able to replicate all refraction phenomena, including ducting and Fata Morgana, within physically reasonable temperature profiles.

It also replicates a variety of situations that have led people to suspect that the Earth might actually be flat - including laser tests. The default configuration was of Toronto from 31 miles away. There's a laser dot at the shoreline of the target image which is hidden with a standard atmosphere, but which you can bring into view with a temperature inversion forming a duct (move the 30ft point 1° to the right.)

I'm continuing to work on it, and invite feedback.

[This is a summary post. Some information may be repeated in the following discussion. The thread started in 2016, but serious work on the simulator only started in March 2018]
 
Last edited:
I've got refraction in there now, but use a R*7/6 (R*1.166), whereas you use R*1.2. Where did the 1.2 come from? Maybe I should make that editable too.

1.2 was just an example for a high amount of refraction over water as opposed to default standard refraction.

I did find this http://www.ngs.noaa.gov/PUBS_LIB/ResultsOfLevelingRefractionTests_by_NGS_TR_NOS92_NGS22.pdf

I plan to review it later.

It might be useful to have it as a variable but that's up to you. Sounds like surveyors shoot both directions and take the average to cancel out both refraction (assumes same conditions over time) and curvature.

Reading more...


I would really like to make a refraction calculator where you set up some Bézier curves for each of the major parameters and it shows you what would happen (pressure, temp, co2, water vapor, etc).

Would be a lot of work though.
 
I would really like to make a refraction calculator where you set up some Bézier curves for each of the major parameters and it shows you what would happen (pressure, temp, co2, water vapor, etc).

Would be a lot of work though.

Me too. I very briefly started to discuss this with Andrew Young
 
Me too. I very briefly started to discuss this with Andrew Young

For the visualization part I found this which might help anyone interested in an attempt: D3 visualization library

Example site animates some Bézier curves and simple line chart with code sample

So I was thinking for starters that you setup a curve for each parameter which controls its value along the vertical. maybe allow the user to add or delete control points, or just have it fixed at maybe 4 points. We could even start with just straight lines and see how that goes.

So the temp curve might just be slowly decreasing as per normal, or it might increase, then decrease, then increase again, etc...

And you need a 'laser' that you can position vertically, rotate, and pick a frequency of light (rainbow mode would be fun). Might also be fun to have an array of 'lasers' so you can measure multiple lines of sight at the same time.

And then you just iterate over Snell's equation at some fine-grained level using the formula to compute the index of refraction for each point. Sound about right?

Kind of like the PHET refraction simulator (click on More Tools, twice to launch it)

but that doesn't do the gradients unfortunately...
 
And then you just iterate over Snell's equation at some fine-grained level using the formula to compute the index of refraction for each point. Sound about right?

Kind of, you need to use the Taylor series method to get the actual curve, as just using successive linear adjustments gives errors. However it does seem like essentially using lots of very thin layers is an approach people have used before. There's some relevant papers I've been looking at here:

Simulation of atmospheric phenomena, Gutierrez, 2006
http://web.mit.edu/ytc/www/HLMA/Ref/1-s2.0-S0097849306001026-main.pdf
Snell’s law is formulated considering two homogeneous media, through which light travels in a straight path. But all media are inhomogeneous at some degree, with their different properties varying from point to point, and the atmosphere of course is no exception. When the medium is inhomogeneous and the index of refraction changes continuously from point to point, the trajectory of light is affected at each differential step, not just at the boundaries between two media. The final result of this differential change is a curved path that distorts the normal view of a real scene, but that path cannot be calculated by traditional ray tracing. We apply Fermat’s principle [16] to obtain the curved trajectory of the light rays. The original statement of Fermat’s principle is ‘‘the actual path between two points taken by a beam of light is the one which is traversed in the least time.’’ A reformulation of the principle can be expressed as ‘‘light, in going between two points, traverses the route l having the smallest optical path length L’’. This optical path length L is defined as the distance traveled in an optical system by light. For a series of continuous layers with index of refraction n as a function of distance l, it is given by
Content from External Source
Atmospheric Refraction, Cheng, 2012
http://web.mit.edu/ytc/www/HLMA/report.pdf
(claims to give the same results as the above, but simpler).
20160829-084353-xcg2r.jpg
20160829-084411-o9860.jpg


Paywalled:
Real-Time Simulation of Dynamic Mirage Scenes, Wang, 2006
http://link.springer.com/chapter/10.1007/11784203_62
20160829-082714-ddjw4.jpg
 
Good papers I've read them, I looked over the calculator. Its a good start. I would think the calculations for K would be a good approach.
 
I made a start with a mirage simulator:
https://www.metabunk.org/mirage/

Metabunk 2018-03-28 16-21-00.jpg

It's mostly just preliminary UI, but it lets you play around a little to see various effects - not physically based though. You should be able to drag around the dots. Ignore the numbers.
 
Nice.


Still from FE YT video showing "impossible" view of Rogers Center dome. (Should be hidden by x number of feet.)

 
Nice.


Still from FE YT video showing "impossible" view of Rogers Center dome. (Should be hidden by x number of feet.)


You can get something pretty close with the current setup. This is just doing a very simple mapping of the slope of the line to stretching/compression of the image. There's no calculation at all yet. I faked the horizon here.

Metabunk 2018-03-29 11-31-03.jpg
The building positions are a bit different as it was taken from a different angle.

The plan is to to ray trace, one ray per screen line. It will step forward, and adjust the ray angle based on changes in the refractive index. The ray will either hit the ocean or hit the skyline (or island, boat, etc) image
 
I know that the simulator isn't physically accurate yet, but how accurate can it get?

For now all I see a 2D image being stretched and compressed which isn't a 3D model :(
 
I know that the simulator isn't physically accurate yet, but how accurate can it get?

For now all I see a 2D image being stretched and compressed which isn't a 3D model :(

It's not accurate at all right now. It's just a mock up to test display and editing a graph. I just hacked it together with some sample code. It needs the math discussed in earlier posts.

The object image (city/mountain/ship) will be treated like a billboard. The distances within the object are typically very small compared with the distance to the image. So refraction has very little effect over that short distance. Compare the size of downtown Toronto to the distance across the lake:

Metabunk 2018-03-29 21-00-54.jpg

Essentially I'll be modeling the 3D atmosphere between the camera and the object, but not the atmosphere inside the object. I doubt the difference would be detectable.

So the answer is "very accurate"
 
First pass at physically based ray tracing:
Metabunk 2018-03-31 15-15-53.jpg

https://www.metabunk.org/mirage/

Ray tracing is done using an iterative method which varies based on how the steps are. This creates differences mostly when dealing with very shallow angles, especially when "ducts" form.

A vast amount can be done with this, but it requires some UI work.
 
So here's one of the laser experiment.With no temperature change the laser is hidden:
Metabunk 2018-03-31 15-45-54.jpg

Bit with a very slight inversion at 10 feet, it springs into view:
Metabunk 2018-03-31 15-47-18.jpg

Also with a VERY small reduction to the 0ft temperature
Metabunk 2018-03-31 15-48-28.jpg
 
Here's that zoomed in.

Metabunk 2018-03-31 15-54-48.jpg

What's interesting is the really small temperature difference needed. The laser is just hidden in the bottom few feet. There's standard refraction here, but not enough to bring the laser into view:
Metabunk 2018-03-31 15-55-38.jpg


But with just a 0.5°C reduction in temperature between 5 feet and the lake surface:
Metabunk 2018-03-31 15-58-02.jpg

The light path now curves around to the bottom of the target position.

Metabunk 2018-03-31 15-59-09.jpg


A smoother inversion layer gives less distortion
Metabunk 2018-03-31 16-02-11.jpg

Metabunk 2018-03-31 16-02-43.jpg
 
Here's a general illustration of the the reason using lasers is a terrible idea:
Metabunk 2018-03-31 16-12-06.jpg

There's massive distortion of the image, which is quite obvious. But if we were just looking at this laser at night then we'd just see this green dot seemingly 20 feet above the horizon.

Photos and video beat lasers because you can see the distortion.
 
A vast amount can be done with this, but it requires some UI work.
I'm already having fun playing around with it. Looking forward to the improved version.

If I might make a suggestion, I'd like the option of being able to type in numerical values. I think I'd find it easier than the mouse drag.


Still from FE YT video showing "impossible" view of Rogers Centre dome. (Should be hidden by x number of feet.)


In this situation, if the camera were mounted on a drone, the Rogers Centre dome would disappear as the drone gained just a little altitude... proving that it was only visible lower down because of atmospheric refraction.

You should be able to simulate that effect.
 
Last edited:
A variety of UI, optimizations, and quality changes:

Metabunk 2018-04-02 12-26-30.jpg

Notable you can adjust the viewer height with a slider. And you can resize and move the rendered image and the ray graph.

Not much more time for changes until next week. But at that point I'll look more into the physical accuracy. I'm not entirely sure how best to step the ray though a continuously variable medium. Right now it's done by stepping two parallel rays a different length (based on change of speed of light * 1/n), then adjusting the actual ray to be perpendicular to the vector joining the two endpoints. I feel there must be a better way based on the 3D gradient of n, but it's not jumping out at me.

The "narrow" option changes the spacing of these side rays - essentially the width of the simplified wavefront.

I'm also assuming a constant pressure lapse rate, and then calculating n from t and this lapsed p.

The editable temperature gradient is now smoothed internally, this could be tweak, and I need to add a visualization for it. Next week!
 
Last edited:
Unfortunately you really need some high resolution measurements near to the surface. A 'coffee cup' sonde (Windsond) hanging from a drone would be good, and you get it all back with luck.Coffe cup.PNG
 
Interesting looking at things like this:

Metabunk 2018-04-02 17-06-22.jpg

It's a 2°C inversion between 20 and 50 feet. This creates a duct, seen in this highly exaggerated side view of the light paths
Metabunk 2018-04-02 17-07-44.jpg
The top of the duct is where there's a rapid increase in temperature above 20 feet

The bottom of the duct is mostly just straight lines skimming the curve of the earth. It's kind of like a ray of light bouncing around the inside of huge concave mirror at a very shallow angle.
 
Much smoother interpolation of temperature curves.
Added a "Debug" button that shows the curves for first 100 feet
Red = temperature
yellow = refractive index
white = scaled refractive index (scaled so you see more details when it's not changing much)

Metabunk 2018-04-03 22-22-34.jpg
 
I'm in the process of documenting this a bit better. This diagram shows the derivation of the new direction vector from the refractive index gradient. The points A and B are just virtual points for the derivation.


AB.jpeg
 
How good is your simulation at low heights above water? Humidity is probably a strong factor.

I don't see the relationship from Wikipedia:Atmospheric refraction anywhere, is that part of the computations in some other way? (original source: "Monitoring of the refraction coefficient in the lower atmosphere using a controlled setup of simultaneous reciprocal vertical angle measurement" Christian Hirt et al., 2010)
refraction temperature formula.png

I've put this on my reading list as well: "Optical Refractive Index of Air: Dependence on Pressure, Temperature and Composition", by James C. Owens, in Applied Optics, Vol. 6, Issue 1, pp. 51-59 (1967) (PDF)

Here's a challenge to be modelled: curved blue laser beam, 7.4 km distance, reportedly water temperature 16°C air 12°, Source Spotting the laser will be attributed to atmospheric refraction@2:23 (complete observation video Is the Swan River flat? [FLAT EARTH PERTH] Episode 4 - 3 Sticks)perspective refraction flat earth perth.jpg
There could be a negative k value involved, or a compression layer close to the surface that changes the apparent slope of the blue beam further away (i.e. the beam is straighter than it appears to be because of refraction on the way).
 
How good is your simulation at low heights above water? Humidity is probably a strong factor.
I assume a constant humidity of 50%, as I remember humidity had very little effect. I should revisit this.

That seemingly assumes a constant temperature gradient. My simulator is more complex, in that it models the paths of multiple rays through multiple different layers
 
That seemingly assumes a constant temperature gradient. My simulator is more complex, in that it models the paths of multiple rays through multiple different layers
I don't see how it assumes that, if the gradient varies with height, then k varies as well, with the layer?
Do you determine refraction from the densities of the layers directly?

The study below used single-sided and reciprocal zenith angles to measure k in Greece, correlating the measurements with metereological observations.
"The estimation of k using the equation of the temperature gradient does not give satisfactory results." (p10)
Content from External Source
Gaifillia 2016 figure 2.png
Empirical Modelling of Refraction Error in Trigonometric Heighting Using Meteorological Parameters
D. Gaifillia et al., Journal of Geosciences and Geomatics, 2016, Vol. 4, No. 1, 8-14 http://pubs.sciepub.com/jgg/4/1/2 DOI:10.12691/jgg-4-1-2
 
Last edited:
How good is your simulation at low heights above water? Humidity is probably a strong factor.

Dr. Andrew Young has a website about atmospheric optics: http://aty.sdsu.edu/~aty/glossary.html#gradient

Back in 2106 there was an active thread about Sandor Szekely's Lake Balaton laser experiment. I asked Dr. Young to look at that thread. He was kind enough to send me an email in response.

Link to my post in that thread:
https://www.metabunk.org/posts/189149/

I have bolded the part that answers your question. I've edited the email, but have left in additional info I think is apropos to this current thread.


Andrew Young:
http://www.ngs.noaa.gov/GEOID/geoid_def.html

For directions and ranges on the ellipsoid, see

http://www.ngs.noaa.gov/cgi-bin/Inv_Fwd/inverse2.prl


Regarding the issue of how far you can see, I have some info at the end
of my page

http://aty.sdsu.edu/explain/atmos_refr/horizon.html

that points out that surveyors have actually used baselines as long as
192 miles -- between elevated sites, of course.


Regarding "compensating for" refraction: There's no realistic way to do
this. You'd need temperature data at least an order of magnitude more
accurate than air temperatures can be measured, especially under field
conditions. Aspirated thermometers claim an accuracy of about 0.1
degree; but remember it is the vertical temperature *gradient* that you
need. So you have to construct a very accurate temperature profile.

For this reason, the optical people have repeatedly pointed out that the
sensible way to go is the other direction: use the observed ray bending
to infer the temperature profile. The meteorologists have shown no
interest in this idea, mostly because conditions clear enough to allow
it to be used are relatively uncommon.

Please note that humidity is a small contributor to the refractivity of
air at *optical* wavelengths; so unless the laser was in the IR, you can
(to a good approximation) ignore humidity effects. See my page on the
refractivity of air:


http://aty.sdsu.edu/explain/atmos_refr/air_refr.html

Refraction depends on the density gradient of the
air, regardless of the shape of the lake surface. The density gradient
depends on both the temperature gradient and the vertical pressure
gradient due to hydrostatic equilibrium; see my page

http://aty.sdsu.edu/explain/atmos_refr/bending.html

for how to calculate ray bending.


Most people are quite unaware of how much the ray bending varies with
the local meteorological situation. There are well-known diurnal
effects, first noticed in 1674:

http://aty.sdsu.edu/bibliog/bibliog.html#Perrault1967a

-- Perrault's observations showed effects of about a quarter of a degree
on a 2 km path. So of course they are quite visible to the naked eye,
if you have a fixed eye position and a fixed reference point 50 or 100
meters away, and watch the diurnal motion (and the day-to-day motion,
which is considerably larger) of a landmark a few km away.

So, although the "standard" refraction can be computed from a standard
atmospheric model, the real atmosphere -- especially over a body of
water! -- is always different. Sometimes the ray is concave toward the
surface of the Earth; sometimes it is convex. These one-shot experiments
are useless for determining the shape of the Earth.

The curvature of the Earth makes [an] inferior mirage shrink vertically as the height of the eye above
the surface increases. This was first pointed out by Bravais in 1853
(see the reference to his paper in Ann. Met., in the bibliography I
cited above). Unfortunately, because of the complicated path of the
rays in the inferior mirage [see my paper in Appl. Opt. 54, no. 4,
pp. B170-B176 (Feb. 1,2015)], the "reflection" near the surface in the
inferior mirage is not at all like a simple reflection at a solid surface;
so it is not possible to infer the shape of the Earth from this effect.

... the temperature profile in the inferior mirage is a logarithmic one (again,
see my Applied Optics paper for the details.)


By the way, there are much better time-lapse movies of mirages and
varying refraction during the day on YouTube than the one in this
discussion. Here's one:


Content from External Source
 
Last edited:
Regarding RH, the refractive index of air is calculated as a function of pressure, temperature and RH in the code as:

var n = 1 + 7.86e-4 * p / (273 + t) - 1.5e-11 * RH * (t*t + 160)

you can see by the small 1.5e-11 coefficient that RH does not contribute much to it The different between a fixed value of RH of 0% and one of 100% is an irrelevant distortion in most cases.

Introducing a very steep RH gradient has more of an effect, and possibly could make the difference on if a light is visible.
Here I force 100% at sea level linearly to 0% at 10 feet and above
Metabunk 2019-01-19 14-58-46.jpg

Code:
if (par.useDebug) {

	RH = (10 - h/10)*10;
	if (RH < 0) RH = 0;

} else {
	RH = 50;
}

var n = 1 + 7.86e-4 * p / (273 + t) - 1.5e-11 * RH * (t*t + 160)
 
The actual effect of an RH gradient depends on the temperature gradient. It might be worth adding an editable humidity gradient just so you can see how little of an effect it has.
 
Thank you! Your humidity gradient image does show a noticeable change near the waterline where the laser/light would be located. That is also where any temperature gradient resulting from air/water temperature difference would be strongest. Both probably depend on wind speed.

I haven't yet spent enough time with the maths and physics to judge how the proportion of H2O in the atmosphere (partial pressure) translates into the relative humidity term you're using in your formula, but I hope to get around to it these days.
 
I haven't yet spent enough time with the maths and physics to judge how the proportion of H2O in the atmosphere (partial pressure) translates into the relative humidity term you're using in your formula, but I hope to get around to it these days.

Regarding RH, the refractive index of air is calculated as a function of pressure, temperature and RH in the code as:

var n = 1 + 7.86e-4 * p / (273 + t) - 1.5e-11 * RH * (t*t + 160)

This formula comes from NIST's calculator. The direct link is down (possibly from the government shutdown) but it lives on in Archive.org, and has very detailed math.
https://web.archive.org/web/20170120031948/http://emtoolbox.nist.gov/Wavelength/Documentation.asp

The equation above is the "shop floor" calculator, intended for use by hand (with a pocket calculator, or, in a pinch, a slide rule :) ). Their online calculator comes in two forms, Edlén and Ciddor, and they say:


II. Edlén or Ciddor? Guidance in Choosing the Equation

Two basic methods for calculating the refractive index are available here--an equation developed by Ciddor1 and an updated version of the Edlén equation2,3,4 as modified by Birch and Downs and with an additional modification of our own. We suggest that, unless you are an expert in the field with a specific reason to choose one equation over the other, there is no need to worry about the small differences between the two equations--you can choose either one and need not read any further.

The Birch and Downs version of the Edlén equation is probably the most commonly used equation for calculating index of refraction of air for precision measurements at temperatures near 20 °C (68 °F). A very similar equation has been developed by Bonsch and Potulski5.

Ciddor and Rüeger have argued that the equation derived by Ciddor should give somewhat better results than Birch and Downs over a broader range of wavelengths and under extreme environmental conditions of temperature, pressure, and humidity. For this reason the Ciddor equation has been adopted by the International Association of Geodesy (IAG) as the standard equation for calculating index of refraction; the equation is believed to provide more accurate results under the more extreme temperature and humidity conditions of interest for geodetic surveying. In fact, the Edlén equation includes approximations for the water vapor term that are only accurate near 20 °C, and consequently the equation can be in error at high temperature and humidity.
Content from External Source
While implementing Ciddor as a replacement for shop floor might be interesting, the other limitations of the simulation (the impossiblity of real-world measurements of high enough resolutioin, the use of the same gradient at all distances and the step size of the ray tracing) probably make it a moot point. However it would be good to at least verify the "shop floor" equation, which I suspect is most accurate around standard temperature and pressure.

The NIST site had a calculator, but unfortunately, the code is server-side, so I can't copy javascript. These are the input parameters:
Metabunk 2019-01-20 06-40-28.jpg

There's a complex series of equations and coefficients given, which should be possible to convert to Javascript. There's a mathworks implementation at https://de.mathworks.com/matlabcent...1/previews/air_index.m/index.html?access_key= that I will convert
Code:
function nr = air_index(wavelength,temperature,pressure,humidity,method,xCO2)
%AIR_INDEX Computes real index of refraction of air given
% wavelength, temperature, pressure, humidity and CO2 concentration

% Real index of refraction is computed using the algorithms
% available at http://emtoolbox.nist.gov/Main/Main.asp
% Two methods can be specified: 'Ciddor' (newer)
% or 'Edlen' (older). The function is vectorized in
% temperature, pressure and humidity

% 'wavelength' is the wavelength in nanometers
% 'temperature' is the temperature in degrees Celsius
% 'pressure' is the pressure in kiloPascal
% 'humidity' is the percent humidity
% 'method' is a string indicating the method: 'edlen' or 'ciddor'
% 'xCO2' is the CO2 concentration in ppm

% Written by John A. Smith, CIRES, University of Colorado at Boulder

[x1 x2 x3]=meshgrid(temperature,1000*pressure,humidity);

S=1e6/wavelength^2;
T=x1+273.15;

% IAPWS
K1=1.16705214528e3;
K2=-7.24213167032e5;
K3=-1.70738469401e1;
K4=1.20208247025e4;
K5=-3.23255503223e6;
K6=1.49151086135e1;
K7=-4.82326573616e3;
K8=4.05113405421e5;
K9=-2.38555575678e-1;
K10=6.50175348448e2;
Omega=T+K9./(T-K10);
A=Omega.^2+K1*Omega+K2;
B=K3*Omega.^2+K4*Omega+K5;
C=K6*Omega.^2+K7*Omega+K8;
X=-B+sqrt(B.^2-4*A.*C);
psv1=1e6*(2*C./X).^4;

% Over Ice
A1=-13.928169;
A2=34.7078238;
Theta=T/273.16;
Y=A1*(1-Theta.^-1.5)+A2*(1-Theta.^-1.25);
psv2=611.657*exp(Y);

psv=psv1.*(x1>=0)+psv2.*(x1<0);
pv=(x3/100).*psv;

if strcmp(method,'ciddor')

% Convert humidity to mole fraction for Ciddor
alpha=1.00062;
beta=3.14e-8;
gamma=5.60e-7;
fpt=alpha+beta*x2+gamma*x1.^2;
xv=(x3/100).*fpt.*psv./x2;

% Ciddor Equation
w0=295.235;w1=2.6422;w2=-0.03238;w3=0.004028;
k0=238.0185;k1=5792105;k2=57.362;k3=167917;
a0=1.58123e-6;a1=-2.9331e-8;a2=1.1043e-10;
b0=5.707e-6;b1=-2.051e-8;
c0=1.9898e-4;c1=-2.376e-6;
d=1.83e-11;e=-0.765e-8;
pR1=101325;TR1=288.15;
Za=0.9995922115;
rhovs=0.00985938;
R=8.314472;Mv=0.018015;
ras=1e-8*(k1/(k0-S)+k3/(k2-S));
rvs=1.022e-8*(w0+w1*S+w2*S^2+w3*S^3);
Ma=0.0289635+1.2011e-8*(xCO2-400);
raxs=ras*(1+5.34e-7*(xCO2-450));
Zm=1-(x2./T).*(a0+a1*x1+a2*x1.^2+(b0+b1*x1).*xv+ ...
   (c0+c1*x1).*xv.^2)+(x2./T).^2.*(d+e*xv.^2);
rhoaxs=pR1*Ma/(Za*R*TR1);
rhov=xv.*x2.*Mv./(Zm*R.*T);
rhoa=(1-xv).*x2.*Ma./(Zm*R.*T);
nr=1+(rhoa./rhoaxs)*raxs+(rhov/rhovs)*rvs;
else
   
% Modified Edlen Equation
A=8342.54;B=2406147;
C=15998;D=96095.43;
E=0.601;F=0.00972;G=0.003661;
ns=1+1e-8*(A+B/(130-S)+C/(38.9-S));
X=(1+1e-8*(E-F*x1).*x2)./(1+G*x1);
ntp=1+x2*(ns-1).*X/D;
nr=ntp-1e-10*(292.75./T)*(3.7345-0.0401*S).*pv;
end

end
 
There's a complex series of equations and coefficients given, which should be possible to convert to Javascript. There's a mathworks implementation at https://de.mathworks.com/matlabcent...1/previews/air_index.m/index.html?access_key= that I will convert

Done! The result is that using the Ciddor equation there's a minor difference in the distortion near the horizon. The Edlen equation produced pixel-identical results to Ciddor

 
I've added a parameter for the wavelength of the light. This defaults to 550nm, the midpoint of visible light (400 to 700nm). Infrared starts at 700. Here's a comparison with 1500nm, short wave infrared.


The overall vertical displacement change is a few inches. It has the greatest effect where the light is bent most, in the mirage region just above the horizon.
 
I added a "Standard" button that uses the standard ICOA pressure and lapse rate to give a "standard atmosphere" profile. This led to a little confusion as it was revealing more than the curve calculator said it should, but I tracked it down to a mistake in my calculation of the refractive index gradient which was making it twice as sensitive as it should be. That wasn't changing the general type of thing that happened but was doing it with shallower gradients.

I've fixed it, and redone the curves on the presets. One preset is "60 foot target at 10 miles", which looks like this on a hypothetical flat earth with no refraction
Metabunk 2019-01-24 15-25-32.jpg

On the globe with no refraction, it has about 25 feet obscured.
Metabunk 2019-01-24 15-27-47.jpg

With a standard atmosphere, it's a hair over 18 feet hidden.
Metabunk 2019-01-24 15-28-48.jpg

That's quite close to the 7/6*r approximation used in the calculator, which gives use 19.3 feet hidden. I think that's a good validation of the basic model.

It does not take much to bring far more into view, like this very slight temperature inversion with non-standard refraction
Metabunk 2019-01-24 15-31-38.jpg
Remember this is ten miles away, so small changes have a big effect.
 
Back
Top