Oroville Dam Spillway Failure

Status
Not open for further replies.
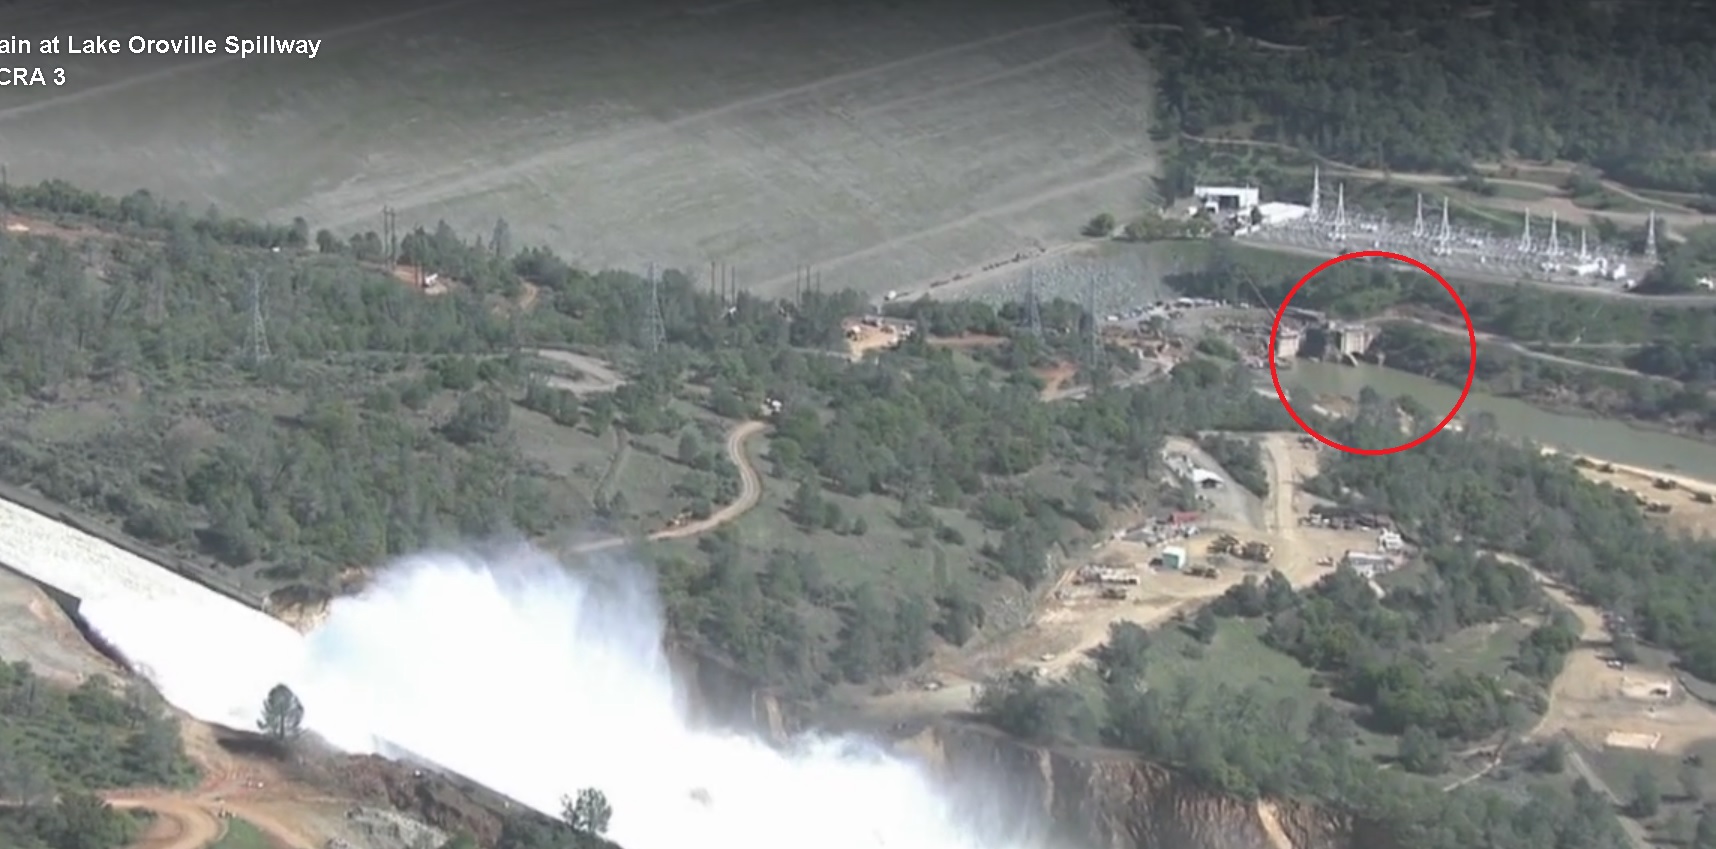
This is the video linked above, which was made yesterday in anticipation of the main spillway being used again in the next couple of days. The relevant part starts at 2 mins. 30 secs. in and continues to about the 10 min. mark. In the first part of that recording there is a reasonable high level view of the present condition of the areas at the base of the spillway where any discharge of water is likely to enter the diversion pool:


Source: https://www.youtube.com/watch?v=qIwzJ0Dnz9E


This is another one of Juan Browne's videos although much more on point than the last one linked in post 1437 above that concerned the river outlet valves. On that subject, there is a useful (largely speculation-free) news article here:

https://yubanet.com/regional/key-oroville-drain-plugged-as-heavy-storms-pounded-the-reservoir/

One of the things it notes (not included in the Browne video) is "Because the river outlets are also the lowest drain in the dam, they have become important for accessing the coldest water at the bottom of reservoir to sustain endangered salmon runs. But they have rarely been used for that purpose until recently."

Browne's thesis is that the river outlets, if run at full capacity, combined with the Hyatt Power Plant output could cope with the current inflow into the reservoir thus sparing the main spillway from use for another extended period. That does not seem realistic given the actual purpose for which the river outlets were designed and the possible impact on the river habitat of drawing water from the colder depths of the reservoir.
 
Latest DWR update video is here (you have to bear with background noise and the camera being wrongly orientated for the first minute):

https://www.facebook.com/CADWR/videos/vb.95205192448/10154526328832449/?type=2&theater

Acting Director Croyle's briefing starts at 2 mins. 30 secs. in and continues until about the 18 mins. mark and then resumes at 20:30 with the Q & A section starting some minutes later.

Notable information:
  • Main spillway repair options will be announced in about two weeks from now. The "forensic" analysis of the cause(s) of the spillway collapse will take longer as the team undertaking that analysis has yet to begin detailed work.
  • Work on the emergency spillway area is almost done and major concerns about it have been mitigated. Mr Croyle noted that despite a multitude of independent consultants being engaged to consider that area in the past none of them had identified the issue that became apparent when it was used in February. He also defended the maintenance carried out on the main spillway, as in everything that needed to be done "and more" was done.
  • Although the spillway is due to be used for outflow today "what you see today may not be what you see tomorrow" as the impact of ramping up output to 50,000 cfs has to be assessed.
  • It is anticipated that there will need to be three spill events between now and 1 June. Target reservoir level is 838 feet.
  • It is possible that further remaining concrete sections of the spillway may be lost during these events; it is likely that concrete sections above the edge that has been grouted will have to be replaced as part of the repairs. Some of that area has been rock bolted down meanwhile per Army Corps of Engineers recommendations.
  • Output from Hyatt power plant will be reduced to zero to enable assessment of backflow from the main spillway release.
 
  • Although the spillway is due to be used for outflow today "what you see today may not be what you see tomorrow" as the impact of ramping up output to 50,000 cfs has to be assessed.
  • It is anticipated that there will need to be three spill events between now and 1 June. Target reservoir level is 838 feet.

This DWR News release yesterday March 16 discusses their intention to open up the spillway.

Oroville, California -
As part of its ongoing management of water flows, the Department of Water Resources will increase outflows from Lake Oroville to the Feather River from the current 13,300 cubic feet per second (cfs) to 50,000 cfs between 11 AM and 2 PM on Friday, March 17 and then maintain those higher flows. These flow levels will be achieved by reducing releases from the Hyatt Powerplant and then adding releases through the regular Oroville Dam gated flood control spillway. The
Feather River elevation will rise between 10 and 15 feet early Friday afternoon, depending on channel geometry and location.
Content from External Source
CDEC data shows that between 11-12:00 outflow increased from 12,700 CFS to 40,000CFS. This seems like a very fast ramp up.
https://cdec.water.ca.gov/cgi-progs/queryF?s=ORO&d=17-Mar-2017+17:43&span=12hours
Content from External Source
I haven't seen any pictures posted by CDWR but it would be interesting to see what the spillway outflow looks like now. I imagine that they will run the spillway for awhile and then shut it off and evaluate erosion.
 
I haven't seen any pictures posted by CDWR but it would be interesting to see what the spillway outflow looks like now. I imagine that they will run the spillway for awhile and then shut it off and evaluate erosion.

In brief, it looks a lot like it did before the debris field was cleared at least in that most of the flow is down the "canyon" formed to the right and very little is reaching the remaining part of the bottom of the spillway; here are two photos from the DWR Facebook page (https://www.facebook.com/CADWR/photos/pcb.10154526856987449/10154526855037449/?type=3&theater)

Outflow1.jpg Outflow2.jpg

A short video of the flow is here:

http://www.sacbee.com/news/state/california/water-and-drought/article139117943.html
 
Secure Connection Failed

The connection to cdec.water.ca.gov was interrupted while the page was loading.

The page you are trying to view cannot be shown because the authenticity of the received data could not be verified.
Please contact the website owners to inform them of this problem.
 
For me at least, I can access CDEC in general and other stations like Shasta, it's just the Oroville station that isn't connecting. Thank you for trying to help! :)
ah. weird.
heres the shot now (theres only 1 more line from your pic)

and note: my address is different than Jeffs.. so if you are using bookmarks you might have to reset it
http://cdec.water.ca.gov/cgi-progs/queryF?s=ORO
upload_2017-3-17_20-39-27.png

http://cdec.water.ca.gov/cgi-progs/queryF?s=ORO&d=03/17/2017+17:37&span=12hours
 
Last edited:
Interesting. The secure page, https is down but, the standard http is still working. Any computer folks have a hypothesis? It's been this way for awhile but, before they ramped up flow to now, I had been checking hourly since 1 pm MST using the secure link. My browser is set to force https for security.
 
Last edited:
Interesting. The secure page, https is down but, the standard http is still working. Any computer folks have a hypothesis?

I have been using the secured link all along as well. The explanation I was given by someone else not related to CDEC or DWR, but very knowledgable about IT:

"No need for a secured connection.... For some reason the server could not deal with it... Possibly too many https connections."

Many thanks to deirdre for figuring it out!

Considering, they had recently ramped up the Outflow, I thought there may have been issues with the page receiving any info from the Dam Complex.
 
Here is a screenshot from the KCRA newscopter showing the Hyatt power plant outlet. It seems they're not effected by backflow this time. The right one is supposed to be half flooded, the left one is always submerged.

 
Appears to be some water coming from a culvert below the road that runs across the emergency spillway. Maybe water diverted here from the drains below the weir wall?

Well spotted although it strikes me as odd that a drain from the area of the weir would be located so far downhill. However, yesterday DWR posted the below picture of armoring work still going on in that general location and what appears to be a large metal drain/culvert (?) was on the surface presumably awaiting placement:
KG_oroville_repair_20874_03_17_2017.jpg
On reflection that might not be a drainage part at all but on the other hand it looks the sort of size that might be placed under a roadway.
 
Last edited:
Anchors (which would not require surface exposure) or sub-surface Instrumentation (which would likely require surface access) ???

upload_2017-3-19_8-26-44.png

Source: mng-chico.smugmug.com/Spillway-gates-open-3-17-2017/i-GtZHn66/O

(a healthy repository of additional photos this day)
 
Anchors (which would not require surface exposure) or sub-surface Instrumentation (which would likely require surface access)

Going by what was said in the last DWR press briefing, those are definitely rock bolts/anchors. Mr Croyle gave an explanation of how these were installed through the concrete deck in the location photographed; he made no reference to installing any instrumentation there or indeed anywhere else in the spillway.

Video of the briefing is still up here with the relevant parts of it being at 21 to 24 minutes:
https://www.facebook.com/CADWR/videos/vb.95205192448/10154526328832449/?type=2&theater

I agree that anchors would not necessarily have to extend above the surface and wouldn't if this was intended to be a permanent means of fixing the concrete to the underlying rock. But this is mostly likely a temporary repair and the secured parts of the deck are likely to be replaced.
 
Yes, I saw the briefing. Note also that they went to quite a bit of effort to seal every crack they could find in the upper spillway, and it would be relatively trivial to bolt at least flush (not sure of the bolting detail), and patch, unless perchance there is an intent to grab and remove the bolts later.

And of course, failure to mention instrumentation does not submit that there is none. In fact they have stated that they do deploy lots of new instrumentation since the first fail was discovered before the flood.

The flows certainly do not look the same, right "out of the gates" and beyond, noting also that the gates are certainly not uniformly open and clear.
 
Has anyone seen pictures of the river channel prior to or as the flow resumed? It would be interesting to see how far they went with clearing the area below the "new spillway". Thanks.
 
Has anyone seen pictures of the river channel prior to or as the flow resumed? It would be interesting to see how far they went with clearing the area below the "new spillway". Thanks.

This might answer your question. Below are photos from the DWR "Oroville Spillway Incident" page (https://pixel-ca-dwr.photoshelter.c...g/G00003YCcmDTx48Y/Oroville-Spillway-Incident) which show late stages of clearing the channel and what it looked like on day 1 of resumed flow:
1_KG_oroville_repair_20220_03_16_2017.jpg 2_KG_oroville_repair_20648.jpg
In addition, from the same source I have stitched together this panorama, which is intended to show the construction of the rock bank opposite where the water actually comes off the spillway. I am not sure if the perspective is right/the two photos were take from the same vantage point but you get the general idea of the reinforcement put in place where the water enters the channel:
3_Panorama.jpg
 
Thanks, that first one is pretty close to what I was hoping for. I really wanted to see how much they left in the bottom of the 'new spillway' outlet. I think it would be an aerial view that would answer completely.

The second photo shows quite a lot of turbulence (as if the flow was partly blocked) right at the river channel edge indicating that they did not excavate much there perhaps.

Thanks again.
 
Thanks, that first one is pretty close to what I was hoping for. I really wanted to see how much they left in the bottom of the 'new spillway' outlet.

The second photo shows quite a lot of turbulence (as if the flow was partly blocked) right at the river channel edge indicating that they did not excavate much there perhaps.

I also wondered about the extent of the excavation in that area, as well as whether the channel was deepened to the extent (I believe nearly 70 feet) that was the original spec.

I don't think that they got quite that far down judging by how far the excavators were reaching below the surface. Whatever the case may be, there's some rather more solid evidence about excavation to widen the channel as opposed to its depth.

The last photos/video posted before the spillway was re-started did not seem to show clearance in front of it all the way back to where the rock rises above the surface. I assumed that the flow in that area was expected to be so strong that it would carry any remaining debris downstream.

Anyway, for a good look at what actually happened I recommend another one of Juan Browne's videos, which from the 1 min 15 secs mark shows how the spillway output ramped up very quickly and basically made mud of what was left in front of the spillway and the canyon to the right into which most of the output flows:


Source: https://www.youtube.com/watch?v=kQe0J5NLLT4
 
Looks to me like "wonky" is the right word. I think one sensor that was going max to min between reports could do that to the added up total of several measuring inflow.
 

Inflows will vary according to the flows coming from dams upstream of Oroville. Many of the dams have electric generators, and will schedule that generation to help match electrical demand. This will cause varying amounts of flow from those dams, and thus will account for some of the variance of flows into the Oroville reservoir.

That's not to say that some sensors are 'wonky', but there are legitimate reasons for varying inflows.

I could not find a suitable hydro generation schedule for PG&E (who owns several facilities upstream from Oroville), but here's a link to US Army Core of Engineers scheduling for hydro-electric generation for various dams in the TN/KY area. Notice how in most cases, the generation is scheduled higher during the day when electric demand is maximum.

Sorry about the formatting - ASCII characters don't do well in copy/paste.

GENERATION PRESCHEDULE 21MAR2017 TVA RIVER SCHEDULING
HR WOL DAL COR CEN OLD JPP CHE BAR
1 45 0 0 0 75 0 36 70
2 45 0 0 0 75 0 36 105
3 45 0 0 0 75 0 36 140
4 45 0 33 0 75 0 36 140
5 45 0 66 0 75 0 36 140
6 45 16 66 40 75 0 36 140
7 0 32 66 80 75 30 36 140
8 0 32 66 80 75 0 36 140
9 0 32 66 80 75 0 36 140
10 0 16 66 80 75 0 36 140
11 0 16 66 80 75 0 36 140
12 0 16 66 80 75 0 36 140
13 0 16 66 80 75 0 36 140
14 0 16 66 80 75 0 36 140
15 0 16 66 80 75 0 36 140
16 0 16 66 80 75 0 36 140
17 0 32 66 80 75 0 36 140
18 90 32 66 80 75 0 36 140
19 135 32 66 80 75 0 36 140
20 225 32 66 80 75 0 36 140
21 225 16 66 80 75 0 36 140
22 225 16 66 80 75 0 36 140
23 180 0 33 40 75 0 36 140
24 90 0 33 0 75 0 36 140

TOTAL 1440 384 1287 1360 1800 30 864 3255
______________________________________________________________

GENERATION PRESCHEDULE 22MAR2017 TVA RIVER SCHEDULING
HR WOL DAL COR CEN OLD JPP CHE BAR
1 0 0 0 0 75 0 36 140
2 0 0 0 0 75 0 36 140
3 0 0 0 0 75 0 36 140
4 0 0 0 0 75 0 36 140
5 90 16 33 0 75 0 36 140
6 90 16 66 40 75 0 36 140
7 180 32 66 80 75 0 36 140
8 225 32 66 80 75 0 36 140
9 225 32 66 80 75 0 36 140
10 225 32 66 80 75 0 36 140
11 225 32 66 80 75 0 36 140
12 225 32 66 80 75 0 36 140
13 225 32 66 80 75 0 36 140
14 180 16 66 80 75 0 36 140
15 90 0 66 80 75 0 36 140
16 90 0 66 80 75 0 36 140
17 90 0 66 80 75 0 36 140
18 180 16 66 80 75 0 36 140
19 180 16 66 80 75 0 36 140
20 225 16 66 80 75 0 36 140
21 225 16 66 80 75 30 36 140
22 225 16 66 80 75 0 36 140
23 180 16 66 40 75 0 36 140
24 90 16 66 0 75 0 36 140

TOTAL 3465 384 1287 1360 1800 30 864 3360
______________________________________________________________
[UNDEFINED | MISSING VALUES] = "----"
REPORT GENERATED: 21MAR2017 0730 (LOCAL TZ)

And the link to the above chart...

http://www.lrn-wc.usace.army.mil/tva_schedule.shtml
 
Last edited:
Inflows will vary according to the flows coming from dams upstream of Oroville. Many of the dams have electric generators, and will schedule that generation to help match electrical demand. This will cause varying amounts of flow from those dams, and thus will account for some of the variance of flows into the Oroville reservoir.

Interesting info here. I had discounted the inflow readings because the reservoir level is the critical thing and that is now within about 9 feet of the target level. At the current level of outflow the target will be reached in two days.

At that point the spillway is intended to be shut down again and according to the last DWR press briefing (see post #1442 above) main spillway repair proposals are scheduled to be announced a week or so later.

Meanwhile, and of direct relevance to what caused the spillway to fail in the first place, the newest DWR video is about the geological features of the area of the failure. The commentary from the DWR geologist is very general. That's not surprising because to date DWR has been pretty tight-lipped about both failure cause and possible repairs, as to which they have outside officials looking over their shoulder. But right from the first minute of this video you get a very graphic picture of the vast extent of the erosion in the area in question although the commentary does not specify the exact nature of the rock that was in that area:

Source: https://m.youtube.com/watch?feature=em-subs_digest&v=OcjXPpRLSM4

A still from this video also graphically illustrates the "dome" or outcrop of Amphibolite around which the weaker material was present, including right under the original failure point:
FractureZone.jpg
Latest DWR still photos at https://pixel-ca-dwr.photoshelter.c...g/G00003YCcmDTx48Y/Oroville-Spillway-Incident also show core samples being taken although these appear to be from the area nearer the emergency spillway:
DK_Oroville-6878_03_20_2017.jpg DK_Oroville-6862_03_20_2017.jpg
It will be interesting (to say the least) to hear what is explained about what actually happened to create the void under the failed part of the spillway and how it is proposed to fill/bridge that area in due course.
 
Last edited:
The Main Spillway (a.k.a the Flood Control Outlet) is rated up to 250K before the emergency spillway kicks in.

.
Interestingly, the Flow Rate being used can, safely be run right down to 838 ft. , the projected Reservoir Level. I am amazed that the Flood Control Outlet is capable of such flow with, basically no head pressure. Even at the top of the opening (inverted ogive?), at 846 ft. the flow rate maximum is 75000 cfs. all from only 4620 sq. ft. of opening.
 
Interestingly, the Flow Rate being used can, safely be run right down to 838 ft. , the projected Reservoir Level. I am amazed that the Flood Control Outlet is capable of such flow with, basically no head pressure. Even at the top of the opening (inverted ogive?), at 846 ft. the flow rate maximum is 75000 cfs. all from only 4620 sq. ft. of opening.

Just a note - the spill gates (valves, if you will) are nowhere near fully open. The top of the water is well above the open portion of the gates at this time. And will be for quite some time. I suspect that at the level of flow, the water level will not go below the top of the gate valves until well below 840 feet.
 
If I am not mistaken, the "flood control outlet rating curve" includes the outflow from the power plant and the river valves not just the spillway. The curve goes well below the lake level that would stop all flow through the spillway. I believe that needs to be considered when looking at the curve.
 
Reservoir level is only inching down at the moment:
Outflow22_3_17.jpg
The reduction is at a much slower rate than it was up to yesterday. (Source: http://cdec.water.ca.gov/cgi-progs/queryF?s=ORO&d=22-Mar-2017+08:36&span=12hours)

While the main spillway has not yet been running for a full week, it looks like it will be necessary to keep it running for more than the 5-6 days DWR originally anticipated would be needed to reduce the level from 864 feet to 838 (see the press briefing video above in post #1442 starting at the 5 minute mark).

That is extra use of the reinforced area of the spillway deck but to date there is no obvious sign of further erosion.

Not sure what accounts for the fairly significant increases in inflow, which have mostly occurred over the last 24 hrs. Nor have I been able to confirm whether the outflow continues to be a combination of the spillway and Hyatt power plant. In any case, the outflow over the spillway has been significantly less than the 50,000 cfs it was originally ramped up to.
 
Status
Not open for further replies.
Back
Top