Not just 990.
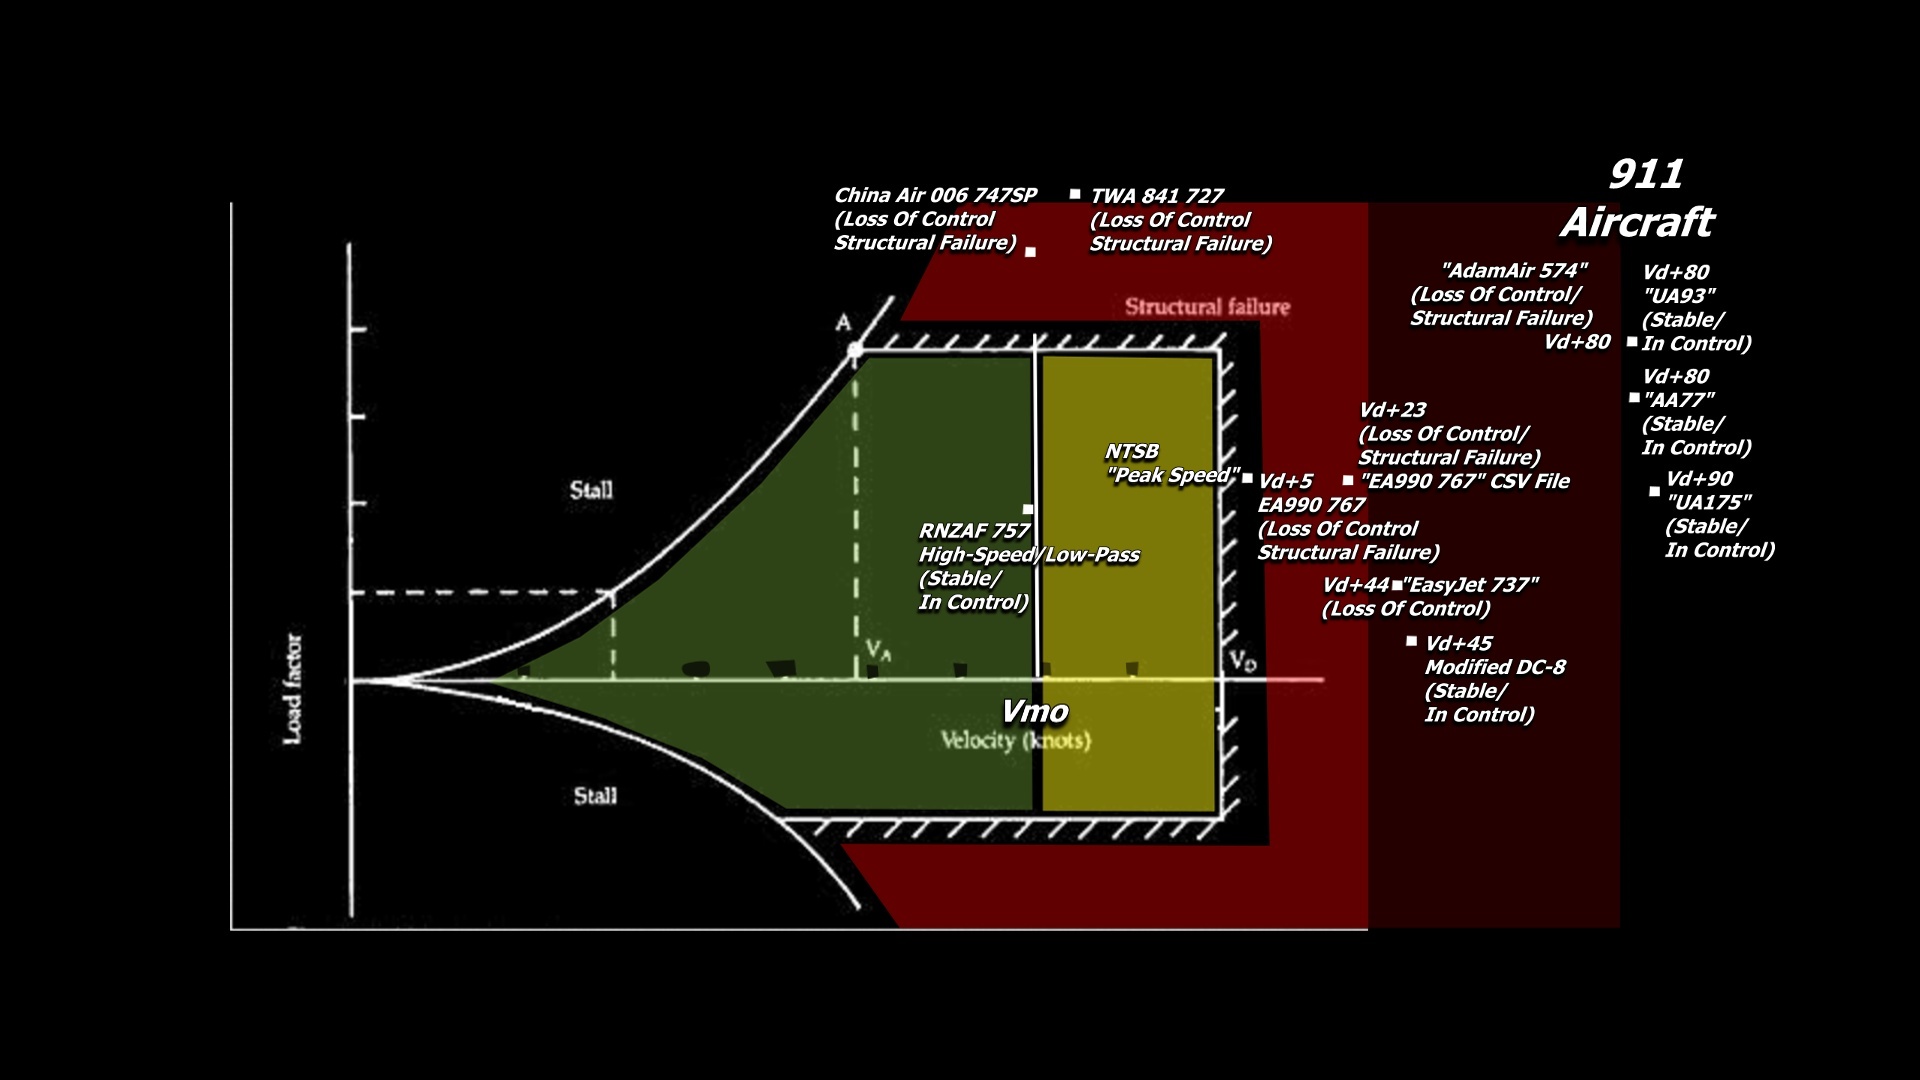
You include China Air 006, with loss of control/structural failure, as if to say it was that speed+acceleration were what caused the loss of control and failure, but this is not the case at all. The aircraft lost control, then increased in speed, then pulled the g-forces which caused the structural failure. Most importantly the aircraft survived.
Same for TWA 841
Same for Easyjet 737
All three of those aircraft only survived because they had to slow down to regain control due to speeds that caused structural failure, the aircraft on 9/11 did not slow down, and continued flying at speeds that far exceeded the flight envelope which would have caused structural failure.
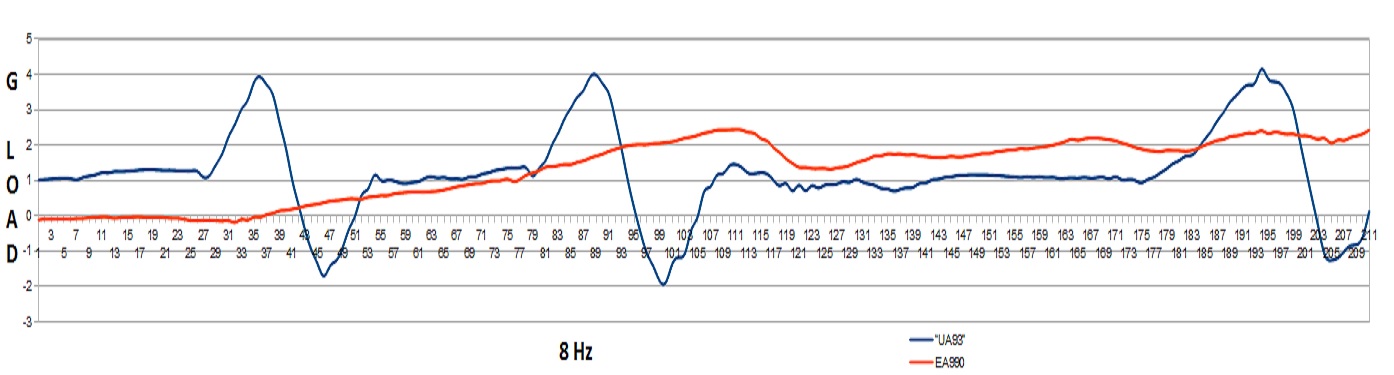
Your next misleading part is where you plot the 9/11 aircraft. You say UAL93 was in control? It was pointed towards the ground, inverted. You call that control?
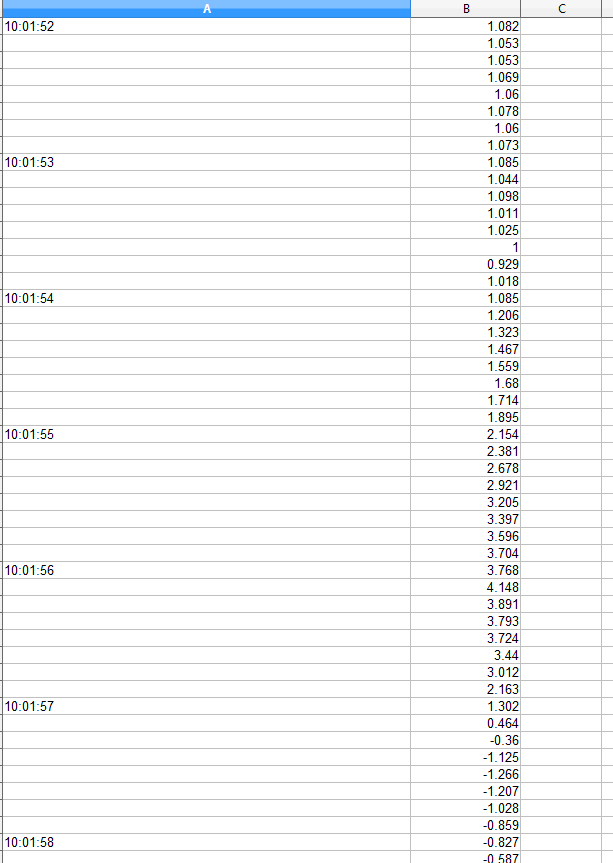
This image is of data taken from the csv files of UA 93 downloadable here :
http://pilotsfor911truth.org/forum/index.php?showtopic=6205
The numbers on the left is the Vertical Acceleration of the aircraft in G's, the numbers on the right is time in EDT
Quoting Rob Balsamo
External Quote:
"UA93" was in fact pulling upwards of 4 G's (according to the FDR data) at high speed when the "hijackers" were allegedly trying to throw the passengers off their feet. The airplane did not break and remained in control... all the way into the ground... again, according to the govt story."
If you doubt my image, then simply download the CSV file and view this fact for yourself.
Whether it was in control or not is irrelevant, the fact is that the airplane should have broken apart at these speeds.
Where are you sourcing the g-forces pulled by AAL77? According to your graph you're claiming AAL77 pulled over 3 g at over 500 mph. That is absolutely false. It never went above 2.25, and for the most part of the final few seconds sat between 0.5 and 2. We also know from the flight data recorder that up to 4 seconds before impact the aircraft was beginning to flutter. Almost every entry and description on your diagram is false, and you know it.
Actually, the G estimate is low for "AA77"...
View this video
The placement on the VG should be much much higher... basically off the graph.
"We also know from the flight data recorder that up to 4 seconds before impact the aircraft was beginning to flutter"
False, you heard that from some guy on the internet,who goes by the name Warren Stutt, and has been thoroughly debunked here:
http://pilotsfor911truth.org/forum/index.php?showtopic=22540
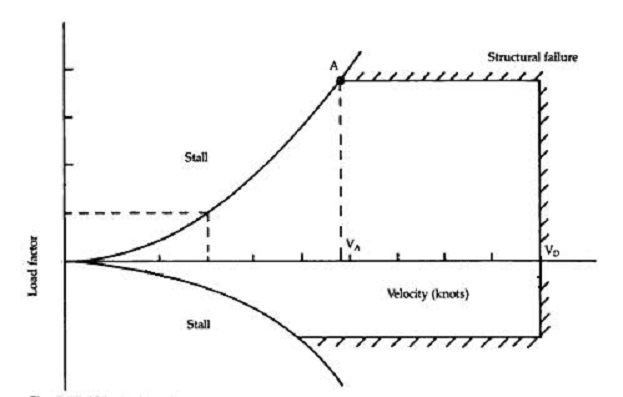
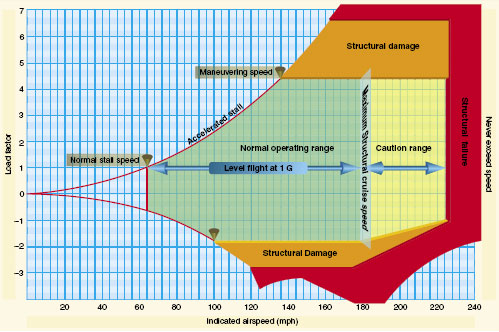
It's wrong because the words "Structural failure" are WRONG. What is meant is "anticipated structural failure".
Structural failure is anticipated beyond those borders but hasn't been dynamically explored.
Beyond the line rightward (SPEED) is normally transonic flight instability and flutter, and a small material safety margin of 10% and a plus/minus variability in specified material strength of a small fraction of that.
Failure due to flutter is itself time-dependent. So you can exceed a limit speed briefly - and more deeply in calm air.
Temporary excursions rightward on the graph are therefore possible. Indeed, they have happened.
You need to interpret such graphs with some greater foreknowledge of the history of their creation. Then you'll improve.
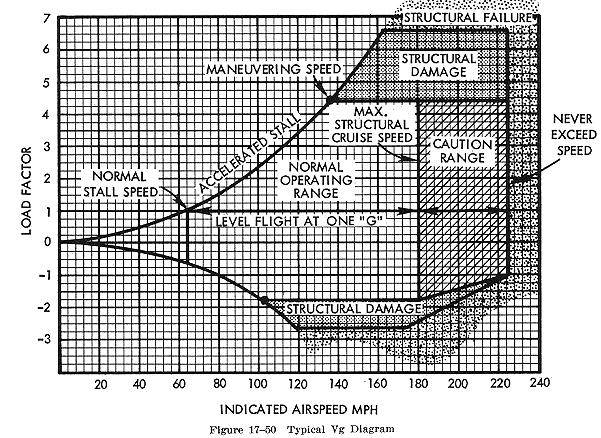
False, several diagrams here from several sources use the term Structural Failure
This one here (from
www.faatest.com/) has a "caution range" while the part past the black line is the structural failure zone. Therefore the only place the "safety margin" you describe could only come before the Structural failure zone, not in it
Notice that it says "structural failure"not "anticipated structural failure"
Another diagram depicting the same thing (from
www.aero-mechanic.com/)
Once again, the caution range comes before the "structual failure zone"
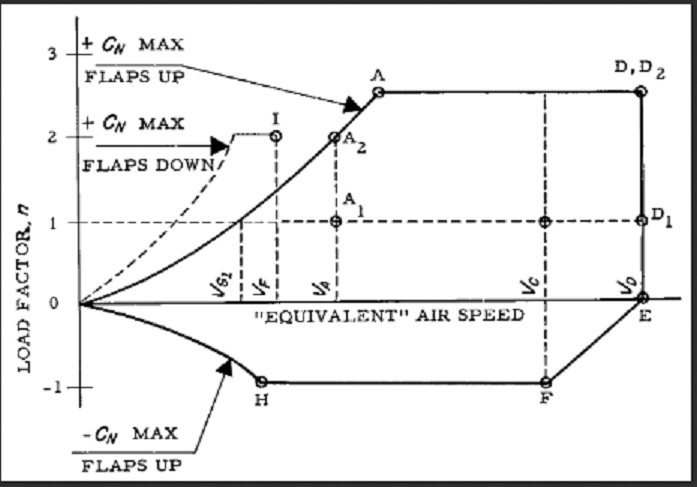
Another one (from
http://apstraining.com/)
And this one, directly from the FAA, though there is no structual failure text present, it can be observed that it is the end of the flight envelope.
Once again, vd is the end of the flight envelope, the maximum amount of stress an aircraft can endure. Beyond this causes structural failure, period.
To sum it up, There is no documentation of the "structural failure zone" having a safety margin, such a margin would only come before the structural failure zone, there is also no proof of any graph being labeled "anticipated structural failure".
The flights Air China 006, TWA 841, EgyptAir 990 and Easyjet 737 all experienced speeds past this zone, sometimes only a few Vd's past it and suffered structural failure, period.
"Beyond the line rightward (SPEED) is normally transonic flight"
You once again offer no sources for this claim.
"Temporary excursions rightward on the graph are therefore possible. Indeed, they have happened."
Only briefly.
Quoting Rob Balsamo:
External Quote:
We have never claimed an airplane will break 1 knot over Vd and we explain this in Skygate. However, there has never been an aircraft which has exceeded its Va by more than 220 knots, Vmo+150 and Vd+90, pulled G's, rolling on G's (which lowers G structural limits significantly) and remained in control or stable before 9/11 or after... "Debunkers" still have yet to provide such precedent and have failed for years.
I'd recommend reviewing the OP. The topic of the thread is if the fastest speed observed was possible for a few second, or, as PF9 assert, planes fall apart at a specific point on the graph.
If you consider only that point, it seems to me that PF9's claim has been quite cleanly debunked, and the protestations to the contrary are largely arguments from false authority, distractions, and unfortunately a large degree of scorn.
Jazzy described the key issue well - a region labeled "structural failure" does not mean the plane will drop out if the sky the instant you enter that region.
Does your car instantly explode if you rev it into the red zone of your tachometer?
False, Jazzy provided no sources for his claims, the fact is that the planes on 911 were well in the zone where they should have experienced flutter, and then structural damage.