solrey
Senior Member
Weatherwar101 has a new video claiming the Dec. 5/6 2013 ice storm is geoengineered, stating at the end of the vid...
In the video weatherwar101 claims...
I saw it coming when on Sunday or Monday I told my gf that when she was going to fly out to the east coast Wednesday morning she was going to be just ahead of a potential snow storm here and what would probably turn into a nasty winter storm marching across the continent.

After showing some forecast maps, WW101 focuses on the following statement below the maps...
"Yesterday, the 4km NMM model printed out 5 inches of sleet!"
However, WW101 ignores the rest, which reads...
"(See my 2007 blog "Incredible Sleet Stories" and last years "8 Inches of Freezing Rain" for records of those weather phenomena)"
Of course WW101 doesn't want his viewers to know that these kinds of winter storms are not all that unusual.
WW101 follows by stating...
WW101 proceeds to show winter mode radar loops showing rain turning to snow as the precip is advected into a colder air mass.
Then...
More radar loops of rain turning to snow, then...
Now, about that classic ice storm pattern. Below are several maps that as a set clearly show frigid arctic air from the north meeting warm moist tropical air from the south with a strong jet streak just on the back side of the cold front. Textbook setup. The result is rain on the warm side, ice/sleet/freezing rain along the front and snow on the cold side. WW101 claims there is not enough moisture being drawn in to the system to produce substantial precipitation. He conveniently fails to show a water vapor map, or any other sort of upper air or surface map because if he did the whole deception would fall apart as it would be obvious where the moisture is coming from and why there is a winter storm. The surface maps clearly show warm moist air being drawn up from the south.
For those who don't know how to read wind barbs...


Water Vapor map showing moisture riding along the jet stream.

Upper air map showing winds at ~35,000 feet, including the jet stream. Note the jet stream is in the range of 145-150 knots, that's around 170 miles per hour.

Map of surface winds showing winds from the north colliding with winds from the south.

Map of winds at ~2,500 feet showing winds from the north meeting winds from the south.

Map of surface temperatures. Note the steep gradient between warm and cold air masses.

Map showing surface dew points. Note the dew points are within 5 degrees of the temps on the warm side, indicating warm moist air is being drawn up as per the wind maps above.

Map of frontal boundaries. Note the low pressure disturbances riding the jet stream along the front. Those disturbances impart instability in the atmosphere that produce heavier precipitation and storms.

Map that combines surface winds, frontal boundaries, H/L pressure systems, temps and pressures at the surface.
Either WW101 has a very limited, child-like understanding of meteorology, or he knows enough to fool the most gullible and ignorant. One of his fans said...
...now, where is my farm?
Always wanted a farm.External Quote:I can prove this reality, any day of the week.
You can bet the farm on it...
In the video weatherwar101 claims...
Yes, anyone who understands meteorology could see the weather pattern developing.External Quote:It's far too easy to illustrate (or "predict") how this "epic ice storm" is going to develop (or be manufactured)
I saw it coming when on Sunday or Monday I told my gf that when she was going to fly out to the east coast Wednesday morning she was going to be just ahead of a potential snow storm here and what would probably turn into a nasty winter storm marching across the continent.
Because the continental US is along the latitudes where tropical and arctic air masses meet. This is basic stuff. Weatherwar101 should take meteorology 101.External Quote:This will be another example of frequency activated ice nucleation, and everyone can expect to see a great deal of it this winter.
We've already seen one incredible runaway example this year. (referring to the early Oct. blizzard that hit South Dakota that killed a number of cattle)
How else do you think we get from 80 degrees to 30 degrees (and vice versa) overnight so frequently in this country?
After showing some forecast maps, WW101 focuses on the following statement below the maps...
"Yesterday, the 4km NMM model printed out 5 inches of sleet!"
However, WW101 ignores the rest, which reads...
"(See my 2007 blog "Incredible Sleet Stories" and last years "8 Inches of Freezing Rain" for records of those weather phenomena)"
Of course WW101 doesn't want his viewers to know that these kinds of winter storms are not all that unusual.
WW101 follows by stating...
Well clouds don't show up on radar, and infrared satellite images of clouds depict the temperature of the cloud tops which translates into altitude. But infrared images have vewwy scawwy colors.External Quote:Makes you wonder how the 4km NMM model "knows" that massive amounts of water vapor are going to suddenly materialize from nowhere in the center of the country, doesn't it...
As you can see from the base reflectivity, there is almost no significant "weather" visible anywhere, which this "epic ice storm" could develop from.
Infrared shows a different story however, color1 shows massive amounts of "material" in the air - that isn't actual "weather"
huh?External Quote:It's "material" that will combine with the massive amounts of superheated water vapor that will be generated in the target area to feed the "epic ice storm".
When the water vapor bursts combine with the nano-bio-chem "material" in "frequency activated" areas (white/pink), it instantly turns (or "flashes over") into "heavy wet snow".
WW101 proceeds to show winter mode radar loops showing rain turning to snow as the precip is advected into a colder air mass.
Then...
Next he snows a winter mode radar loop where ground clutter shows up as frozen precipitation. Well duh, the radar display factors temperature into the mix in winter mode. And the radar loops are from mid-November. Kind of deceptive, don't ya think?External Quote:Notice how the radar stations reflectivity colors change to indicate snow and ice - where there isn't even any weather yet.
More radar loops of rain turning to snow, then...
I can prove, as the Weather Prediction Center puts it, that it's "a classic ice storm pattern".External Quote:So, what do we know is going to happen here?
No substantial weather systems of any kind approaching or surrounding target area.
No storm systems coming in from the Pacific Ocean.
No storm systems coming in from the Gulf of Mexico.
So where will all the water vapor come from that will "flash over" into the "epic ice storm".
It will come from multiple simultaneous ground sources within the target area itself... just like it always does.
I can prove this reality, any day of the week.
You can bet the farm on it...
We did get an inch or two of snow along the coast of Washington and Oregon, and like a good little spotter I reported the 9 inches of total snowfall I measured at my location in the Willamette Valley.External Quote:Short Range Forecast Discussion
NWS Weather Prediction Center College Park MD
356 PM EST Thu Dec 05 2013 Valid 00Z Fri Dec 06 2013 - 00Z Sun Dec 08 2013
...Major ice storm expected from the Central Texas to the Ohio Valley...
...Heavy snowfall expected from Oklahoma to Lower Great Lakes...
...Very cold airmass overspreading the West and Central U.S. with temperatures 10 to 30 degrees below normal...
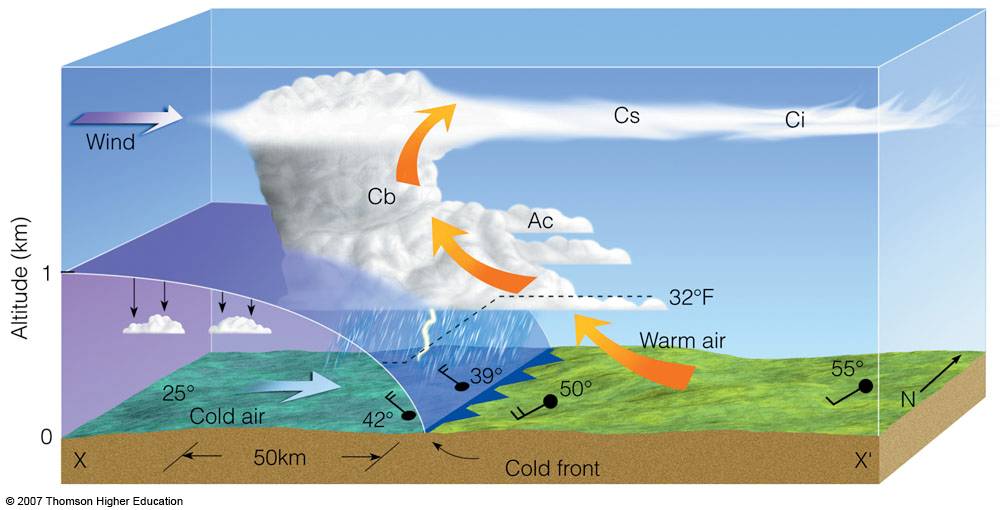
A classic ice storm pattern is taking shape from the Southern Plains to the Ohio Valley. A strong cold front surging south and east will be overrun by mild return flow off the Gulf of Mexico, leading to a prolonged period of freezing rain and sleet from central Texas to the Ohio valley. Precipitation is expected to develop in response to a strengthening upper-level jet that remains well behind the surface cold front. As a result, the majority of the precipitation will fall into the cold sector of the storm, where significant icing is expected. The northern portion of the precipitation will fall in the form of snow, with a band of moderate snowfall expected from Oklahoma to Central Ohio. The cold front will slowly push eastward with precipitation spreading into the Northeast and Mid-Atlantic.
In wake of the cold front pushing through the eastern U.S., a very cold airmass will overspread the central and western U.S. Temperatures will be 10 to 30 degrees below normal for the next few days. High temperatures will remain below zero for some parts of the northern Plains. A reinforcing shot of cold air will arrive in the Pacific Northwest toward the end of the period. Snowfall will be possible even within coastal Washington and Oregon.
Now, about that classic ice storm pattern. Below are several maps that as a set clearly show frigid arctic air from the north meeting warm moist tropical air from the south with a strong jet streak just on the back side of the cold front. Textbook setup. The result is rain on the warm side, ice/sleet/freezing rain along the front and snow on the cold side. WW101 claims there is not enough moisture being drawn in to the system to produce substantial precipitation. He conveniently fails to show a water vapor map, or any other sort of upper air or surface map because if he did the whole deception would fall apart as it would be obvious where the moisture is coming from and why there is a winter storm. The surface maps clearly show warm moist air being drawn up from the south.
For those who don't know how to read wind barbs...
Water Vapor map showing moisture riding along the jet stream.
Upper air map showing winds at ~35,000 feet, including the jet stream. Note the jet stream is in the range of 145-150 knots, that's around 170 miles per hour.
Map of surface winds showing winds from the north colliding with winds from the south.
Map of winds at ~2,500 feet showing winds from the north meeting winds from the south.
Map of surface temperatures. Note the steep gradient between warm and cold air masses.
Map showing surface dew points. Note the dew points are within 5 degrees of the temps on the warm side, indicating warm moist air is being drawn up as per the wind maps above.
Map of frontal boundaries. Note the low pressure disturbances riding the jet stream along the front. Those disturbances impart instability in the atmosphere that produce heavier precipitation and storms.
Map that combines surface winds, frontal boundaries, H/L pressure systems, temps and pressures at the surface.
Either WW101 has a very limited, child-like understanding of meteorology, or he knows enough to fool the most gullible and ignorant. One of his fans said...
I agree, it sends a chill down my spine whenever I see how gullible and foolish those people are.External Quote:This channel never fails to send a chill down my spine.
...now, where is my farm?
Last edited: