CbIncus
Member
Carnicom's article "Contradictions": http://www.carnicominstitute.org/articles/contra1.htm is about a case of "chemtrail spraying" above Santa Fe, New Mexico, USA. It states that
These numbers are correct, but the are two questions:
1. What are real atm. conditions at 10:30 LT? They can change a lot between radiosonde launches.
2. The accuracy of radiosonde data is also questionable: https://www.metabunk.org/threads/75...de-humidity-soundings-for-contrail-prediction.
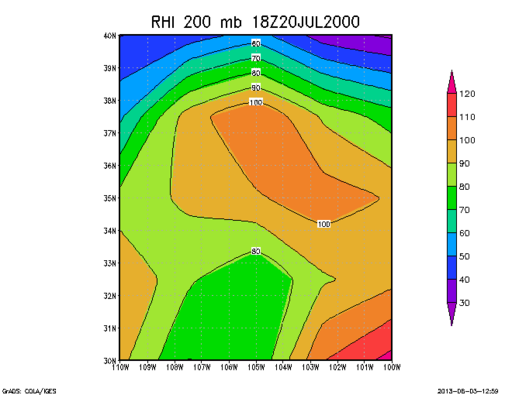
There's a way to answer thq questons using NCEP/NCAR Reanalysis-2 data, which also ingests satellite measurements: http://nomad3.ncep.noaa.gov/ncep_data/ and http://nomad3.ncep.noaa.gov/pub/reanalysis-2/6hr/pgb/. I've downloaded the pgb.200007 file for July 20th RH data, processed it with GrADS and converted RH to RHi using Goff-Gratch equations. The result is the following map:
We see a region above Santa Fe which is very close to ice saturation. So there's no contradiction.
Conditions in Santa Fe NM yesterday July 20 2000:
Clear blue sky early hours of the morning. Introduce heavy aircraft spray activity during morning hours, resulting in subsequent classic formation of extensive cirrus - cirrostratus - and cirrocumulus 'appearing' cloud decks. The now expected, formerly unusual, ring aroung the sun also developed, due to microscopic hexagonal crystals of uniform size existing in the atmosphere, the appearance of which also was directly
associated with aircraft activity.
In Albuquerque, at flight level, immediately visible to the south:
Relative humidity at 35,000ft. MSL at 0500 (5am) 32%
Relative humidity at 35,000ft. MSL at 1700 (5pm) 41%
Relative humidity interpolated at 1030 observation time is 36%.
U.S. Naval Postgraduate School in Monterey CA and Vincent Schaefer, inventor of cloud seeding in 1946, both affirm that cloud formation is not expected to even begin below relative humidities of 70%. That case itself is considered unusual, exemplified with the introduction of hygroscopic nuclei, such as salts in the atmosphere along the coast. Persistent contrails stated by numerous sources to have the potential to exist only in conditions of near saturation to saturation.
These numbers are correct, but the are two questions:
1. What are real atm. conditions at 10:30 LT? They can change a lot between radiosonde launches.
2. The accuracy of radiosonde data is also questionable: https://www.metabunk.org/threads/75...de-humidity-soundings-for-contrail-prediction.
There's a way to answer thq questons using NCEP/NCAR Reanalysis-2 data, which also ingests satellite measurements: http://nomad3.ncep.noaa.gov/ncep_data/ and http://nomad3.ncep.noaa.gov/pub/reanalysis-2/6hr/pgb/. I've downloaded the pgb.200007 file for July 20th RH data, processed it with GrADS and converted RH to RHi using Goff-Gratch equations. The result is the following map:
We see a region above Santa Fe which is very close to ice saturation. So there's no contradiction.
Last edited by a moderator:

