Press Alt Mt Temp Dew RH
hPa C C
247.0 10689 -50.9 -56.9 49
238.0 10929 -52.5 -60.0 40
235.0 11011 -53.1 -61.1 37
231.0 11120 -54.0 -62.0 37
208.0 11786 -59.3 -67.3 35
205.0 11876 -60.0 -68.3 33
200.0 12030 -61.1 -70.1 29
199.0 12061 -61.1 -70.1 29
195.0 12188 -61.1 -70.1 29
191.0 12315 -61.7 -71.3 27
Could somone here tell me what I might expect to see with regard to aircraft trails given this set of radiosonde data? The heights are 35,000ft to 40,500ft, the corridor in which most commercial traffic operates. Thanks
Probably not too much in that particular altitude range, and in the precise location where the balloon was, and at that time.
However, radiosonde data alone is not always a useful predictor. It's usually nowhere physically near, or close in time, to the actual contrail observations. That particular station is on the tip of Cornwall in the far south-west of the UK, so will not match condition in, say, London. It was also taken at 12Z, today 23rd Sept 2011, , (1PM UK local time),
There's also plenty of traffic below 35,000 feet over the UK, and it looks plenty cold enough, and humidity is higher, up to 64% at 30,839 feet (you generally need above 70%). So given the variables involved, I'd not be at all surprised if there were quite a few contrails in the UK today.
03808 Camborne Observations at 12Z 23 Sep 2011
307.0 9243 -40.3 -44.9 61 0.23 247 19 326.3 327.2 326.3
300.0 9400 -41.3 -45.5 64 0.22 245 20 327.0 327.9 327.1
291.0 9605 -42.6 -47.2 61 0.19 235 22 328.0 328.8 328.1
284.0 9768 -43.7 -48.5 59 0.17 235 20 328.8 329.5 328.8
280.0 9864 -44.3 -49.3 57 0.15 235 21 329.2 329.9 329.3
272.0 10054 -45.8 -51.1 55 0.13 235 24 329.8 330.3 329.8
264.0 10251 -47.4 -52.9 53 0.11 230 25 330.3 330.7 330.3
250.0 10610 -50.3 -56.3 49 0.07 235 24 331.1 331.5 331.2
247.0 10689 -50.9 -56.9 49 0.07 235 24 331.4 331.7 331.4
238.0 10929 -52.5 -60.0 40 0.05 235 24 332.5 332.7 332.5
235.0 11011 -53.1 -61.1 37 0.04 239 24 332.8 333.0 332.8
231.0 11120 -54.0 -62.0 37 0.04 245 23 333.1 333.3 333.1
208.0 11786 -59.3 -67.3 35 0.02 241 23 334.9 335.0 334.9
205.0 11876 -60.0 -68.3 33 0.02 240 23 335.3 335.4 335.3
200.0 12030 -61.1 -70.1 29 0.02 240 21 335.9 335.9 335.9
199.0 12061 -61.1 -70.1 29 0.02 235 21 336.3 336.4 336.3
195.0 12188 -61.1 -70.1 29 0.02 235 23 338.3 338.4 338.3
191.0 12315 -61.7 -71.3 27 0.01 235 25 339.3 339.4 339.3
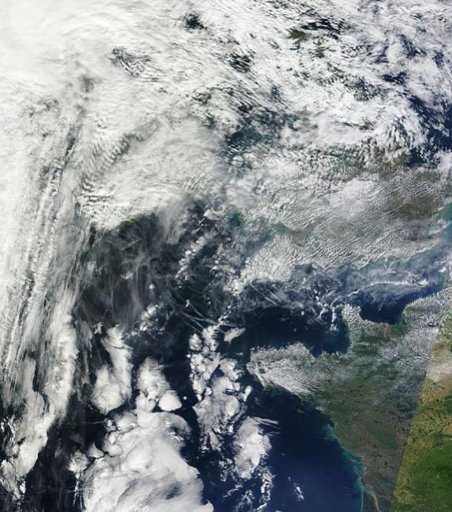
You usually get a better idea if your observations match weather condition by looking at the MODIS satellite images, where you can see the broader picture.
http://lance-modis.eosdis.nasa.gov/imagery/subsets/?subset=Europe_2_01
The Terra image is up already, and you can see there are a lot of contrails, and you can see the cause - an approaching weather system:
http://lance-modis.eosdis.nasa.gov/imagery/subsets/?subset=Europe_2_01.2011266.terra.1km

And for the VERY broad picture, the LANCE Web Mapping Service is excellent. See the big swirly weather system off the coast of Europe. That's the source of the moisture in the the air:
http://lance-modis.eosdis.nasa.gov/...6.18359&layers=B0000FFFFFFT&datum1=09/23/2011

