This is something I've been meaning to do for a while: a daily record of the contrails (or lack of contrails) in the sky, in a known location, compared to a daily record of the atmospheric conditions in that location, specifically the relative humidity at typical aircraft cruising height.
I'm planning to continue this for at least a month, which should be a big enough data set to draw some reasonable conclusions.
I don't have the equipment (or the time!) to record my own timelapses, so, with permission, I am using videos recorded by an amateur weather observer in Irlam, near Manchester in northwest England. Obviously I don't have any control over whether these videos will be available every day, but hopefully they will be.
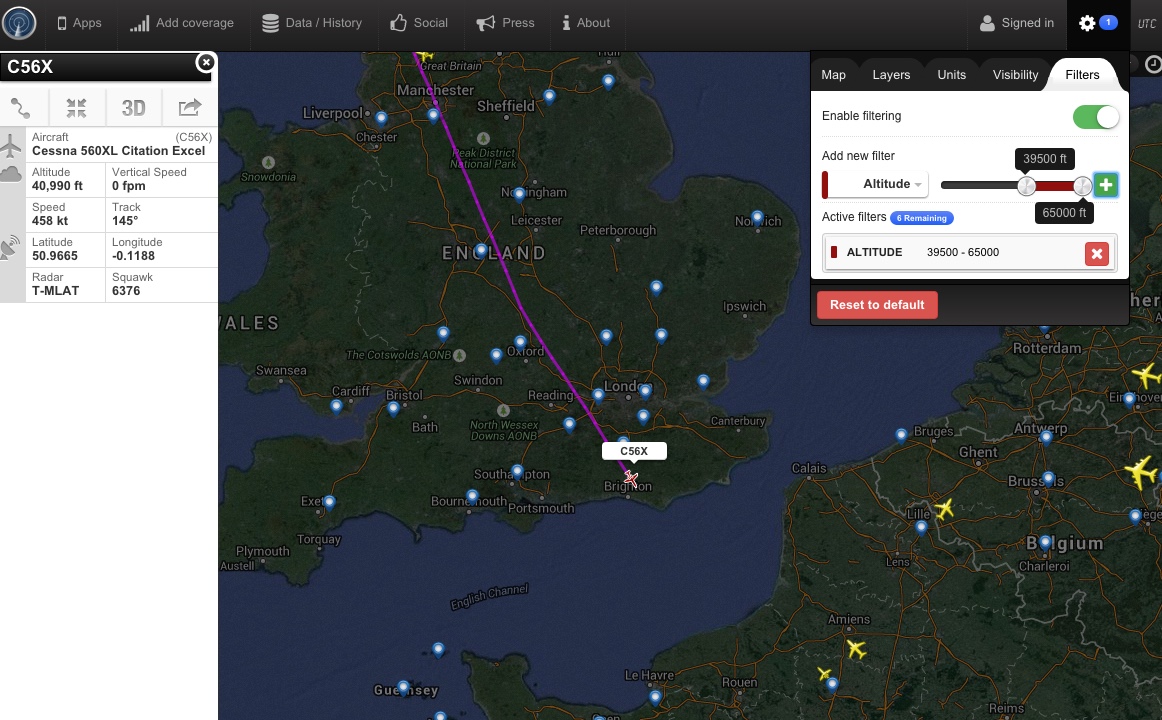
This is the location in the UK, and his camera faces northwest:

To record the relative humidity, I am using the 300mb maps at instantweathermaps.com (a pressure of 300mb equates to an altitude of approximately 30,000 feet). These are based on weather model data, so they are a forecast, but are in near real time, in three-hour steps through the day.
Important caveat: the maps only show the forecast humidity at that particular altitude. Planes don't all fly at 30,000ft, so the humidity at different flight levels can be very different. Nevertheless I am hoping a good correlation can be seen.
I will start the observations in a new post, and hopefully edit this one with a summary at the end of the month.
I'm planning to continue this for at least a month, which should be a big enough data set to draw some reasonable conclusions.
I don't have the equipment (or the time!) to record my own timelapses, so, with permission, I am using videos recorded by an amateur weather observer in Irlam, near Manchester in northwest England. Obviously I don't have any control over whether these videos will be available every day, but hopefully they will be.
This is the location in the UK, and his camera faces northwest:
To record the relative humidity, I am using the 300mb maps at instantweathermaps.com (a pressure of 300mb equates to an altitude of approximately 30,000 feet). These are based on weather model data, so they are a forecast, but are in near real time, in three-hour steps through the day.
Important caveat: the maps only show the forecast humidity at that particular altitude. Planes don't all fly at 30,000ft, so the humidity at different flight levels can be very different. Nevertheless I am hoping a good correlation can be seen.
I will start the observations in a new post, and hopefully edit this one with a summary at the end of the month.
Last edited:
")