Jay Reynolds
Senior Member.
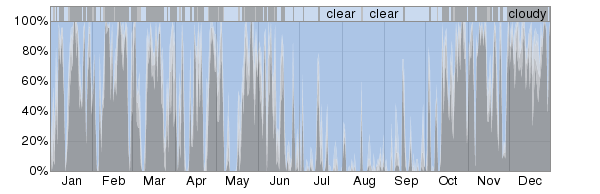
Frequently, claims are being made that there are no more days with blue skies, or that cloudiness has increased. I'd like to discuss these claims.
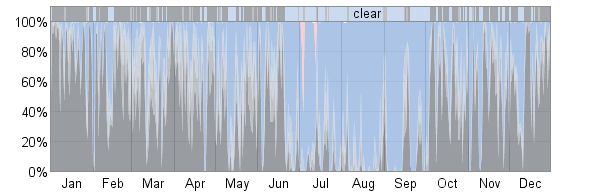
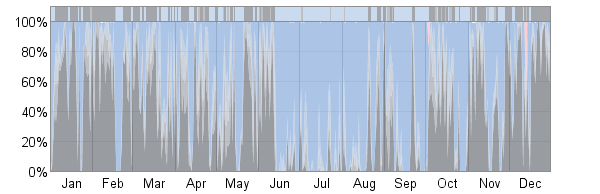
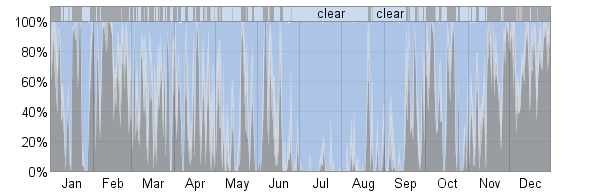
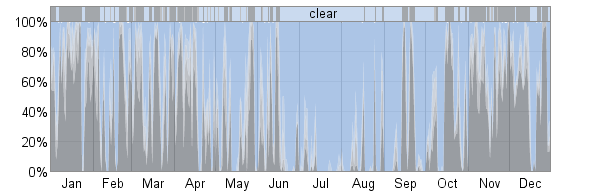
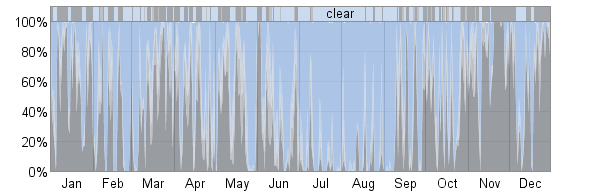
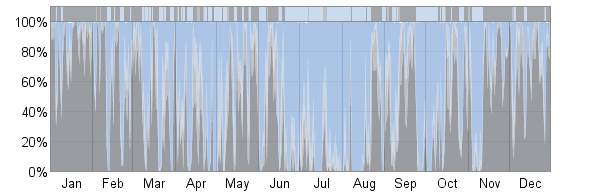
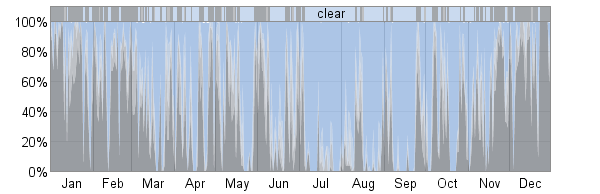
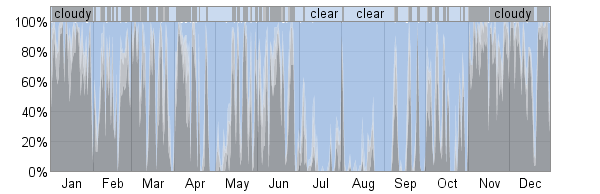
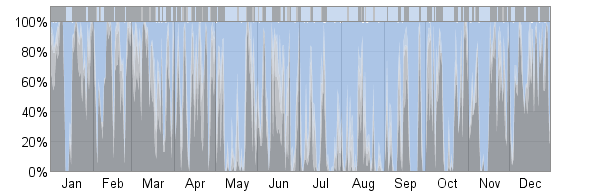
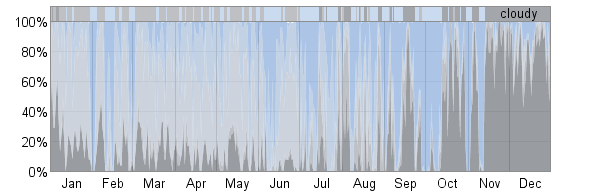
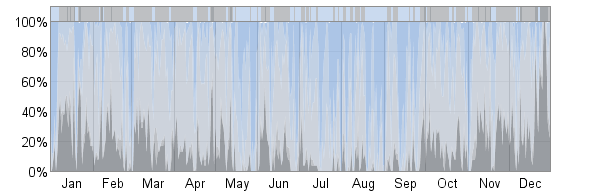
here are graphs which show the results of global satellite cloud percentage measurements over time:


These graphs come from this site:
http://www.climate4you.com/ClimateAndClouds.htm#LowCloudCoverVersusGlobalSurfaceTemperature
The data comes from here: International Satellite Cloud Climatology Project(ISSCP)
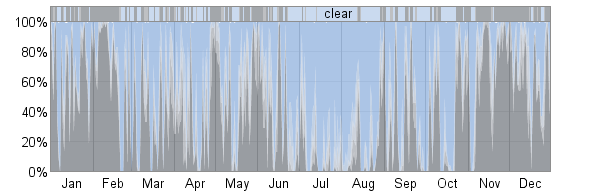
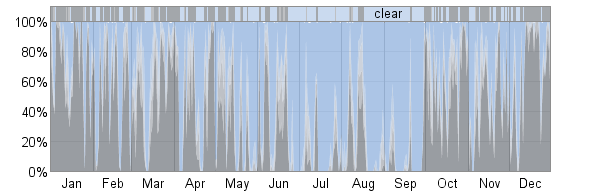
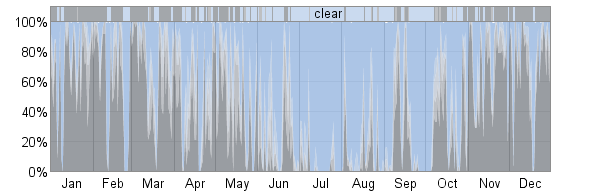
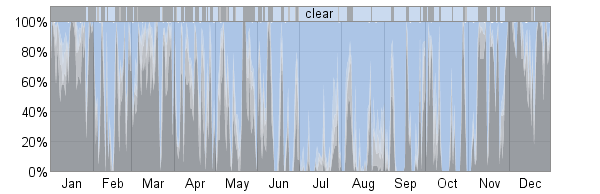
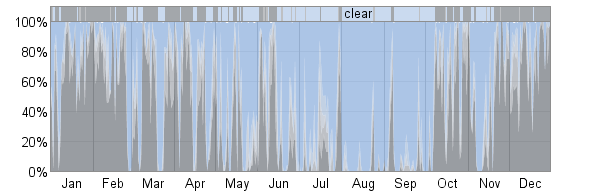
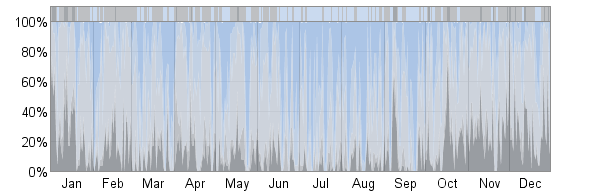
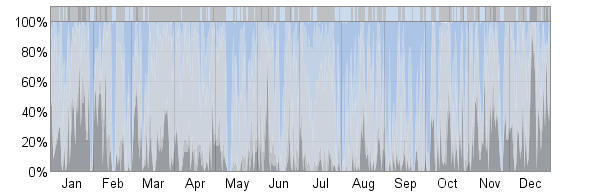
The graphs show the variations in low clouds and high clouds.
Generally, to assess change in a variable over time, one looks at a deviation from the mean level. Here are the deviations:


The first graph shows that averaged globally, since about 1995 low levels clouds have decreased.
The second graph shows that averaged globally, high clouds have increased since about 2007, but are not much different from levels seen in 1986.
There are many other ways to look at the ISSCP data, which you can access here:
http://isccp.giss.nasa.gov/climanal1.html
At the above link you can make your own plots to look at regional differences and other variables within the data set.
Consider for a moment an observer whose memories of totally blue skies tell him that clouds have increased.
If his memories were acquired at different times, he might have good reason to see things differently from a person whose memories came from another time.
If he moved from one place to another with different climate, memories formed at one place might predominate over those from another.
I don't have time to go further into this, but it is grist for thought.
here are graphs which show the results of global satellite cloud percentage measurements over time:
These graphs come from this site:
http://www.climate4you.com/ClimateAndClouds.htm#LowCloudCoverVersusGlobalSurfaceTemperature
The data comes from here: International Satellite Cloud Climatology Project(ISSCP)
The graphs show the variations in low clouds and high clouds.
Generally, to assess change in a variable over time, one looks at a deviation from the mean level. Here are the deviations:
The first graph shows that averaged globally, since about 1995 low levels clouds have decreased.
The second graph shows that averaged globally, high clouds have increased since about 2007, but are not much different from levels seen in 1986.
There are many other ways to look at the ISSCP data, which you can access here:
http://isccp.giss.nasa.gov/climanal1.html
At the above link you can make your own plots to look at regional differences and other variables within the data set.
Consider for a moment an observer whose memories of totally blue skies tell him that clouds have increased.
If his memories were acquired at different times, he might have good reason to see things differently from a person whose memories came from another time.
If he moved from one place to another with different climate, memories formed at one place might predominate over those from another.
I don't have time to go further into this, but it is grist for thought.