
Pepijn van Erp
Member
NIST 'admits' free fall acceleration for 2.25 seconds, but the way they arrived at this conclusion as explained in Section 12.5.3 of the report didn't really convince me. The division in three stages seemed a bit arbitrary and it annoyed me that they don't give any attention to the margin of error.
The issue popped up a couple of times in discussion I had with truthers. Again this week. So I decided to have a closer look at the calculation by NIST and I found it even more questionable than before.
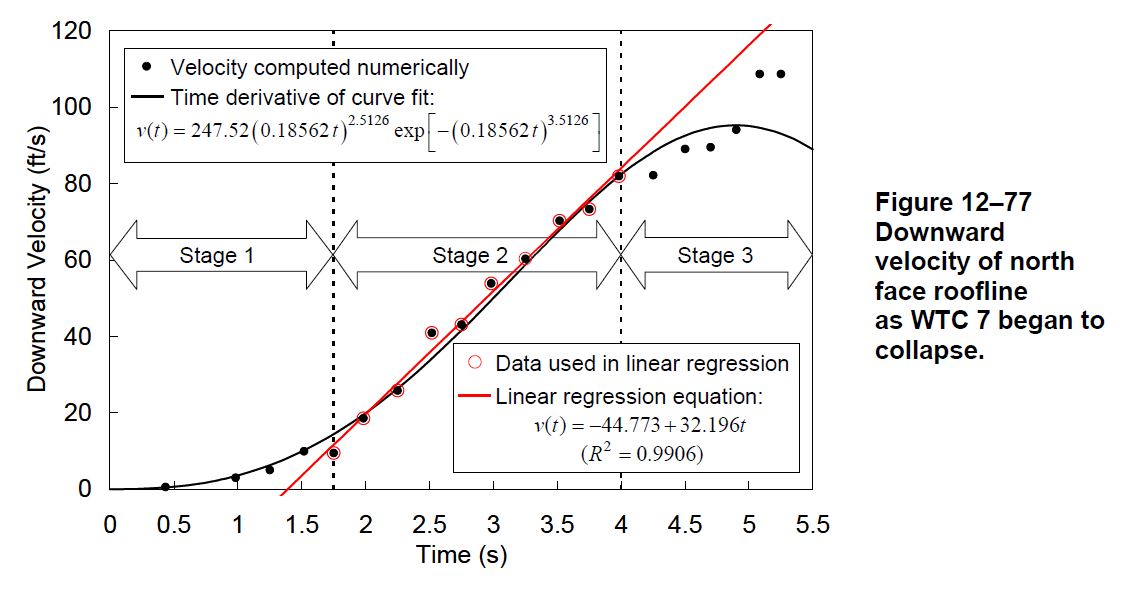
NIST did a linear regression on the 10 velocity data points in Stage 2. However, these velocity data points are derived from 11 data points (time/height) that are the actual measurements made on the video. So NIST defines Stage 2 as running from 1.75s till 4s while the velocity data points they use in the regression are actually based on data points that lie in a wider interval. And the way the calculated these velocity data points is done under the assumption that the speed between two data points is constant, which is not correct.
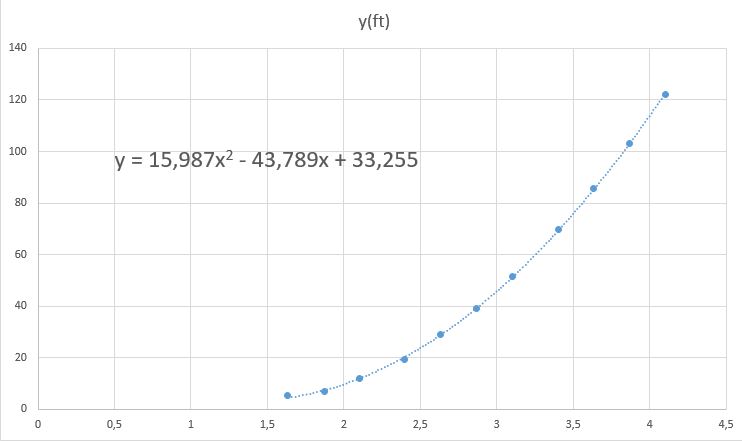
I also wondered why they didn't just do a second-degree polynomial fit on the actual data points because that seems more straightforward. So I tried this myself.
I read off the values from Figure 12-76 as best as I could and then fitted a polynomial through the 11 points running from 1.6s till 4.1s. This gives an acceleration of 9.75 m/s^2. Then I noticed that the first point is quite a bit off the curve and repeated the calculation with leaving this point out and this gives an acceleration of 9.46 m/s^2.
You can read it in more detail on my website: link.
The issue popped up a couple of times in discussion I had with truthers. Again this week. So I decided to have a closer look at the calculation by NIST and I found it even more questionable than before.
NIST did a linear regression on the 10 velocity data points in Stage 2. However, these velocity data points are derived from 11 data points (time/height) that are the actual measurements made on the video. So NIST defines Stage 2 as running from 1.75s till 4s while the velocity data points they use in the regression are actually based on data points that lie in a wider interval. And the way the calculated these velocity data points is done under the assumption that the speed between two data points is constant, which is not correct.
I also wondered why they didn't just do a second-degree polynomial fit on the actual data points because that seems more straightforward. So I tried this myself.
I read off the values from Figure 12-76 as best as I could and then fitted a polynomial through the 11 points running from 1.6s till 4.1s. This gives an acceleration of 9.75 m/s^2. Then I noticed that the first point is quite a bit off the curve and repeated the calculation with leaving this point out and this gives an acceleration of 9.46 m/s^2.
You can read it in more detail on my website: link.
Last edited by a moderator:
