Update …
In the 92 hours since last Sunday afternoon when they upped the outflow rate to 100,000 cfs, officials have dropped the level from 901.65 to 866.75 – a drop of 35 feet. They have released 524,312 acre feet over 92 hours …
Total capacity 3,537,577 minus current level 3,039,414 equals 498,163 current available capacity. That number will increase as they continue outflows.
The avg outflow last 24 hours is appx 6100 ac ft/hour – at 100,000 cfs. Operators have enacted a planned reduction to 85,0000 cfs – due to levels reaching the top of the main spillway intake channel cut – so as not to cause erosion in the intake channel.
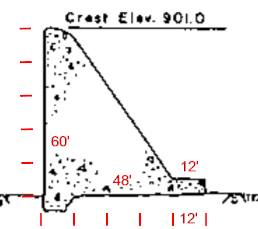
Flood control elevation 850
Capacity at 850' 2,808,349
Maximum capacity at 900' 3,537,577
Reserve at 850 729,228
Current Elevation 866.75
Current capacity 3,039,414
Current reserve 498,163
Estimate in/hr at 85,000 cfs 4.17 inch/hour
Est time to 850' at 85,000 cfs 48.16 hours
(as of 1PM PST - 2/16/17)
During the major rainfall event in early Jan 2017, I believe appx 15 inches fell in the area. During the appx 18 hour peak inflow period on 1/8 and 1/9 inflow rates averaged appx 135,000 cfs with a peak of appx 155,000 cfs.
Significantly increased inflows (60,000 cfs and higher) ran from the morning of 1/8 thru midday 1/11 … reservoir level was appx 793′ on 1/8 and appx 842 midday 1/11 … an increase of appx 49′ … or appx 676,740 acre feet.
There was no appreciable outflow during this entire 3 day period.
We currently have appx 500,000 acre feet of storage available – and should have more than 700,000 by Saturday.
There is currently enough storage to handle nearly 75% of the inflow from the current storm … and even IF it is as STRONG as the January one … in the next 48 hours there should be enough available storage capacity to handle 100% of the inflow from a 15″ January type super storm … without running the spillway at all.
data:
http://cdec.water.ca.gov/cgi-progs/queryF?s=ORO&d=16-Feb-2017+13:39&span=92hours