Follow along with the video below to see how to install our site as a web app on your home screen.
Note: This feature may not be available in some browsers.
MH370 speculation has become excessive recently. Metabunk is not a forum for creating theories by speculation. It's a forum for examining claims, and seeing if they hold up. Please respect this and keep threads on-topic. There are many other forums where speculation is welcome.
The Troubled Graph
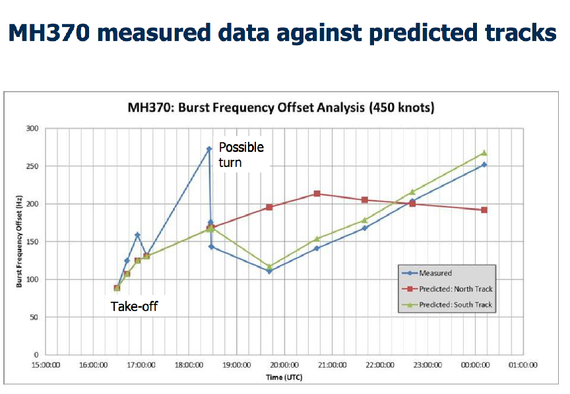
But the graph defies these expectations. Taken at face value, the graph shows the plane moving at a significant speed before it even took off, then movingtoward the satellite every time it was pinged. This interpretation is completely at odds with the official conclusion, and flatly contradicted by other evidence.
The first problem seems rather straightforward to resolve: the reason the frequency shifts aren’t negative is probably that Inmarsat just graphed them as positive. Plotting absolute values is a common practice among engineers, like stating the distance to the ocean floor as a positive depth value rather than a negative elevation value.
But the problem of the large frequency shift before takeoff is more vexing. Exactly how fast does the graph show the plane and satellite moving away from each other prior to takeoff?
The first ping on the graph was sent at 16:30 UTC, eleven minutes prior to takeoff. The graphed frequency shift for this ping is about -85 Hz. Public recordsshow that the signal from the plane to the satellite uses a frequency of 1626 to 1660 MHz. STK calculations show the satellite’s relative motion was just 2 miles per hour toward the airport at this time. Factoring in the satellite’s angle above the horizon, the plane would need to have been moving at least 50 miles per hour on the ground to produce this frequency shift—implausibly high eleven minutes prior to takeoff, when flight transcripts show the plane had just pushed back from the gate and not yet begun to taxi.
On the other side of the frequency graph, the plane’s last ping, at 00:11 UTC, shows a measured frequency shift of about -252 Hz, working out to a plane-to-satellite speed of just 103 miles per hour. But the sample southbound paths published by Inmarsat show the plane receding from the satellite at about 272 miles per hour at this time.
In other words, the frequency shifts are much higher than they should be at the beginning of the graph, and much lower than they should be at the end. Looking at the graph, it’s almost as if there’s something contributing to these frequency shift values other than just the motion between the satellite and the plane.
Does this mean they got it wrong. Also why did the ignore a survey company that said they might have identified the down flight in the straight of Bengal? Now that they've looked over the confined search area where they thought they heard the block box pings and turned up nothing, what comes next.
Because that was impossible according to known science and technology.
But I'm more curious what they determined the observations from the Maldives were if not worth following up.
Because that was impossible according to known science and technology.
But I'm more curious what they determined the observations from the Maldives were if not worth following up.
The difference between this author and other skeptics is he has attempted to explain why he doubt, inviting scrutiny to his logic.
About Maldives, I have always wondered why no journalist has ever bothered flying there to interview the so called witnesses
Why would Inmarsat withhold information months after the craft disappeared?
They are not even responsible for the utilization of their data that led to the present location.