JFDee
Senior Member.
This video has popped up on YouTube:
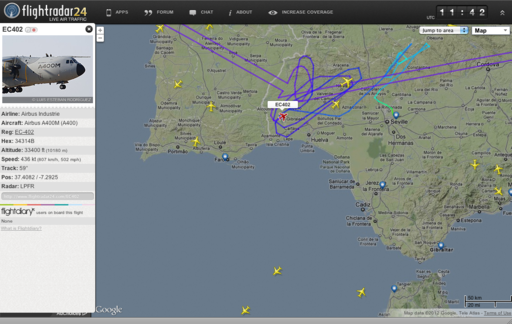
So what is the explanation for these zig-zag lines?
We know flight number (TAY274B) and approximate time, so the historical flight path (in coarse resolution) can be watched on the flightradar24 site. The erratic jumps are starting around this point in time:
http://www.flightradar24.com/#!/2012-10-04/21:10/TAY274B
A plane flying like this would have to defy Newtons laws and the laws of aerodynamic alltogether. This shifts the focus to the displaying software.
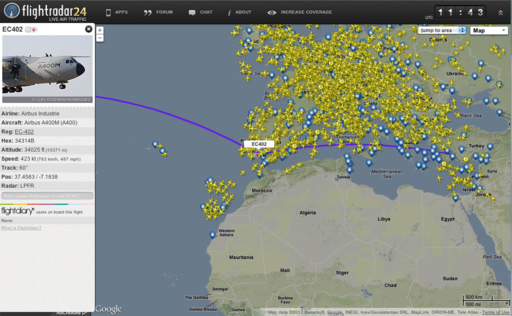
If we continue the historical playback of the flight, annother strange thing happens: the plane is turning straight southward again for a while.

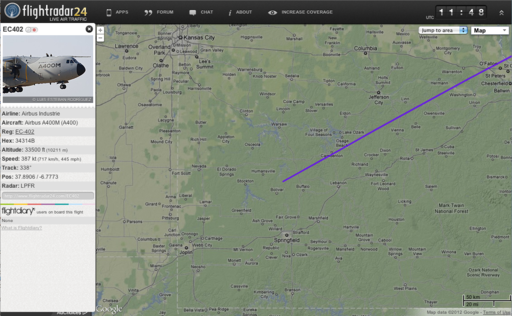
A little while later it jumps back to Northern France and continues northward to England.
Here is what happened: the flight into the opposing direction had already taken off before the northbound one was completed. Two planes, but same flight number. This is confusing the flightradar software, which is a known problem:
[ex=http://forum.flightradar24.com/threads/3298-Multiple-aircraft-with-the-same-flight-number?p=13596&viewfull=1#post13596]FlightRadar24 has a problem if there are two aircraft with the same flight number in the air at the same time.
This probably shouldn't happen, but there is an example. At the time that Air New Zealand flight NZ38 is taking off from LHR (around 2115 local), the previous day's flight is descending into AKL. For about an hour the display flips between the two aircraft creating zig-zag trails across the map.[/ex]
So what is the explanation for these zig-zag lines?
We know flight number (TAY274B) and approximate time, so the historical flight path (in coarse resolution) can be watched on the flightradar24 site. The erratic jumps are starting around this point in time:
http://www.flightradar24.com/#!/2012-10-04/21:10/TAY274B
A plane flying like this would have to defy Newtons laws and the laws of aerodynamic alltogether. This shifts the focus to the displaying software.
If we continue the historical playback of the flight, annother strange thing happens: the plane is turning straight southward again for a while.

A little while later it jumps back to Northern France and continues northward to England.
Here is what happened: the flight into the opposing direction had already taken off before the northbound one was completed. Two planes, but same flight number. This is confusing the flightradar software, which is a known problem:
[ex=http://forum.flightradar24.com/threads/3298-Multiple-aircraft-with-the-same-flight-number?p=13596&viewfull=1#post13596]FlightRadar24 has a problem if there are two aircraft with the same flight number in the air at the same time.
This probably shouldn't happen, but there is an example. At the time that Air New Zealand flight NZ38 is taking off from LHR (around 2115 local), the previous day's flight is descending into AKL. For about an hour the display flips between the two aircraft creating zig-zag trails across the map.[/ex]


