Death Rates in Holmes County, OH. Claimed link with Vaccination Status

Mick West

Administrator
Staff member
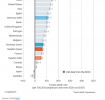
FkCYc9faAAACMYP.png

(source: PLC (Humble_Analysis) on Twitter))

The claim here is that in one county in Ohio with a large (about 42%) Amish community (who generally avoid vaccination) the vaccination rate is low, but the death rate from 2020-2022 is lower than the national average. This observation is contrasted with expectations that a low vaccination rate would increase the death rate, as more. people would die of Covid-19.

The links in the image are
https://www.census.gov/data/tables/time-series/demo/popest/2020s-counties-total.html#par_t
https://data.cdc.gov/Vaccinations/COVID-19-Vaccinations-in-the-United-States-County/8xkx-amqh

Also in the Twitter thread, a link claiming the county has average health:
https://www.usnews.com/news/healthiest-communities/ohio/holmes-county
And they claim it's a bit older than average:
https://www.census.gov/quickfacts/holmescountyohio

The argument concludes:
External Quote:
So, this large rural county in Ohio with average health metrics & average demographics chose to essentially ignore the pandemic - no social distancing, no masks, no vaccines - and nothing much happened. So, was all our hysteria and strife, all of it, ultimately pointless? Yes.
However, Matt Timberlake pointed out that the median age in Holmes County is 30.6, whereas the the national median age is 38.1, so it actually skews way younger. In fact out of the 88 counties in Ohio, it's the 87th youngest (only college town Athens is younger). The median age in Ohio is 39.5
FkCdQ1IVIAA5nfS.jpg

Multiple factors account for different death rates. This appears to be a classic example of very narrow cherry picking, and not taking everything into account.

(Work in progress, I plan to flesh this out a little more)
 
And they claim it's a bit older than average:
https://www.census.gov/quickfacts/holmescountyohio
Data from that source contradicts the claim.
External Quote:

Screenshot_20221217-043220_Samsung Internet.jpg

if we consider that mostly old people die, then 3% from 17.8% is 3/17.8 = 16.9% in Ohio, but 2.5/14.1 = 17.7% in Holmes County. This is very much back-of-the-envelope on incomplete data, but it suggests that "old people mortality" in Holmes has been higher than average during the pandemic.
 
Last edited:
if we consider that mostly old people die, then 3% from 17.8% is 3/17.8 = 16.9% in Ohio, but 2.5/14.1 = 17.7% in Holmes County. This is very much back-of-the-envelope on incomplete data, but it suggests that "old people mortality" in Holmes has been higher than average during the pandemic.
i imagine non amish youth die alot more in driving accidents, binge drinking, maybe suicide etc. i dont think your numbers make sense.
 
an article that needs fact checking:
Article:
According to the county's annual health report for 2021, close to one-quarter of all Holmes County deaths last year were COVID-19 related, compared with a US-wide rate of 13 percent.

....
While officials at the Holmes County Health District declined to speak to Al Jazeera, the total number of reported deaths in 2020 and 2021 in the county rose by nearly a third compared with 2019. As in other communities, that increase is likely attributable to COVID-19.
 
their health site is funky (im going by annual reports, yea about a third? raise)

https://www.holmeshealth.org/data-reports/
3.png


well 76 in 2021 labeled covid (searching to see if that means FROM covid or WITH covid...)
76.png


add: they may be trying to document death FROM covid..kinda hard to tell. i couldnt find text but the numbers suggest "from" covid. this says 2018 but its in the 2019 annual report so i think its a misprint.
sbs.png
 
Last edited:
(Personal observations here, untainted by "lies, damned lies, and statistics".)

I have been in Holmes county a number of times, since it's only an hour's drive from me. I think the key words are "rural" and "Amish". The Amish tend to keep to themselves - in other words, their social interactions are usually with each other rather than with others. That suggests to me that the virus is more likely to have arrived later in the community than it would do in a place with greater admixture of travelers. We all remember how the virus first raged through the large cosmopolitan cities like New York; Holmes county is its opposite.

If that's the case, Covid infection rates and death rates in any particular place depend heavily on the date on which the analysis is done, and the lag time in a relatively isolated community is also reflected in cumulative totals. And published demographic stats have a lag time necessitated by the processes of collecting data and waiting until a specified accounting period is over. I'm sure we've all seen studies in which the latest time data is available is one or several years old.

In other words, the opportunities for cherry-picking abound. Couple that with @Mick West's catch of the comment about the age of residents (more cherry-picking) and I have a good many reasons to be leery of the whole analysis. It smells strongly of a source with an axe to grind.
 
Last edited:
And published demographic stats have a lag time necessitated by the processes of collecting data and waiting until a specified accounting period is over. I'm sure we've all seen studies in which the latest time data is available is one or several years old.
that would apply to both datasets though. (except for the 40 million illegals conservatives say are here, if i add them in i get 2.7% u.s and 2.6% holmes)

But yes he is making up numbers for 2022 rates, based on AP News estimates.

still even without the approx [6-]8 year lower age median, i dont think .34%** decrepancy is much when comparing a group with 44,021 people to a group of 331,900,000 people*

*that number doesnt count the uncounted illegal immigrants.
**i used the APs 3%, the op guy must have used the 7% i didnt check the math for the 7%
(and as always, never trust MY math...run your own numbers)
Article:
Preliminary data — through the first 11 months of the year — indicates 2022 will see fewer deaths than the previous two COVID-19 pandemic years. Current reports suggest deaths may be down about 3% from 2020 and about 7% vs. 2021.
 
Last edited:
that would apply to both datasets though. (except for the 40 million illegals conservatives say are here, if i add them in i get 2.7% u.s and 2.6% holmes)
But the demographics presumably reflect the current population, while the deaths are cumulative. And as I pointed out, that statistic for a community to which the virus came later is going to be lower than the same for a city that was infected earlier.
 
Wouldn't the self imposed isolation of the Amish community possibly be a factor in their low death rate?
 
Wouldn't the self imposed isolation of the Amish community possibly be a factor in their low death rate?
They still got it though, and it obviously spread. Another thing to consider is that the Amish didn't just not get vaccinated, they also seemingly largely ignored masking and social distancing guidelines.
 
What's the obesity rate? Are they less sedentary? Healthier diet? Alcohol use? Opiates?

There are innumerable errors an amateur epidemiologist can make, especially one with an agenda.

Could it be that part of the agenda is an emotional nah ah, you are! kind of thing in reaction to the long standing observation that the MAGA Republicans are killing off their own base with their anti-vax , anti-mask stances?
 
Last edited:
Underscoring the complexity of epidemiology and the disadvantage an amateur epidemiologist faces, this study finds a correlation with governance even when vaccination rate and the social metrics of the population are controlled for.

https://www.sciencedirect.com/science/article/pii/S2667193X22002010
During the study period, the higher the exposure to conservatism across several political metrics, the higher the COVID-19 age-standardized mortality rates, even after taking into account the CD's social characteristics; similar patterns occurred for stress on hospital ICU capacity for Republican trifectas and US Senator political ideology scores. For example, in models mutually adjusting for CD [congressional district] political and social metrics and vaccination rates, Republican trifecta and conservative voter political lean independently remained significantly associated with an 11%–26% higher COVID-19 mortality rate.
Further suggesting our results are plausible is the very small body of US research analyzing population health outcomes – focused on COVID-19, cancer incidence and mortality, other mortality, and opioid prescribing – by US CD, albeit noting that none of these studies included any measures of elected officials' political ideology, alone or in conjunction with state trifecta status or voter political lean.4,5,21,22,25,26 This research demonstrates that health inequities detected with CD data are, not surprisingly, on par with those observed using county-level data. US research has likewise documented associations of state trifectas and extreme gerrymandering (boundaries drawn to ensure political lean) with policies pertaining to obesity, environmental protection, gun control, and other public health measures.4,27 Other descriptive research, specific to COVID-19, has documented that the presence of a unified State-level government (i.e., trifecta) increased the likelihood of being disbursed federal COVID American Rescue Plan Act 2021 funds,10 and that from the beginning of the pandemic, US Congressional representatives have consistently used their newsletters to communicate their views about the pandemic.
Additional descriptive research, at the state and national level in the US, and also in other countries, has documented how political polarization, whether measured by voter political lean, policies passed, or rhetoric deployed, has undermined effective pandemic response.2, 3, 4,7, 8, 9,28 Thus, likely mechanisms causally connecting the range of political variables examined in our study to pandemic impacts plausibly include the roles of federal and state politicians in (a) obtaining and disbursing resources for, and passing or blocking legislation supportive of public health infrastructure, pandemic preparedness, and medical care; (b) facilitating or hindering the range of actions and resources state and local public health departments can deploy; and (c) communicating with, shaping, and responding to the views of their political funders and constituents.2, 3, 4,7, 8, 9, 10, 11,28,29 In the case of COVID-19, the salience of overall political ideology, as reflected in the total record of votes, and not solely COVID-19 votes, and also state-level concentrations of party political power, is that the politics of COVID-19 have become bound with ideological arguments over fiscal policies, social programs, personal freedom, and the extent to which governments can impose mandates on the behaviours of both the private sector and individuals in order to protect the population's health.2, 3, 4,7, 8, 9, 10, 11,28,29

Together, our study findings underscore the critical importance of analyzing and monitoring population health mapped onto meaningful units of political geography and using informative political variables that can aid ascertainment of political accountability. Such data serve a different purpose for monitoring population health and other characteristics compared to more stable administrative geographic units, such as census tracts, which in the US were expressly created in the early 20th century CE to overcome problems with instability of geographic units for population data due to reliance on frequently changing and gerrymandered ward boundaries.30 At issue instead is providing data relevant to informed democratic governance, which requires enabling monitoring improvements, declines, or stasis of population health and health inequities over time in relation to key units of political geography, political ideologies, and concentrations of party political power, which in the US requires attention at both the federal and state-levels.

It could accordingly be useful for US data dashboards that routinely report population health data by county to do likewise by US CDs and, by extension, state and local political districts as well, in conjunction with metrics pertaining to the political ideology of the elected representatives (based on voting records) and the concentration of political power at the state-level (i.e., trifecta). Analogous approaches could be implemented in other countries in relation to their relevant units of political geography and metrics of political ideology and power. Finally, from a policy standpoint, our study and kindred research highlight the necessity of engaging with the politics of health, which is distinct from being "partisan."2, 3, 4,8,28, 29, 30 Instead, what is needed is ongoing monitoring and rigorous analysis of the connections between the actions and votes of elected officials and the health profiles of their constituents and the total population.

This study shows a correlation but doesn't connivingly show what the causation is. It uses the phrase...
... likely mechanisms causally connecting the range of political variables examined in our study to pandemic impacts plausibly include...
This is difficult stuff.
 
Last edited:
Deirdre, you reacted to the above post before I completed it. My continuing bad habit of editing and re-editing after I first push the post reply button is to blame.
 
Deirdre, you reacted to the above post before I completed it. My continuing bad habit of editing and re-editing after I first push the post reply button is to blame.
i thumbed it down because it is off topic. and because MY target audience is conservatives who may believe the OP bunk. so i gave a clear precise actual debunk, then you piss off readers (psychologically provoking them to dig in their heels because of the ad hominems) directly after so they will forget all about the actual debunk and be focused on your attack. yes i see you changed literally the entire comment (to the point very few people know what the first line means, so wont read on..which is fine) but im leaving the dislike because you also edited your prior comment...so i can assume your text in the second comment is building on your first comment attack.
 
Last edited:
Since we are "meta" politicizing this thread now....

as i've proven covid deaths were higher in Holmes County [edit add: data removed by me] than the U.S, and in 2019 Holmes and the U.S both had death rates of 1.4%...the explanation for why Holmes' "all cause" mortality is lower in the OP chart is likely that lockdowns kill people.

Article:
The lockdowns in response to the COVID-19 pandemic contributed to a massive spike in excess deaths in the United States, with a 26% rise in excess deaths among working-age adults.

That figure is significant, because the vast majority of COVID deaths was among elderly people who had more than two chronic illnesses, or comorbidities, suggesting a cause other than COVID-19 itself.

The excess mortality rate for all people over 65 was 18%, according to the study by the National Bureau of Economic Research.
The researchers, Summit News reported, found that while COVID deaths "overwhelmingly afflict senior citizens, absolute numbers of non-Covid excess deaths are similar for each of the 18-44, 45-64, and over-65 age groups."

Conservatively, there were more than 170,000 non-COVID excess deaths in the U.S. through 2020 and 2021, the researchers concluded. But they believe the actual number is closer to 200,000, taking into account as estimated 72,000 "unmeasured Covid deaths."
 
Last edited:
the explanation for why Holmes' "all cause" mortality is lower in the OP chart is likely that lockdowns kill people.
That's a sweeping assumption on your part, one for which data is hard to come by. The article you cite refers approvingly to the "Johns-Hopkins" study, whose methodology and conclusions have been roundly criticized:
External Quote:

Plenty of peer-reviewed studies have found government restrictions early in the pandemic, such as business closures and physical distancing measures, reduced COVID-19 cases and/or mortality, compared with what would have happened without those measures. But conservative news outlets and commentators have seized on a much-criticized, unpublished working paper that concluded "lockdowns" had only a small impact on mortality as definitive evidence the restrictions don't work.
.....
But one working paper posted online in January — and not peer-reviewed — has gotten a lot of attention in conservative circles for its conclusion that "lockdowns have had little to no effect on COVID-19 mortality." The paper, which is an analysis of other studies, has been touted as a "Johns Hopkins University study," but it's not a product of the university's Bloomberg School of Public Health, whose vice dean — among other public health experts — has criticized the paper.
.....
The authors examined seven studies on the impact of more severe restrictions, calculating from those studies that, compared with a policy of recommendations, "lockdowns in Europe and the United States only reduced COVID-19 mortality by 0.2% on average" — the figure that conservatives have cited. But six of the seven studies concluded that lockdown policies helped reduce mortality, and the 0.2% figure is overwhelmingly based on one study that mistakenly estimated the wrong effect, according to economists we consulted.
https://www.factcheck.org/2022/03/s...o-called-lockdowns-and-the-covid-19-pandemic/

Your article also mis-stated the deaths per capita in Sweden, under-reporting it by a factor of about 8, but it's late, and I'm not going to go into that math tonight.
 
That's a sweeping assumption on your part, one for which data is hard to come by.
yea, kinda like the rest of this thread.

The article you cite
off topic ad hominins. color me surprised.

The numbers in my citation are from the National Bureau of Economic Research. and i did look them up, they are supposed to be nonpartisan but writings lean left. You are free to debunk the substance of my comment anytime.
 
also mis-stated the deaths per capita in Sweden,under-reporting it by a factor of about 8
this is still off topic to my original comment, but my articles says
Article:
The Economist magazine, which has assembled mortality data around the world, had a similar U.S. estimate, 199,000, which included unmeasured COVID deaths. That amounts to about 60 persons per 100,000.
...
Their estimate for Sweden, which did not enforce strict lockdowns and mask mandates, is about 33 per 100,000.

The World Health Organization released figures last month indicating Sweden had fewer COVID deaths per capita than much of Europe. The Telegraph of London reported that in 2020 and 2021, the Scandinavian nation had an average excess death rate of 56 per 100,000,


The WHO's "updated" estimates before people complained looks like around 56 per to me
1671423698305.png

1671425248357.png


Article:
In a revision to a technical paper on their methods, researchers cut Germany's pandemic-related deaths estimate by 37%, pulling its excess death rate below those of the United Kingdom and Spain1. They also raised their estimate for Sweden by 19% (see 'Corrected estimates of pandemic death rates').
 
Last edited:
are you referring to your wonderful quote in that link, on how politicizing the virus kills people? or are you referring to your proceeding to politicize the virus stuff in that link?
bold of you to assume I have the power to politicize the pandemic response in the US

my linked post contains
a) a Tedros quote from 4/2020, saying that politicizing the pandemic kills people, (prediction)
b) data that shows politicizing the virus in the US has killed people (confirmation)

the same thing probably happened in Brazil and other countries where the pandemic response was politicized.

countries where the pandemic response isn't politicised are free to simply have public policy follow the science. Politisation means at least one party is going to be somewhat anti-science, which raises the death toll.

Note that I have not made a statement on who caused this politisation (except to say I didn't do it).
 
Last edited:
Their estimate for Sweden, which did not enforce strict lockdowns and mask mandates, is about 33 per 100,000.

The World Health Organization released figures last month indicating Sweden had fewer COVID deaths per capita than much of Europe. The Telegraph of London reported that in 2020 and 2021, the Scandinavian nation had an average excess death rate of 56 per 100,000,
And yet the numbers for Sweden from last week show about 203 deaths per 100,000, a significant difference from either of those values. That's what I mean about cherry-picking, Deirdre, citing a six month old article in support of your position that itself cites even older research, or worse yet, opinion pieces that masquerade as research.
 
And yet the numbers for Sweden from last week show about 203 deaths per 100,000, a significant difference from either of those values. That's what I mean about cherry-picking, Deirdre, citing a six month old article in support of your position that itself cites even older research, or worse yet, opinion pieces that masquerade as research.
my article June 2022 is only talking about (both my quote relating to the US and your quote relating not to the US), 2020 and 2021.

and the topic is excess deaths. I have to assume your number is not excess deaths ( a citation backing up your statement would be nice), because if it is then the WHO is grossly untrustworthy.

If you want to prove the OP's 3% in the US is actually low, or that the 170,000-200,000 in my quote is likely grossly low, that's fine. But you should look for some data.
 
Last edited:
a citation backing up your statement would be nice
Sorry, it's here, with a picture suitable for framing. Covid deaths in Sweden, up to date info. You'd have to go back to 2020 to find numbers similar to those in your citation. These are Covid deaths, not "excess deaths", but in which category a death belongs is, I think, also dependent on the time of reporting, because when a diagnostic test was not available or utilized they were not listed under "cause of death".

Source:https://www.worldometers.info/coronavirus/country/sweden/


5D9AF38B-622A-4F9F-9E8E-174318952B4D.jpeg
 
Last edited:
(Personal observations here, untainted by "lies, damned lies, and statistics".)

I have been in Holmes county a number of times, since it's only an hour's drive from me. I think the key words are "rural" and "Amish". The Amish tend to keep to themselves - in other words, their social interactions are usually with each other rather than with others. That suggests to me that the virus is more likely to have arrived later in the community than it would do in a place with greater admixture of travelers. We all remember how the virus first raged through the large cosmopolitan cities like New York; Holmes county is its opposite.

If that's the case, Covid infection rates and death rates in any particular place depend heavily on the date on which the analysis is done, and the lag time in a relatively isolated community is also reflected in cumulative totals. And published demographic stats have a lag time necessitated by the processes of collecting data and waiting until a specified accounting period is over. I'm sure we've all seen studies in which the latest time data is available is one or several years old.

In other words, the opportunities for cherry-picking abound. Couple that with @Mick West's catch of the comment about the age of residents (more cherry-picking) and I have a good many reasons to be leery of the whole analysis. It smells strongly of a source with an axe to grind.
Article:
External Quote:
Many people think of the Amish as living without. These devout communities, predominantly located in Pennsylvania, Ohio and Indiana, go without cars, TVs, computers, phones or even the electricity needed to run so much of 21st century gadgetry. But what researchers who have studied them have found is what the Amish have a surplus of: good health in late life. The average American life expectancy is currently just under 79 years. Back in 1900, it was only 47, but for early–20th century Amish it was already greater than 70. Over the decades, most Americans have caught up in overall life expectancy, but the Amish still have a significant edge in late-life health, with lower rates of cancer, cardiovascular disease, diabetes and more. So how do they do it?
https://time.com/5159857/amish-people-stay-healthy-in-old-age-heres-their-secret/?amp=true

I found this article a few years back after my wife (a forty year cardiac ICU nurse) and I visited Holmes Co. While we were eating in an Amish "family style" restaurant, I noted to her I saw no obese Amish, and how spry the older Amish we saw were. She proceeded to tell me the Amish were healthier than average Americans due to lifestyle and genetics. The article above confirmed everything she told me, and further added the fact tobacco use was rare among them.

So if the Amish are in better health with fewer comorbidities, especially late in life where COVID took a toll on seniors, doesn't it stand to reason their resistance is better and the impact on those who caught it less?
 
Last edited:
These are Covid deaths, not "excess deaths", but in which category a death belongs is,
agree. and if those are covid only and doesnt include non-covid excess deaths...then the WHo is grossly incompetent. YOu just blew my mind.

edit: cut data previously posted in this comment. ..the Economist (i quoted originally) excluded covid deaths in their numbers
 

Attachments

  • u.s.png
    u.s.png
    117.3 KB · Views: 102
Last edited:
So if the Amish are in better health, especially late in life where COVID took a toll on seniors, doesn't it stand to reason their resistance is better and the impact on those who caught it less?
the AMish are only 42% of Holmes county, the rest of them have pretty bad health stats according to the link the OP twitter user gave.... if we assume 42% of the county is fairly healthy..the rest of the county must be responsible for these numbers ??

28.9%smoke (vs 20% of US) (and if amish dont smoke then 60% of the non amish county smoke)
23.6% no health insurance (vs 11% US)
oddly life expectancy is higher than US average
they do have lower cancer but higher heart disease (7.2 vs the US 6.1)
1671471237482.png

https://www.usnews.com/news/healthiest-communities/ohio/holmes-county
 
(and if amish dont smoke then 60% of the non amish county smoke)


small study of 134 in 2008:

Article:
Purpose: The objective of this study was to estimate tobacco use prevalence among the Amish in Holmes County, Ohio, using both self-report and a biochemical marker of nicotine exposure.
...
The prevalence of tobacco use among Amish men was 17.6%


a larger study in 2013
1671477955985.png

https://www.jstor.org/stable/26768024#:~:text=Only a few small studies,et al., 2008).
 
These are Covid deaths, not "excess deaths"
https://www.folkhalsomyndigheten.se...istik-och-analyser/bekraftade-fall-i-sverige/
Statistiken visar antalet personer med laboratoriebekräftad covid-19 som avlidit, oavsett dödsorsak, och är rapporterade som avlidna i databasen SmiNet. Dödsfallen har antingen rapporterats avlidna av behandlande läkare eller avlidit enligt folkbokföringen inom 30 dagar efter en covid-19 diagnos. I ett begränsat antal fall kan det vara känt av Smittskyddsenheten att dödsorsaken inte varit relaterad till covid-19 och då tas dödsfallet bort ur statistiken.

Google translate:
The statistics show the number of people with laboratory-confirmed covid-19 who have died, regardless of the cause of death, and are reported as deceased in the SmiNet database. The deaths have either been reported as deceased by the attending physician or died according to the civil registry within 30 days of a covid-19 diagnosis. In a limited number of cases, it may be known by the Infection Control Unit that the cause of death was not related to covid-19 and then the death is removed from the statistics.
 
The statistics show the number of people with laboratory-confirmed covid-19 who have died, regardless of the cause of death, and are reported as deceased in the SmiNet database.
I read a discussion of this (sorry, it was about a year or more ago, so I can't remember where, but it was a time that the Covid-deniers latched on to a conspiracy theory that said "Look, all these people died of heart failure, not Covid") in which a doctor said that he almost never signed a death certificate with only one cause. Heart stopped = dead. Heart stopped with diabetes = dead. Heart stopped with hypertension, cancer, Covid, COPD, and ulcers = dead. Even if the person dies on a ventilator in a Covid isolation ward, there is not going to be a single cause of death listed.
 
I read a discussion of this (sorry, it was about a year or more ago, so I can't remember where, but it was a time that the Covid-deniers latched on to a conspiracy theory that said "Look, all these people died of heart failure, not Covid") in which a doctor said that he almost never signed a death certificate with only one cause. Heart stopped = dead. Heart stopped with diabetes = dead. Heart stopped with hypertension, cancer, Covid, COPD, and ulcers = dead. Even if the person dies on a ventilator in a Covid isolation ward, there is not going to be a single cause of death listed.
I remember an interview with some medico who said something along the lines of "all death certificates that show covid as the cause of death have been incorrectly filled in". The logic being that the proximal cause of death was lack of oxygen to the brain because oxygenated blood flow had stopped. What may have caused that was cardiac arrest. What may have caused that was one of several specific heart-related issue. And what may have caused that may have been covid. And that's the order they should be listed in. If it's first on the list, they've messed up. Complaining that there are so few "covid as the cause of death" certificates is a complaint about the mistake not being made enough, and that's one of the lines deniers did parrot for a while. However, they also complained about there being too much covid on death certificates because they were confusing the "cause" section from the "other findings" section. It was hard to keep up, everything was seen as proof of something nefarious.
 
It was hard to keep up, everything was seen as proof of something nefarious.
everything was seen as something nefarious by everybody. personally i'm still frustrated our covid hospitalizations are "people in hospital who happen to have covid", i want to know how many people are in FOR covid so i can get an idea of how the old people and unhealthy are fairing. I already know a general case count in my state (VERY general as i think very few gtting tested these days).

The truth is the topic is fascinating ..the topic of what we should do in the next pandemic... and we have all this data with different countries and different states doing different things and giving us real world data. EVERYBODY did things wrong. The finger pointing 3 years later does not advance the conversation, it just continues to vilify each other (vilifies the anti-vaxxers and the pro-lockdowners) and when the next pandemic has the fatality rate of the first SARS and the spread of the 2nd SARS humanity is F*ed if we don't stop all this divisiveness.

Luckily there are scientists who are objectively looking at the facts so we can be better prepared for the next pandemic. Unluckily i think the public and politicians will ignore the objective facts they deduce because divisiveness still rules the day.
 
most people who died "with" Covid wouldn't have died then without Covid, even if Covid was "merely" the proverbial straw that broke the camel's back. the other cases have either been struck from the statistics (e.g. "died in a car accident"), or they're exceptions and not statistically relevant.

There is no other cause that has been shown to explain the excess mortality following Covid waves.

We did discuss this in the covid statistics thread, I believe.
 
to explain the excess mortality following Covid waves.

We did discuss this in the covid statistics thread, I believe.
i haven't seen any one break down data of excess deaths specifically during covid waves (and a month after) vs lower covid timeframes. i've never even heard anyone voice the idea of comparing. that would also be interesting information for researchers to look at.

Medical researchers may be looking at it because i know doctors are upset that people went without preventive care and checkups because they were afraid to go to hospital or doctors offices, esp that first year.

Article:
03 Jun 2020
Topic(s):Acute Cardiac Care
The number of heart attack patients seeking urgent hospital care has dropped by more than 50% during the COVID-19 outbreak, according to an extensive worldwide survey by the European Society of Cardiology (ESC). The findings are published in European Heart Journal – Quality of Care and Clinical Outcomes (EHJ–QCCO)1 and shown graphically online.

"This is the strongest evidence yet of the collateral damage caused by the pandemic. Fear of catching the coronavirus means even people in the midst of a life-threatening heart attack are too afraid to go to hospital for life-saving treatment. There has been a lack of public reassurance that every effort has been made to provide clean hospital areas for non-COVID-19 patients," said ESC President Professor Barbara Casadei.


*note: i disagree with their assessment about a lack of reassurance. i saw tons of reassurance...i just didnt believe them that those efforts meant "safe enough" :)
 
I read a discussion of this (sorry, it was about a year or more ago, so I can't remember where, but it was a time that the Covid-deniers latched on to a conspiracy theory that said "Look, all these people died of heart failure, not Covid") in which a doctor said that he almost never signed a death certificate with only one cause. Heart stopped = dead. Heart stopped with diabetes = dead. Heart stopped with hypertension, cancer, Covid, COPD, and ulcers = dead. Even if the person dies on a ventilator in a Covid isolation ward, there is not going to be a single cause of death listed.
My wife and daughter, both cardiac ICU nurses, have told me the same thing.
 
i haven't seen any one break down data of excess deaths specifically during covid waves (and a month after) vs lower covid timeframes. i've never even heard anyone voice the idea of comparing. that would also be interesting information for researchers to look at.

Medical researchers may be looking at it because i know doctors are upset that people went without preventive care and checkups because they were afraid to go to hospital or doctors offices, esp that first year.

if they ever do a study it would be also interesting if they could figure out how many people wanted to go to various services but were denied because staff/doctors were ill themselves.

there was also likely some collateral damage because people would not provide services if they suspected someone had covid, but there were no rapid tests available early enough.

from personal experience we had a family illness during a hot spell and the AC was making some really bad noise and we could not get it fixed because the AC repair people were worried that someone had covid (weeks later the test we could get came back negative), finally we could have someone fix the AC and we could use it again without the horrible noise, but the added heat stress could have tipped someone into dying had they been worse. it was a horrible experience to go through and rediculous (because none of the symptoms were like a Covid infection).
 
Back
Top