Contrails in satellite images pre-1995

cmnit

Member
Hi all,

after a heated chat with a chemtrailer, and looking at so many misinformed satellite images on their sites showing contrails, I would like to get some of these satellite images but before the 1995 "big bang" year.
I am sure there are some, although resolution was not so good at that time, and maybe I have seen some link about this but I can't recall where.

Help, anyone?
 
Before the internet...and before "chemtrails", most likely the only people concerned with contrails via satellite images were scientists studying contrails and climate etc. So, scholarly articles on contrails from before 1995 is probably your best source for satellite images.

Here are 2 examples:

"A Satellite-Based Climatic Description of Jet Aircraft Contrails and Associations with
Atmospheric Conditions, 1977–79"


http://journals.ametsoc.org/doi/pdf/10.1175/1520-0450(2000)039<1434:ASBCDO>2.0.CO;2

20140819-103444-2575o.jpg

"Jet Contrails and Cirrus Cloud: A Feasibility Study Employing High-Resolution Satellite Imagery" (1986)

http://journals.ametsoc.org/doi/pdf/10.1175/1520-0477(1986)067<0301:JCACCA>2.0.CO;2
20140819-103531-f9abr.jpg
PS: Thanks to whomever embedded the photos :)
 
Last edited by a moderator:
Thanks!
It would be even better to know some online image archive from met or remote sensing satellites,
since I am specifically looking for long contrails testing ISSR (Ice SuperSaturatioon Region) which are quite studied nowadays, but not well known in the past.
The point is that the specific chemtheorist I was arguing against, came out with a max range of 28 km for a contrail, quoting an old Air Force manual for pilots, while I am sure having seen contrails on modern satellite imaging which span about 1000 km.
I am aware of the SAC theory and of the fact that modern jet engines with higher efficiency favor the formation of contrails, but I still have to figure out how this fact could affect the total lenght of a persistent contrail given a certain ISSR pattern.
To conclude, ISSR are even simulated quite successfully nowadays. You can search on Google Scholar for this.
 
The source is quoted in this tweet which includes a translation into Italian:


The Camouflage Handbook, Air Force Wright Aeronautical Lab, 1986, ch.1-12.
 
The source is quoted in this tweet which includes a translation into Italian:


The Camouflage Handbook, Air Force Wright Aeronautical Lab, 1986, ch.1-12.


Well the source might be quoated but I'm struggling to find a copy of it online and I can only find that text on chemtrail conspiracy sites.
 
Just a quick and rough job but I've overlaid that satellite image onto Google Maps to get a measure of the contrails. I chose a long "fresh" trail", but the older one that has spread is longer, of course. Still this one is well over 200 miles long.

output_WDBLJr.gif
 
The source is quoted in this tweet which includes a translation into Italian:


The Camouflage Handbook, Air Force Wright Aeronautical Lab, 1986, ch.1-12.


But it does not say a max range of 28km, it says a typical contrail varies from 9 to 28km. The source seems a little vague (camouflage handbook?), and there are lots of atypical contrails.

Saying what is typical does not place any limits on anything.
 
I am aware of the SAC theory and of the fact that modern jet engines with higher efficiency favor the formation of contrails, but I still have to figure out how this fact could affect the total lenght of a persistent contrail given a certain ISSR pattern.

In general it would not affect it in a significant way, maybe 5% variance on average.
 
Just a quick and rough job but I've overlaid that satellite image onto Google Maps to get a measure of the contrails. I chose a long "fresh" trail", but the older one that has spread is longer, of course. Still this one is well over 200 miles long.

output_WDBLJr.gif

Great job thanks!
Google saves your day over and over again ...
 
But it does not say a max range of 28km, it says a typical contrail varies from 9 to 28km. The source seems a little vague (camouflage handbook?), and there are lots of atypical contrails.

Saying what is typical does not place any limits on anything.

Yes sure, this was my main line of reply to him.
 
Yes sure, this was my main line of reply to him.

It's worth noting that at cruising speed (say 900 km/hr), for a contrail to be only 9km long it could only last for 1/100 of an hour, or 36 seconds. A 28km-long trail would have to dissipate within 112 seconds, or less than two minutes.

It seems to me that this source was talking about non-persistent contrails.
 
NOAA has a comprehensive but cumbersome archive of satellite image, going back to 1979 via their CLASS service:

http://www.nsof.class.noaa.gov/saa/products/welcome

In particular I've been looking at their AVHRR products, as they seem to be what was used in the book Spacious Skies, which has some excellent photos - mostly of cloud structures, but some with contrails, like this 1982 example:
20161005-144326-vc9sg.jpg

I'd like to look at the originals of these, so I'm trying to figure out how to download the raw data and convert it into an image. The above is dated 26/4/82 15:10/13:39

Searching that area and region gives stuff like:
upload_2016-10-5_14-54-55.png

This gives you some thumbnails, and this one does actually match the image from the book (different projection)
20161005-145700-bglv0.jpg


And here's the region with the contrails. You can't really see them in the thumbnails.
20161005-150124-dkwh8.jpg


To get the full resolution images it seems you need to download and convert the raw data which is in some AVHRR specific format.

To download the data you just need to get an account, then you submit requests for the files you want, they are extracted and they send you a link in a few minutes. I have not yet figured out how to actually convert them into images.


Swathviewer has some data going back to 1993, but can't seem to load files.
http://www.gina.alaska.edu/data/satellite/avhrr
 

Attachments

  • 20161005-145437-rxpc7.jpg
    20161005-145437-rxpc7.jpg
    194.6 KB · Views: 481
Last edited:
I wonder if some of those old images would be useful for a debunk of Dane's latest post?

http://www.geoengineeringwatch.org/...eveals-shocking-proof-of-climate-engineering/

He uses lots of pictures of rippled clouds, not even contrails:


and claims that they are evidence of geoengineering:

[bunk] These images provide shocking and undeniable proof of the ongoing global climate engineering/geoengineering/solar radiation management assault on our planet and its life support systems. Highly toxic heavy metals and chemicals (that are systematically sprayed into our atmosphere from jet aircraft as part of the geoengineering/SRM programs) are manipulated with extremely powerful radio frequency signals.[/bunk]
 
You can try searching NASA imagery from the Space shuttles. Some years ago I did a keyword search and saw many contrails that way.
 
It's rather frustrating that all that imagery is there, but one needs some rather archaic or expensive tools to access it. It seems like there should be something like WorldViewer, but for historical imagery.
 
It's rather frustrating that all that imagery is there, but one needs some rather archaic or expensive tools to access it. It seems like there should be something like WorldViewer, but for historical imagery.

If only we knew of some computer uber geek who could put it together... :rolleyes:
 
Trailblazer said:
I wonder if some of those old images would be useful for a debunk of Dane's latest post?
http://www.geoengineeringwatch.org/...eveals-shocking-proof-of-climate-engineering/
He uses lots of pictures of rippled clouds, not even contrails:
and claims that they are evidence of geoengineering:

I looked over Dane's images, and found one of the originals at NASA:
http://www.livescience.com/55413-gravity-wave-clouds-off-africa-photo.html

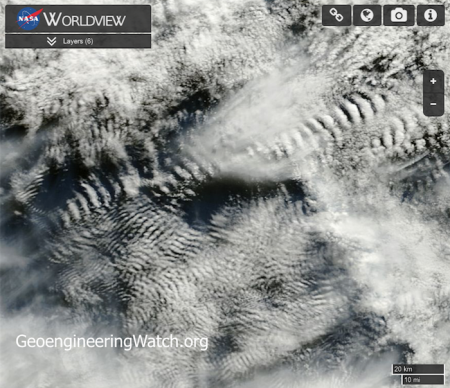
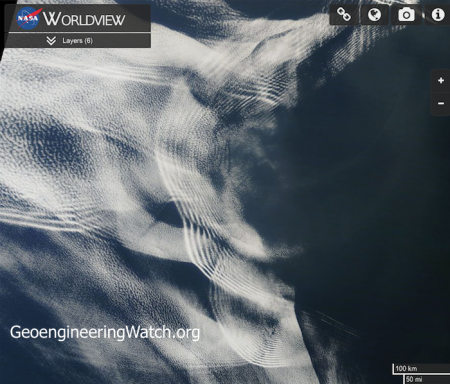
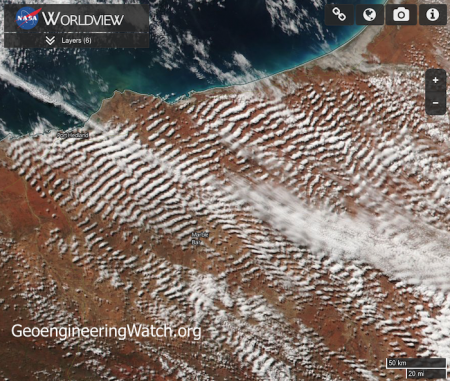
The image, taken June 26 by an instrument on NASA's Terra satellite, highlights the atmospheric patterns off the coast of West Africa. The clouds are called gravity waves, which form as gravity and buoyancy try to balance each other out. (Gravity waves are different than gravitational waves, which are ripples in space-time.)

According to NASA's Earth Observatory, the culprit here is dry, cool air moving out of the nighttime Namib desert and over the ocean. This cool air pushes the humid and warm ocean air up (there's the buoyancy part of the equation). As the moisture rises and condenses to form clouds, gravity pushes it back down, where it hits the rising column of dry air and gets hoisted up again. (A similar push-and-pull occurs at the ocean's surface because of the interactions of wind and gravity.)

The ripple-like clouds seen in this image represent the peaks of the gravity waves, where the moisture in the air condenses. The clear skies between the peaks are the troughs of the gravity waves.

On the day the Moderate Resolution Imaging Spectroradiometer on the Terra satellite captured this image, winds were creating gravity waves in all different directions, Bastiaan van Diedenhoven, who researches ice-containing clouds at NASA's Goddard Space Flight Center, told the Earth Observatory. The result was a complicated pattern of crisscrossing clouds curving across at least 620 miles (1,000 kilometers). These patterns are often seen off Angola and Namibia in the morning and early afternoon, van Diedenhoven told the Earth Observatory, and tend to be pushed out to sea as the day goes on.
Content from External Source
Here is the original photo of the area which Dane cropped from:

Danetrick.jpg

What becomes obvious if you look at the original image is that the clouds moving off the coast replicate the coastline itself! It becomes clear that the coastline itself initiated the clouds, and gravity waves and winds are responsible for the ripples, not something frightening at all but perhaps awe inspiring.

I think that in Dane's mind he understood that folks might make that connection, and much more certainly if he had dared to show the link and risk his followers understanding more than his scaremongering.

It is rather like 'quoting out of context', but perhaps in Dane's mind he excused it as 'effective presentation';)
 
I don't know why some people think "wavy cloud = HAARP". Is it so hard to accept that air has waves, too?
And in Dane's mind: "I don't understand it --> it must be from geoengineering".
 
He did not crop from that photo. His images are screenshots from NASA Worldview.
Agreed, but the NASA site did record an image of the same area at the same time.
I don't know why some people think "wavy cloud = HAARP". Is it so hard to accept that air has waves, too?
And in Dane's mind: "I don't understand it --> it must be from geoengineering".
In the webpage Dane wrote:

SpaceWeather.com has labeled these as "gravity waves", but is that what these visible "waves" actually are? The satellite photos already shown in this post inarguably reveal heavy atmospheric manipulation from extremely powerful radio frequency/microwave transmissions and atmospheric aerosols.
Content from External Source
So, he asks a leading question, then hand waves that the subject is "inarguably" not gravity waves without saying anything further about gravity waves!

Maybe he didn't want to "confuse the issue" by introducing an argument from facts....;)

He did the same thing with "Ship Tracks" in 2012 and even though he's been informed about it nearly five years ago hasn't corrected it.
Debunked: Ship Trails Over the Pacific are Geoengineering "Chemtrails"
 
Back
Top