Calculator for RHi and Contrail Persistence Criteria

Mick West

Administrator
Staff member

I've started on a calculator to convert RHw (relative humidity with respect to water) to RHi (relative humidity with respect to ice).

https://www.metabunk.org/rh

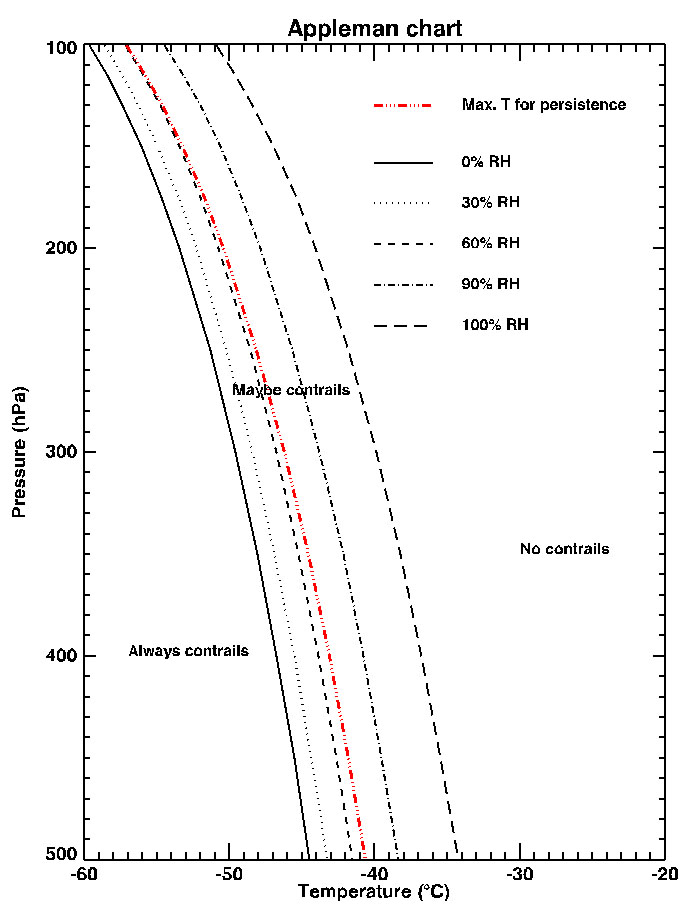
Currently it just takes RHw, temperature and pressure, and then gives you the RHi, and the value of RHw at which RHi is 100% (i.e. the value at which contrails will persist)

Note the pressure has very little effect, the relationship is more one of temperature.

I will expand this calculator to make it more useful

Here's the code I use to convert RHW to RHI based on pressure and temp:
Code:
# convert RHw to RHi, as per
# http://www.esrl.noaa.gov/psd/people/ola.persson/polar_studies/refereed/Ice_sat_2000JC000411.pdf
# But see http://cires.colorado.edu/~voemel/vp.html
# ta = temperature of atmosphere, in Celsius
# p = pressure in hPa (hectopascals), which are the same as mb (millibars)
# note this is defined as accurate from -0C to -50C, but it's unclear how inaccurate it is
# at temperatures below -50C
def rhw2rhi(rh, ta, p)
	  e_sat_w_Ta = (1.0007 + 0.00000346 * p)*6.1121*Math.exp((17.966*ta)/(247.15+ta));
	  e_sat_i_Ta = (1.0003 + 0.00000418 * p)*6.1115*Math.exp((22.452*ta)/(272.55+ta));
	  return rh * (e_sat_w_Ta/e_sat_i_Ta);
end

From:
http://www.esrl.noaa.gov/psd/people/ola.persson/polar_studies/refereed/Ice_sat_2000JC000411.pdf


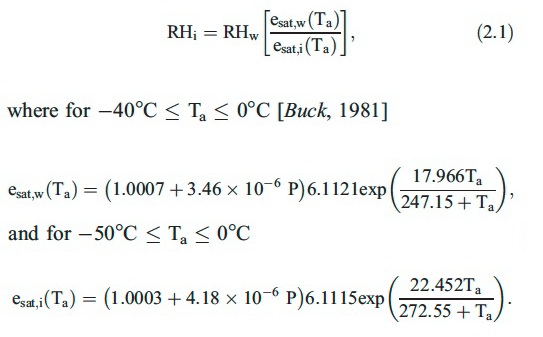
Note there seem to be several different ways of calculating the saturation vapor pressure.

The equations above are known as the Arden Buck equations, and come from Buck 1981 - New Equations for Computing Vapor Pressure and Enhancement Factor. They are what as know as "empirical" equations, in that they are simply designed to most closely fit the numbers observed in experiments, and the equations themselves do not necessarily have any really relationship to what is going on in the real physical world. The paper details how the experiments were carried out, and how the equations were worked out.

Essentially they are an approximation (over particular ranges of T) of formulae given by Wexler,

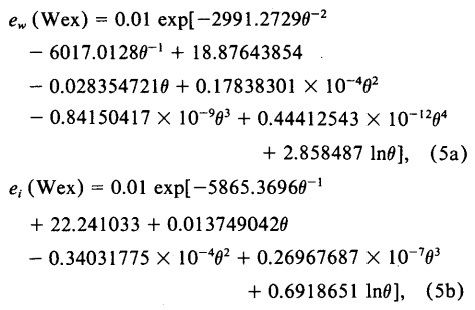
(Where θ is the temperature in Kelvin and exp and ln are natural exponent and logarithms)

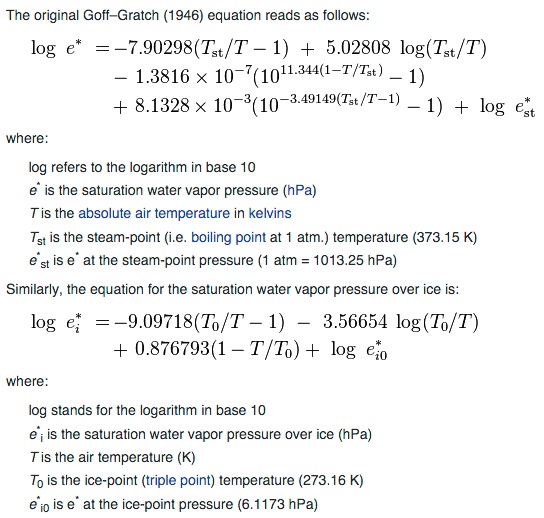
Wexler's formulae in turn are derived from a variety of measurement made in the 1970s, after the older (and less accurate) Goff-Gratch equations were derived.

https://en.wikipedia.org/wiki/Goff–Gratch_equation


Several other different approximations are found here:
http://faculty.eas.ualberta.ca/jdwilson/EAS372_13/Vomel_CIRES_satvpformulae.html

But ultimately these are all just approximation to actual real world data. You could equally take the value from a table (interpolating for intermediate values, fractions of degrees), and get the same, or more accurate result, and computationally it would probably be faster.
 

Attachments

  • Buck 1981 - New Equations for Computing Vapor Pressure and Enhancement Factor.pdf
    350.4 KB · Views: 1,247
Last edited:
I've made it embeddable with [rhcalc].[/rhcalc], and added an interactive graph. You can drag the (Temperatre,RHw) around and see the RHi value move. The two lines are the ice supersaturation lines for RHi (the striaght line, just RHi = 100) and RHw (the curve, which is RHw when RHi = 100).

See OP for embedded calculator.
 
For descriptive reasons, it would be great to display altitude (standard atmosphere) related to the selected pressure - probably as a separate text label or even an editable text field (with a disclaimer attached).
 
For descriptive reasons, it would be great to display altitude (standard atmosphere) related to the selected pressure - probably as a separate text label or even an editable text field (with a disclaimer).

But the thing is, pressure does not make any significant different to the relationship between RHw and RHi. If you put in 0 or 1000 it only makes a different of about 0.05% in the calculated RHi values.

I believe this is to do with the very low compressibility of liquid water. Note the very small multipliers for pressure
20160113-122614-g8v4z.jpg
 
Last edited:
But the thing is, pressure does not make any significant different to the relationship between RHw and RHi.
Even so, there is a scale and an entry field for pressure values. It would just be a tad less abstract when it's illustrated that pressure is directly related to altitude.
 
Even so, there is a scale and an entry field for pressure values. It would just be a tad less abstract when it's illustrated that pressure is directly related to altitude.

Oops, that scale should be RH%, not mb. Fixed.
 
Given the slope of the line is pretty flat from -50 to -40°C, we can derive a simple formula for converting RHw to RHi that works for most contrail conditions.

RHi = RHw * (0.89 - (0.0148 * t))

This is accurate to about 0.1% between -50 and -40, and 1% between -70 and -30.

While using the full calculator would be best, this still might be useful if you want to provide a simple answer to the question "how do you convert RHw to RHi?"
 
And perhaps an even more useful question that we can derived a heuristic for is "What relative humidity is required for contrail persistence". Normally this is given as either "above 70%", or the somewhat more accurate "between 60% and 70%". But if we rearrange the above simple formula

RHi = RHw * (0.89 - (0.0148 * t))

to express RHw in terms of RHi:

RHw = RHi / ( 0.89 - (0.0148 * t) )

The add in the condition for persistence (RHi >= 100)

We get

RHw >= 100/( 0.89 - (0.0148 * t))
(Accurate within 1% for -70°C < t < -30°C)

20160117-093043-yy947.jpg
 
I modified the calculator to use the more accurate Wexler formula

Only makes about 0.5% difference over useful range, but better to have the correct formula. Code might be useful for someone:
Code:
	// These are the Wexler functions as described in Buck 1981
	function e_sat_w_wex(t,p) {
		// Wexler uses t in Kelvin, so convert from C
		// p is ignored
		t += 273.15;

		return 0.01 * exp( -2991.2729*pow(t,-2)
				- 6017.0128*pow(t,-1) + 18.87643854
				-0.028354721*t + 0.17838301*0.0001*pow(t,2)
				-0.84150417 * 0.000000001*pow(t,3) + 0.44412543*0.000000000001*pow(t,4)
					+ 2.858487 * Math.log(t));
	}

	function e_sat_i_wex(t,p) {
		// Wexler uses t in Kelvin, so convert from C
		// p is ignored
		t += 273.15;
		return 0.01 * exp(-5865.369*pow(t,-1)
				+ 22.241033 + 0.013749042*t
				- 0.34031775 * 0.0001 * pow(t,2) + 0.26967687*0.0000001*pow(t,3)
						+ 0.6918651 * Math.log(t));
	}
 
The above is focussed on calculating the point at which air is ice-supersaturated. i.e. the point at which contrails persist because the ice crystals cannot sublimate back into vapor.

I think it would be useful to develop interactive versions of all the graphs that are commonly used when explaining contrail formation and persistence. In particular the Appleman chart and the mixing line chart.

@Ross Marsden, you generated mixing line charts before:
The third pose of this chart represents the jet exhaust gasses mixing with the environment and forming an persistent contrail.
The mixture condenses where the temperature is about -36°C (in this case). The droplets of supercooled water freeze by various processes, as in the pose above.
Mixing continues out of the water saturation zone with no change since it's all ice particles/crystals.
Mixing continues towards the environment condition which is in this case is in side the ice-supersaturated zone.
Now the ice cannot evaporate - the air is already ice saturated. So the contrail persists, and the individual ice crystals grow in size by the deposition of the surplus water vapour directly onto the ice.

Do you still have the code and/or parameters used for this? In particular the "Jet Engine" point (off the chart). The blue lines are the equilibrium vapor pressure for water and ice, for which I can use the Wexler or Buck equations.

@skephu, in the video you posted, there are some nice illustrations of the mixing line.
upload_2016-1-20_8-10-50.png

Do you know how these illustrations were generated? Is there code?

And then the Appleman chart.


Does anyone happen to have the actual equation for the curves there and how the contrail factor is included.

Then there's newer versions, as in this post:
This post is about contrails formation and prediction of this phenomena.

The original paper by Schrader (http://journals.ametsoc.org/doi/abs/10.1175/1520-0450(1997)036<1725:COACFC>2.0.CO;2 - Calculations of Aircraft Contrail Formation Critical Temperatures) gives us tables of critical temperatures for different pressures, relative humidities and contrail factors. But it's only from 30 to 500 mb, lower levels are not included. The calculations are based on Goff-Gratch equation of saturation water vapor pressure. The provided source code and EXE file can help us to calculate Tcrit for any pressure level. The es​(T) function and des​/dT derivative are computed from Murphy-Koop formula, which is based on more recent data.

http://yadi.sk/d/hy75Iz934i-lO (Pascal source code)
http://yadi.sk/d/R0lQhzeE4i05K (EXE file)

Unfortunately the links are broken, @CbIncus, I know you've not been back since 2013, but do you still have the code?
 
I used this formula for the vapor pressure:
found here: www.srh.noaa.gov/images/epz/wxcalc/vaporPressure.pdf

Then this was converted to mixing ratio:
found here: www.srh.noaa.gov/images/epz/wxcalc/mixingRatio.pdf

edit: I don't know why my pasted images do not appear!

Images sometimes take a while to upload after they are pasted, so if you post too quick they don't show up.

Were the values you use for the initial temperature and mixing ratio (mass ratio of water to air) just for illustration, or were any of them real numbers from somewhere?
 
Were the values you use for the initial temperature and mixing ratio (mass ratio of water to air) just for illustration, or were any of them real numbers from somewhere?
Temperatures for a high-bypass engine were taken from here:
Kärcher B, Hirschberg MM, Fabian P. Small‐scale chemical evolution of aircraft exhaust species at cruising altitudes. Journal of Geophysical Research: Atmospheres (1984–2012). 1996 Jun 27;101(D10):15169-90.

Table 3 contains temperatures, fuel flow, air flow, etc. (sorry, pasting images just doesn't work for me).
But for the graph you included above, the temperatures are increased a bit because it shows the case where the efficiencies of a high-bypass and a non-bypass engine are identical.
For the non-bypass engine, the temperature was calculated from the high-bypass data assuming that all the heat heats the core flow.
I don't remember now where the initial mixing ratio came from but that is also based on real data. Basically it can be calculated from the fuel flow, emission index of water, and air flow.
 
Thanks for the calculator. I just want to make sure I'm understanding, and sorry if this seems ignorant or is a stupid question: when I enter certain values and then hit "calculate", what's the green line with the red dot? Is that the persistent contrail line? In other words, it has to be above that in order for there to be persistent contrails?
 
Thanks for the calculator. I just want to make sure I'm understanding, and sorry if this seems ignorant or is a stupid question: when I enter certain values and then hit "calculate", what's the green line with the red dot? Is that the persistent contrail line? In other words, it has to be above that in order for there to be persistent contrails?

Essentially yes, it's the RHw value at that temperature for which RHi=100.

The dashed curved line uses the full Wexler formula. The green line uses a simple derived function:

RHi = RHw * (0.89 - (0.0148 * t))

Intended to be accurate over the range -70C to -30C (and more so from -60 to -40), and useful for manual calculation.
 
Last edited:
Note you can drag around the blue "RH Water" point, which might help clarify. Drag it along the green line, and notice that RHi stays around 100%
 
Essentially yes, it's the RHw value at that temperature for which RHi=100.

The dashed curved line uses the full Wexler formula. The green line uses a simple derived function:

RHi = RHw * (0.89 - (0.0148 * t))

Intended to be accurate over the range -70C to -30C (and more so from -60 to -40), and useful for manual calculation.

Ok, thanks. So when I plug in my numbers from today: RHw 41, pressure 300, temp -42.5, it says the Rhw has to be above 65.8% for persistent contrails. However, there were persistent contrails all afternoon. Are there other factors that are involved? I don't know how there were persistent contrails today.
 
Ok, thanks. So when I plug in my numbers from today: RHw 41, pressure 300, temp -42.5, it says the Rhw has to be above 65.8% for persistent contrails. However, there were persistent contrails all afternoon. Are there other factors that are involved? I don't know how there were persistent contrails today.

The problem is that it's very hard to get an accurate RHw for a particular point in space in time. The weather balloons are widely spaced, and not very accurate. See discussion here:

https://www.metabunk.org/accuracy-of-radiosonde-humidity-soundings-for-contrail-prediction.t758/
 
The problem is that it's very hard to get an accurate RHw for a particular point in space in time. The weather balloons are widely spaced, and not very accurate. See discussion here:

https://www.metabunk.org/accuracy-of-radiosonde-humidity-soundings-for-contrail-prediction.t758/

Well the one I found was close to where I am, and even if the humidity and temperature varied quite a bit, it should still be below the persistent chemtrail line.

Nonetheless, how DO you get an accurate RHw?
 
Nonetheless, how DO you get an accurate RHw?

Go up there with a cooled mirror hygrometer at the same time the contrail forms.

There are more accurate forecast models than single nearby sounding, but they are still just computed values. Unless you go measure it, you don't know for sure what it is.
 
Ok, so basically there's no way to figure out the persistent contrail issue? That's frustrating that we can't confirm one way or another. It's interesting, though, that yesterday the readings were almost exactly the same, however, there were NO visible contrails in the sky all day when just a few days ago with the same readings, there were long huge persistent ones. Just doesn't make sense.
 
Ok, so basically there's no way to figure out the persistent contrail issue? That's frustrating that we can't confirm one way or another.
Well, the best indicator that there is RHi above 100% is... persistent contrails! They're a far more accurate indicator than sounding balloons. :)

And yes, I am fully aware of the circular logic there.
 
Ok, so basically there's no way to figure out the persistent contrail issue? That's frustrating that we can't confirm one way or another. It's interesting, though, that yesterday the readings were almost exactly the same, however, there were NO visible contrails in the sky all day when just a few days ago with the same readings, there were long huge persistent ones. Just doesn't make sense.
Try earth.nullschool.net server to see the predicted RH values at the altitude of 250hPa in your area at the time. They correlate well with the occurrences of persistent contrails at least in Europe and North America. Here, for example, the "prediction" for California on April 20, 2016 at 21:00 UTC, which was a good day for contrails:
Screen Shot 2016-04-26 at 17.15.23.png
It correlates well with the satellite images of the day:
Screen Shot 2016-04-26 at 17.19.08.png

You can use earth.nullschool.net for real predictions, checking the predicted RH values for the next day or two, it generally works. I did it here a few times, the predicted values tend to change upon recalculation with the most recent data, but these changes are small. As in the weather forecast, the predicted persistent contrails may appear a bit earlier, or a bit later than the initial prediction.
 
Last edited:
Well, the best indicator that there is RHi above 100% is... persistent contrails! They're a far more accurate indicator than sounding balloons. :)

And yes, I am fully aware of the circular logic there.

Yes, circular logic, haha. When I see hundreds of persistent contrails on one day and then literally none the next day, and the weather was the same and the humidity was the same, it's curious, that's all.
 
Yes, circular logic, haha. When I see hundreds of persistent contrails on one day and then literally none the next day, and the weather was the same and the humidity was the same, it's curious, that's all.
How did you determine the weather and humidity were the same at altitude for both days?
 
Yes, circular logic, haha. When I see hundreds of persistent contrails on one day and then literally none the next day, and the weather was the same and the humidity was the same, it's curious, that's all.
Rather than using soundings, which are rather inaccurate and widely spaced (both temporally and geographically), have you tried using weather model data? For instance over the past couple of days there have been no contrails at all visible here in the southern UK, because the air is extremely dry up there:


However, by tomorrow there will be much more humidity around, so I would expect to see the contrails back again.


Maps like this are a much easier way to visualise the changing conditions than individual soundings are.
 
Rather than using soundings, which are rather inaccurate and widely spaced (both temporally and geographically), have you tried using weather model data? For instance over the past couple of days there have been no contrails at all visible here in the southern UK, because the air is extremely dry up there:

However, by tomorrow there will be much more humidity around, so I would expect to see the contrails back again.

Maps like this are a much easier way to visualise the changing conditions than individual soundings are.

Does it show the temp and humidity for altitudes that jets fly?
 
Does it show the temp and humidity for altitudes that jets fly?
Yes. The maps that I posted there are from publically available GFS data (the weather model run by NOAA). These ones give relative humidity at the 300 millibar pressure level, which equates to about 30,000 feet. Temperature is also available. See instantweathermaps.com for charts.

Obviously this is not foolproof, as contrails can also form lower than that, and much higher than that. For example I recently saw contrails forming at about 26,000 feet, even though the 300mb humidity was seemingly too low. In fact the tropopause was below 30,000ft on that occasion, so the air above was much drier, and all persistent contrails were below 30,000ft.

See https://www.metabunk.org/photos-of-...t-you-took-yourself.t1487/page-21#post-179910 and the following post.

Thanks, but I can't seem to find any maps like you're talking about unless I become a paid subscriber. I'm clicking MAPS, then GFS then US REGIONAL, and it takes me to a page to pay.
 
Thanks, but I can't seem to find any maps like you're talking about unless I become a paid subscriber. I'm clicking MAPS, then GFS then US REGIONAL, and it takes me to a page to pay.
Choose Maps, GFS, CONUS, Upper Air, then Relative Humidity at 300mb, at 0h.
 
Thanks. And what's the 0z, 6z, 12z, 18z?
And what's th 0h, 3h, 6h, etc.?

GFS is a forecast based on data taken at a certain time. the 0z, 6z etc. are Zulu Time for the base data of the forecast.

0h, 3h etc are forecasts relative to that base time.

Example: the most recent one is 2016-05-08 12Z - that's 12 noon (12PM) in Zulu/UTC/GMT, or 5AM PDT, May 9th
20160508-110936-gyf93.jpg

Here I've chosen the 24h forecast, so it's giving me the forecast for 12Z (5AM PDT) 24 hours after the base time, i.e. on May 9th (see the two date/times above the map)
 
guys can you expand on RHi vs RHw? how would ice even have an RH lower than 100 if its ice? little confused about this
 
guys can you expand on RHi vs RHw? how would ice even have an RH lower than 100 if its ice? little confused about this

Both RHi and RHw are a measure of the relative humidity of the air.

They values differ because they are measured relative to different things.

RHi is the humidity relative to the saturation vapour pressure over ice.

RHw is the humidity relative to the saturation vapour pressure over water.

The saturation vapour pressure basically means the humidity that you will find, at equilibrium, over a sheet of ice (for RHi) or a pool of water (for RHw) at the given temperature and pressure.

Water has a higher vapour pressure than ice (i.e. water vapour will come off water more easily than off ice), so it stands to reason that the humidity of a given volume of air will be lower when measured relative to water (RHw) than when measured relative to ice (RHi).

So a given humidity can be expressed as greater than 100% when measured as RHi, but less than 100% when measured as RHw.


There's a rather more technical explanation here: http://www.rhs.com/papers/RH_WMO.pdf
 
RHi is the humidity relative to the saturation vapour pressure over ice.

RHw is the humidity relative to the saturation vapour pressure over water.

And the "over water/ice" can be read quite literally - i.e. it's related to the situation where the water vapor (in the air) is right next to some liquid or solid water.

In a lab this would be "over" something like a beaker of water.

In the air it's over (around) other liquid micro drops or ice crystals, or an equivalent nucleation seed.

If it's greater than 100% for that substance, then it will condense on that substance.
 
Yes, another way of thinking about it is that water vapour in the air is more prone to condense onto ice than it is onto water. So as the air gets more humid, the humidity will hit 100% with respect to ice before it hits 100% with respect to water.
 
i see someone asked but i still dont get the instant weathermap....if i just want to know what the map is at this moment, what z and what h do i select?
 
Back
Top