Belfrey
Senior Member
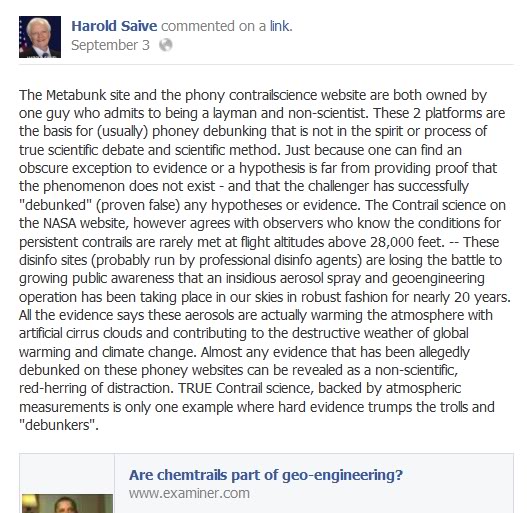
I noticed that Harold Saive was talking about this website again on his Facebook page.
Some interesting things there - he suggests that we are actually just providing "obscure exception(s) to evidence." He may be referring to the rainfall sampling results from older journal articles. What these actually do is show evidence that the results from his own rainfall sample are well within the normal range (actually on the low side) compared to common results from well before chemtrails supposedly started. The evidence from the scientific literature certainly does falsify the claim (made by Saive and others) that there should be absolutely no Al, Ba, or Sr in ordinary rainwater - a claim that I've never seen the believers try to support with evidence or reliable sources.
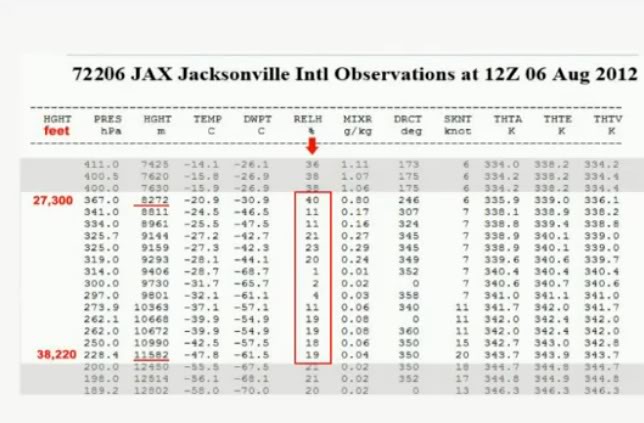
Interestingly, Saive has recently started to admit that persistent contrails exist, but now he claims that they can't happen at typical cruising altitude. He's started using this "conditions are bad for contrail formation above 28,000 feet according to NASA" claim a lot. As far as I can tell, it's based solely on results from a single weather balloon flight from Jacksonville (see Debunking NASA's Persistant Contrail Myth Using Weather Sonde Data), which shows low RH at flight altitude on a day (8/12/12) that he says contrails were reported as present in Jax:
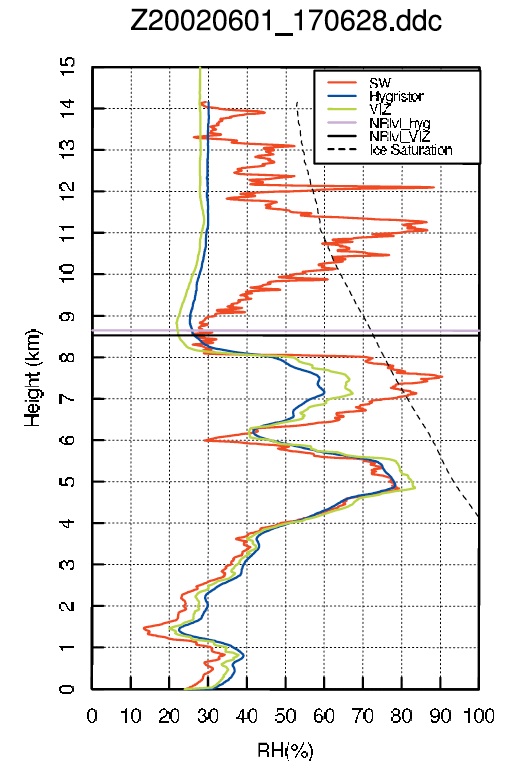
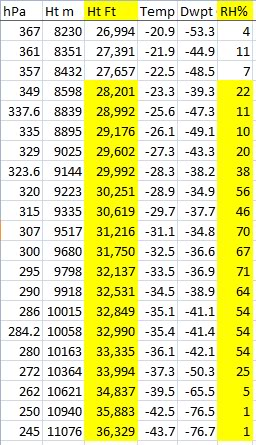
Of course, a weather balloon flight only samples one little spot in the sky at one point in time, and those conditions are not uniform or constant - if it happened to fly right through an area of sky where contrails were simultaneously being produced, that might be saying something. A single sample certainly does not show what is "typical" as Saive has been claiming. In fact, the balloon flight from Jacksonville for later that same day shows much higher RH (up to about 70%) for typical cruising altitudes:
 [/S]
[/S]
Some interesting things there - he suggests that we are actually just providing "obscure exception(s) to evidence." He may be referring to the rainfall sampling results from older journal articles. What these actually do is show evidence that the results from his own rainfall sample are well within the normal range (actually on the low side) compared to common results from well before chemtrails supposedly started. The evidence from the scientific literature certainly does falsify the claim (made by Saive and others) that there should be absolutely no Al, Ba, or Sr in ordinary rainwater - a claim that I've never seen the believers try to support with evidence or reliable sources.
Interestingly, Saive has recently started to admit that persistent contrails exist, but now he claims that they can't happen at typical cruising altitude. He's started using this "conditions are bad for contrail formation above 28,000 feet according to NASA" claim a lot. As far as I can tell, it's based solely on results from a single weather balloon flight from Jacksonville (see Debunking NASA's Persistant Contrail Myth Using Weather Sonde Data), which shows low RH at flight altitude on a day (8/12/12) that he says contrails were reported as present in Jax:
Of course, a weather balloon flight only samples one little spot in the sky at one point in time, and those conditions are not uniform or constant - if it happened to fly right through an area of sky where contrails were simultaneously being produced, that might be saying something. A single sample certainly does not show what is "typical" as Saive has been claiming. In fact, the balloon flight from Jacksonville for later that same day shows much higher RH (up to about 70%) for typical cruising altitudes:
Last edited by a moderator: